Abstract
Imaging plays a vital role in radiation therapy and with recent advances in technology considerable emphasis has been placed on cone-beam CT (CBCT). Attaching a kV x-ray source and a flat panel detector directly to the linear accelerator gantry has enabled progress in target localization techniques, which can include daily CBCT setup scans for some treatments. However, with an increasing number of CT scans there is also an increasing concern for patient exposure. An intensity-weighted region-of-interest (IWROI) technique, which has the potential to greatly reduce CBCT dose, in conjunction with the chord-based backprojection-filtration (BPF) reconstruction algorithm, has been developed and its feasibility in clinical use is demonstrated in this article. A nonuniform filter is placed in the x-ray beam to create regions of two different beam intensities. In this manner, regions outside the target area can be given a reduced dose but still visualized with a lower contrast to noise ratio. Image artifacts due to transverse data truncation, which would have occurred in conventional reconstruction algorithms, are avoided and image noise levels of the low- and high-intensity regions are well controlled by use of the chord-based BPF reconstruction algorithm. The proposed IWROI technique can play an important role in image-guided radiation therapy.
Keywords: ROI imaging, conebeam CT, chord based reconstruction, IGRT, imaging dose reduction
INTRODUCTION
Cone-beam CT (CBCT) is widely used in image-guided radiation therapy (IGRT) partly due to its rich anatomical information and convenience of use. Target localization is one of the most important steps in IGRT procedures, and a primary reason for using CBCT is to determine the current position of the target and the surrounding normal tissues inside the patient.1, 2, 3 An accurate image of the target is essential for proper target positioning. Uncertainty of the target position requires the use of larger margins in treatment planning which can increase the likelihood of normal tissue complications. Therefore, an accurate image of the target reconstructed by CBCT can improve the chance of favorable patient outcome. The kV cone-beam imaging capability currently available with linear accelerator treatment systems provides excellent soft-tissue contrast and the potential for dose reduction compared to megavoltage (MV) CBCT images, an important benefit in IGRT.
However, total radiation dose to the patient from CBCT imaging prior to each fraction still poses a radiation safety concern.4 Although the biological effects of imaging radiation dose on the tumor control probability of the target in IGRT require further investigation, it is desirable to spare imaging radiation dose to the normal tissues surrounding the target. Sparing dose to the normal tissues becomes imperative when these tissues are particularly radiation sensitive, such as eyes, breast, or spinal cord. An accurate region-of-interest (ROI) imaging technique in this regard is a potentially important tool for routine CBCT in IGRT. ROI imaging here is used to mean that only the projection of a desired ROI is taken for each view, thereby reducing the dose outside of the ROI. Interestingly, in the report of AAPM Task Group 75, the authors envisioned that a more sophisticated reconstruction technique would be necessary to perform ROI imaging, and thereby reducing imaging radiation dose to the tissues outside the ROI.4 In this article we report the use of such an advanced reconstruction.
Some of the recently developed image reconstruction algorithms for CBCT can perform certain ROI reconstructions.5, 6, 7, 8 The chord-based backprojection-filtration (BPF) algorithm, for example, can produce accurate ROI images in general CBCT scanning configurations. Data truncation artifacts, often appearing in the reconstructed ROI images using conventional algorithms, can often be avoided by use of the chord-based BPF algorithm. However, for imaging targets located deep within the body the ROI becomes an interior problem, for which no stable, accurate image reconstruction method exists.9 One approach using the local tomography method provides edge-enhanced images from ROI projection data,10 but this approach does not provide accurate image contrast information which is important in many applications including IGRT.
The proposed intensity-weighted region-of-interest (IWROI) imaging technique can reduce the imaging radiation dose to structures away from the imaging target, while allowing solution of the reconstruction problem by using the chord-based BPF algorithm. We subdivide the reconstructed ROI into inner and outer regions and illuminate the outer region with a filtered beam to decrease exposure during the scan. An intensity-weighting technique has been previously proposed for ROI imaging applications in diagnostics, but only with a conventional reconstruction algorithm which requires nontruncated data for accurate reconstruction.11, 12, 13 A method using two scans, one of which is performed with a full field of view (FOV) and low exposure and the other with a limited FOV and high exposure, has also been studied14 but this method doubles the acquisition time. Our approach allows some types of data truncation without causing artifacts in the reconstructed ROI image and allows different exposure levels in two sub-ROIs from a single scan. In this work, we focus on circular CBCT, which is the dominant imaging modality employed in most radiation therapy systems, although the method can be extended to general scanning configurations such as the saddle trajectory.
BACKGROUND
The Feldkamp–Davis–Kress (FDK) algorithm is the most widely used algorithm for 3D circular CBCT image reconstruction because of its computational efficiency and acceptable image quality in many applications.15 However, in the presence of transverse data truncation, the FDK algorithm produces truncation artifacts in the reconstructed images. Since transverse data truncation is common if not unavoidable in ROI imaging, an algorithm that is more robust against transverse data truncation is desirable. The chord-based BPF algorithm is an analytic algorithm that can stably reconstruct ROI images on chords from truncated data. This capability of the BPF algorithm in ROI imaging has been exploited to potentially increase spatial resolution by using a larger geometric magnification in micro-CT applications.16
Chord-based BPF algorithm for ROI imaging
The chord concept has been developed for exact image reconstruction of a CBCT with general source trajectories; it is rooted in the development of algorithms for helical CBCT. A chord is defined as a line segment connecting any two points on a continuous source trajectory. Specifically, in helical CBCT, a chord connecting two points on the trajectory within one turn is referred to as a PI-line segment. The chord-based BPF algorithm essentially decomposes the image into a number of chords that intersect the imaged object and collectively cover the ROI. The algorithm reconstructs the ROI image along the individual chords. In circular CBCT, since chords can be defined only for the midplane in which the source trajectory resides, virtual source trajectories have been introduced for off midplanes. Additionally, we have introduced virtual chords that connect any two points on the virtual source trajectories. Approximate image reconstruction, therefore, can be performed by use of the BPF algorithm for those off midplanes.17, 18 Derivatives of the cone-beam data acquired by a circular scan are backprojected first onto each chord, followed by the filtering along each chord in one dimension. In the FDK algorithm the filtering occurs in the projection data, thus transverse truncation can produce artifacts in the reconstructed images. In contrast, as long as the imaged object is not truncated along a given chord, the image on the chord can be reconstructed accurately by the chord-based BPF algorithm despite truncations in the projection data. This is the key feature of the chord-based BPF algorithm that enables accurate ROI imaging.
IWROI image reconstruction in circular CBCT
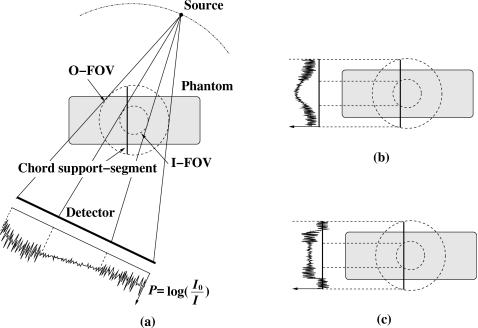
In many IGRT applications such as prostate cancer treatment, the imaging target is located deep within the tissue. In this case, we can subdivide the ROI into two regions: inner ROI and outer ROI. The inner ROI can be selected to cover the imaging target, for example, the prostate and nearby organs at risk. The outer ROI would be the remainder of the imaged volume and would include some of the skeletal structures which can be used for image registration. A higher noise level may be tolerable in the outer ROI for skeletal registration as compared to the inner ROI where maximum image quality is required for soft-tissue discrimination. Therefore, we propose to scan the patient with two different levels of exposure: Full exposure to the inner ROI and reduced exposure to the outer. This can be simply implemented using suitable filters in the x-ray beam. Reduced exposure in the outer ROI will decrease the patient dose due to imaging. Additionally the decreased fluence will result in less scatter from the patient’s body. Accordingly, the quantum noise level in each projection will be higher in the outer region. Noise properties of the chord-based BPF algorithm have been carefully investigated and it has been shown that the noise of the reconstructed image along a chord is localized in a practical sense.19, 20 This means that the higher noise level in the outer ROI will not substantially affect the noise level in the inner ROI after reconstruction. Figure 1 schematically illustrates the noise propagation in the image reconstruction. Different noise levels in the projection data are merged onto a chord support segment after backprojection, and noise levels remain well separated even after filtration. Numerical simulation studies have successfully verified this noise confinement property of the algorithm in IWROI imaging.21 The convolution kernel used in the FDK algorithm is also relatively localized, so that the intensity-weighted imaging technique can be utilized with the FDK algorithm in cases where data truncation is negligible or can be compensated for. However, as will be demonstrated, even advanced correction schemes applied in conjunction with FDK cannot correct for large truncations, which may occur for ROI imaging of some anatomical sites.
Figure 1.
(a) For each view, the projection data can be separated into two regions having less noise due to higher exposure and vice versa. The noise levels are almost locally confined after (b) backprojecting the data on to a chord support segment and (c) filtration along the chord. Cone-beam data P are calculated from I0 and I, which stand for flood field (referred to as open field in this paper) and projection, respectively.
METHODS
System and filters
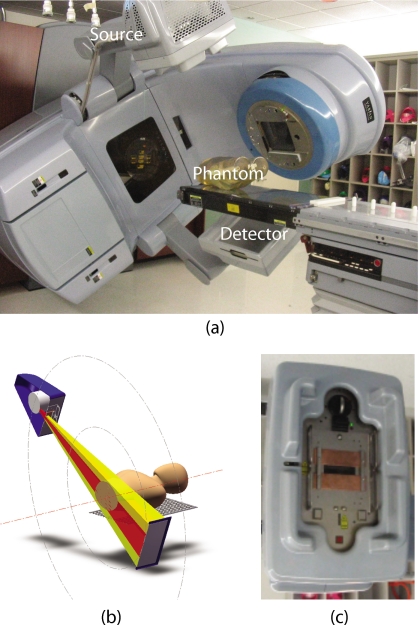
The imaging work presented here was done with the on-board imaging (OBI) system on a Trilogy linear accelerator (Varian Medical Systems, Palo Alto, CA). The OBI system is composed of an x-ray source and a flat panel detector mounted on the accelerator gantry orthogonal to the treatment beam as shown in Fig. 2. The scanning parameters used in this work are summarized in Table 1. A standard clinical scanning protocol with bowtie filter in place uses a beam current 80 mA and a 25 ms pulse. This study removed the bowtie filter leaving portions of the beam completely unfiltered, thus the exposure time was reduced to 13 ms to achieve reasonable intensity levels for open-field images. For reconstruction consistency, acquisition was always performed using a counterclockwise gantry rotation. The field was narrowly collimated in the axial (y) direction to minimize scatter effects in the reconstructed image. It was found that even with such a narrow field, scatter is great enough that a scatter correction is required. Four sets of filters were used for the intensity weighting, two each of copper and aluminum. For brevity the filters will be referred to with the following naming convention; Cu1, Cu2, Al1, and Al3 representing 0.32, 0.64, 1.60, and 4.80 cm thicknesses, respectively. These thicknesses were chosen to provide great enough separation of intensity levels in the filtered regions in order to quantify the corresponding changes in image noise. The filters were simple rectangular slabs with square edges and attached to a spare bowtie filter mounting plate.
Figure 2.
The OBI system used in the experiment. (a) A picture of the system. (b) Schematic view of the imaging configuration. (c) A picture of the kV source with the IW filters mounted.
Table 1.
System parameters.
| Source | Detector | Geometry | |||
|---|---|---|---|---|---|
| Parameter | Value | Parameter | Value | Parameter | Value |
| Mode | Full fan | Size_x | 39.73 cm | SAD | 100 cm |
| kVp | 125 kV | Size_y | 29.80 cm | SDD | 149.9 cm |
| mA | 80 mA | Pixel pitch | 194 μm | Start angle | −182° |
| ms | 13 ms | Pixel matrix | 2048×1536 | Stop angle | 178° |
| Collimator_x | ±13.5 cm | Binning | 2×2 | No. projections | ∼860 |
| Collimator_y | ±3.0 cm | Eff. pixels | 1024×768 | ||
Phantoms
Three different phantoms were used for this study. The first was a solid water (SW) phantom which consisted of 30×30 cm2, solid water slabs, commonly available in radiation oncology clinics, stacked 16 cm high. A separate phantom was used for contrast to noise ratio (CNR) measurements, which we refer to as the CNR phantom. This phantom was similarly made from a stack of solid water slabs with a sheet of lucite as a low contrast element and two Teflon rods as high contrast elements. Finally a pelvis phantom was also imaged, consisting of a partial skeleton ranging from the L1 lumbar vertebra through the mid femur, embedded in lucite formed into a human shaped contour. There were however no soft-tissue inhomogeneities in this phantom.
Data corrections
Although the use of IW filters can help decrease scatter in cone-beam projections, the presence of scatter can still be a limitation to image quality and accuracy. Additionally, local variations in beam quality due to hardening by the IW filters can substantially alter the image accuracy; a harder beam lowers the estimated attenuation coefficient. Both of these physical factors, if uncorrected, can degrade image quality. We used a simple, direct method proposed by Siewerdsen et al. for scatter estimation.22 A first-order approximate correction method for the beam-quality effect was used. Note that we use the term “beam-quality effect” rather than “beam hardening” to emphasize that this is not a beam hardening correction as usually understood, which deals with hardening of the beam as it penetrates the patient.
Scatter correction
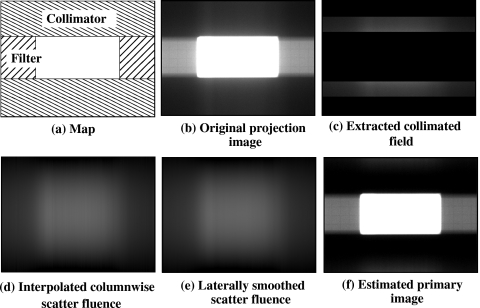
The scatter estimation method22 for cone-beam projections is based on the assumption that the detector signal measured in regions behind the collimator blades is attributable to x-ray scatter. Because the algorithm estimates scatter fluence directly from the projection data, it is robust to a number of variations that exist in cone-beam scans including imaging configuration, patient motion, system geometry, and so on. For each projection we used a second-order polynomial interpolation from the collimator shadows to estimate columnwise scatter fluence. An estimate of the 2D scatter fluence was then obtained by lateral smoothing of the columnwise scatter estimates across all columns. The estimated 2D scatter fluence was subtracted from the original projection, resulting in an estimate of the primary image. Each of the steps in the correction method are illustrated in Fig. 3.
Figure 3.
Scatter correction procedure is illustrated with example images. (a) The collimators and the IW filters are positioned. (b) Original projection image of a phantom. (c) Projection data under the collimators are extracted. (d) Column wise interpolation is applied for each column. (e) Lateral smoothing is performed to finally estimate the scatter fluence. (f) Original image subtracted by the estimated scatter fluence.
Heterogeneous beam-quality correction
The reconstruction process involves transformations of the cone-beam data (represented as P in Fig. 1) rather than the raw projection data. The cone-beam data ideally represent the integrated attenuation along each ray. For the present study, this was calculated as the natural logarithm of the ratio of the open field intensity map to the acquired projection. The open field intensity was measured by taking a repeat scan with the same x-ray technique, geometric parameters, and filters in place, but the couch and phantom removed from the field of view. The division process in calculating P should normalize out the reduced beam intensity of the filtered region. However, since this beam has been hardened by the filter, the computed attenuation values will be lower than in the unfiltered region. In order to increase the accuracy of the image values in the filtered region and increase value consistency with the unfiltered region, a simple first-order approximate correction scheme was applied. The assumption was made that the energy spectra of the beams could be represented by single average energies. Additionally, the assumption was made that the ratio of linear attenuation coefficients for the two energies was similar to that of water, for all imaged materials. The second assumption is expected to be valid for air, water, and muscle in the x-ray energy range used in this work, but to slightly underestimate the ratio for bone. Following this assumption, the beam-quality correction was performed by simply multiplying the cone-beam data (P) under the IW filter by the estimated ratio of attenuation coefficients without and with the filter. This was estimated from the anterior-posterior (AP) projection of the solid water phantom, where there was an almost uniform thickness of uniform material for both filtered and unfiltered rays. Variation in the thickness due to obliquity was computed to have less than 0.2% effect on the reconstructed image. The square edges of the IW filters resulted in a geometric penumbra region in the projection image, and interpolated ratio values were used in this transition region.
RESULTS
Data corrections
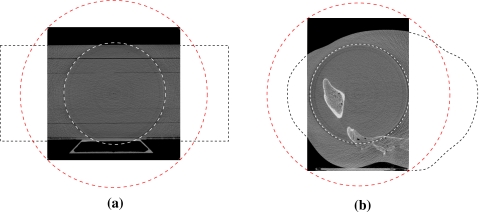
All of the results presented in the following sections are based on corrected data, where the scatter correction and the beam-quality correction have both been applied to the projection data. Unless otherwise noted, the boundary between the inner and outer regions can be visualized in the images as the prominent ring due to the sharp transition in intensity which has not yet been corrected for. All images presented here represent the reconstructed region based on a rectangular parallel chord set that fits the FOV as shown in Fig. 4, and the object extending beyond the FOV (indicated by the outer dashed ring) had been truncated.
Figure 4.
Transverse slice images of the reconstructed phantoms to illustrate the inner and outer rings that define filtered zone and the full extent of the illumination, respectively. Approximate outlines of the phantoms have also been included to help visualize the scanning configuration in (a) SW phantom or CNR phantom (SW shown) and (b) pelvis phantom.
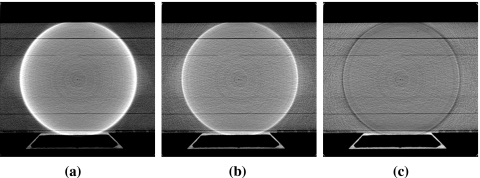
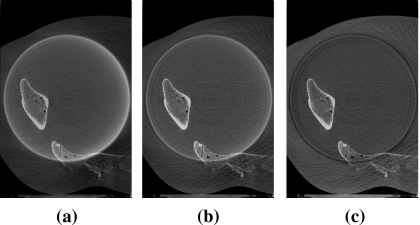
Examples of uncorrected and partially corrected data are shown to visualize the effects of data corrections in this section. In Fig. 5 we display reconstructed images of the SW-phantom scanned with the Cu1 filter (a) before any correction, (b) after scatter correction, and (c) after scatter and beam-quality correction. A cupping artifact due to scatter is observed in Fig. 5a and is suppressed substantially after the scatter correction is applied, as shown in (b). Image uniformity is recovered after beam-quality correction (c). The same correction parameters have been applied in the pelvis phantom scan to see the correction effects for a more realistic case, and the results are displayed in Fig. 6.
Figure 5.
Transverse slice images of the reconstructed SW-phantom scanned with Cu1 filter are displayed: (a) No correction, (b) scatter correction, and (c) scatter+beam-quality correction have been applied. Display window is [0.1,0.3] cm−1. Inner and outer ROIs can be easily distinguished by the pronounced ring artifact in this figure and in all the following figures.
Figure 6.
Transverse slice images of the reconstructed pelvis phantom scanned with Cu1 filter are displayed: (a) No correction, (b) scatter correction, and (c) scatter+beam-quality correction have been applied. Display window is [0.1,0.6] cm−1.
Noise study
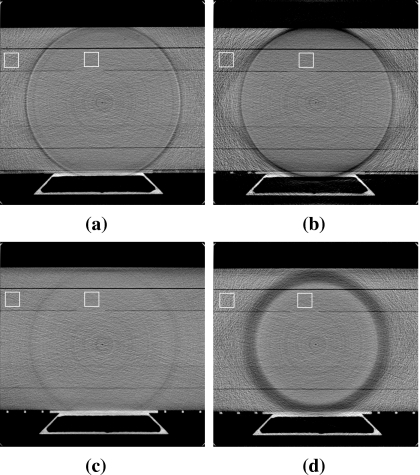
A noise evaluation study was performed with the SW phantom for each of the four different filters (see Fig. 7). Small square regions were selected from each image within the inner and outer ROIs for statistical analysis. Coefficients of variation (standard deviation divided by the mean value) were computed and the results are summarized in Table 2.
Figure 7.
Transverse slice images of the reconstructed SW-phantom scanned with (a) Cu1 filter, (b) Cu2 filter, (c) Al1 filter, and (d) Al3 filter. Display window is [0.1,0.3] cm−1.
Table 2.
Noise levels (coefficients of variation) measured in inner and outer ROIs of the SW phantom.
| Inner (%) | Outer (%) | |
|---|---|---|
| Cu1 | 5.1 | 8.3 |
| Cu2 | 5.0 | 14.5 |
| Al1 | 4.9 | 6.1 |
| Al3 | 5.3 | 9.8 |
CNR study
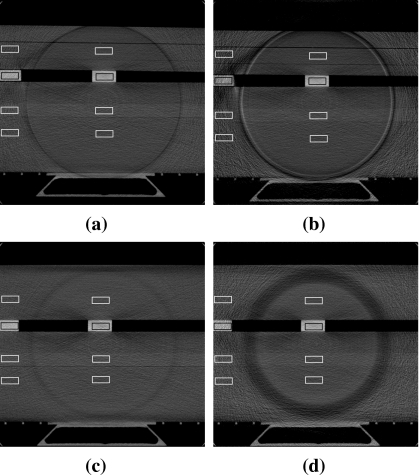
Similarly, a CNR evaluation study was performed with the CNR phantom for each of the four filters. Eight small rectangular regions were selected from each image, four each in the inner and outer regions, positioned within the contrast media and nearby solid water background. The upper pairs in the images in Fig. 8 were used for the calculation of the contrast to noise ratio in Teflon and the lower set for lucite. For a given contrast material (medium1), e.g., Teflon rod, the adjacent solid water region (medium2) was selected for the CNR calculation. CNR in this study was defined as
| (1) |
where Mean1 and Mean2 stand for the mean values of medium1 and medium2, and StandDev1 and StandDev2 represent the standard deviations of medium1 and medium2, respectively. The results are summarized in Table 3.
Figure 8.
Transverse slice images of the reconstructed CNR-phantom scanned with (a) Cu1 filter, (b) Cu2 filter, (c) Al1 filter, and (d) Al3 filter. Display window is [0.1,0.6] cm−1.
Table 3.
CNR measured for high contrast medium (Teflon) and for low contrast medium (Lucite) with respect to solid water in inner and outer ROIs. Contrast and noise are in units of cm−1.
| Teflon | Lucite | |||||||||||
|---|---|---|---|---|---|---|---|---|---|---|---|---|
| Inner | Outer | Inner | Outer | |||||||||
| Contr. | Noise | CNR | Contr. | Noise | CNR | Contr. | Noise | CNR | Contr. | Noise | CNR | |
| Cu1 | 0.146 | 1.32×10⁻² | 11.1 | 0.155 | 1.92×10⁻² | 8.10 | 1.10×10⁻² | 1.57×10⁻² | 0.701 | 1.21×10⁻² | 1.86×10⁻² | 0.651 |
| Cu2 | 0.152 | 1.29×10⁻² | 11.8 | 0.121 | 3.40×10⁻² | 3.57 | 1.21×10⁻² | 1.54×10⁻² | 0.785 | 6.08×10⁻³ | 3.09×10⁻² | 0.197 |
| Al1 | 0.132 | 1.55×10⁻² | 8.53 | 0.159 | 1.58×10⁻² | 10.1 | 1.04×10⁻² | 1.67×10⁻² | 0.624 | 1.25×10⁻² | 1.61×10⁻² | 0.775 |
| Al3 | 0.144 | 1.53×10⁻² | 9.46 | 0.139 | 2.87×10⁻² | 4.84 | 8.57×10⁻³ | 1.48×10⁻² | 0.579 | 5.89×10⁻³ | 2.75×10⁻² | 0.214 |
Pelvis phantom
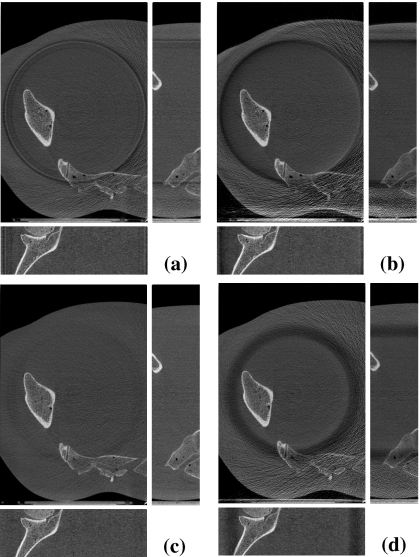
To test the method in a quasiclinical setting, we used the pelvis phantom. Although it does not have any soft-tissue regions, it contains bony structures that can be assessed qualitatively or quantitatively for further studies such as image registration. Reconstructed images along transverse, coronal, and sagittal planes are shown in Fig. 9 for four IW filters.
Figure 9.
Slice images—transverse (center), sagittal (right), and coronal (bottom) images—of the reconstructed pelvis phantom scanned with (a) Cu1 filter, (b) Cu2 filter, (c) Al1 filter, and (d) Al3 filter. Display window is [0.1,0.6] cm−1.
DISCUSSION
There have been a number of reported efforts to reduce imaging radiation dose outside a ROI by use of filters. Zonal filters have been used to reduce exposure outside of the windowed region along the longitudinal direction, which does not achieve ROI imaging in transverse planes.23 ROI filters have also been used for diagnostic purposes such as angiography, head scan, and breast scan.11, 12, 13 However, since only conventional reconstruction based on the FDK algorithm has been employed in these applications, transverse data truncation that can cause image artifacts was minimal or avoided entirely. In contrast, our proposed approach can take advantage of the robustness of the BPF algorithm against transverse data truncation and enables further dose reduction, for some imaging tasks, by reducing the field of view and purposely allowing data truncation.
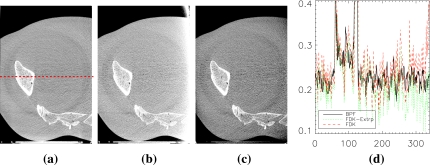
An example of truncation artifacts is shown in Fig. 10b, where the same amount of projection data used in our work was used for image reconstruction by the FDK algorithm with the Ram–Lak filter. There exist approximate methods such as data extrapolation for reducing data truncation artifacts, and they may improve the image quality substantially depending on the degree of data truncation in an imaging task. However, because the proposed IWROI imaging technique often involves considerable data truncation, a simple correction scheme such as symmetric mirroring extrapolation24 may not work as well as in more favorable applications. For example, if a breast is selected as the ROI in breast IGRT, the entire body outside of the breast region will be truncated. Data truncation occurring at highly attenuating materials such as bony structures is also considered hard to compensate for with simple corrections. As shown in Fig. 10c, a linear extrapolation leads to overcorrection in the pelvis example because the data near one edge of the detector tend to decrease slowly or even increase in some projection angles. Because the convolution kernel in the FDK algorithm has a long negative tail, the extrapolated data in this case contribute to lowering the pixel values after filtering and backprojection. Although it may be possible to devise an approximate correction scheme more appropriate than a simple extrapolation in certain situations, assumptions of accuracy and robustness against serious data truncation that may arise in a variety of ROI imaging tasks are generally unwarranted. The ring artifacts are more conspicuous in the BPF reconstructed images due to the relatively lower noise background.
Figure 10.
Truncation artifacts are pronounced in (b) where the FDK algorithm has been used for image reconstruction with the same amount of data that were used in (a) by the chord-based BPF algorithm. The corresponding image reconstructed by the FDK algorithm with a linear extrapolation correction is shown in (c). Display window of [0.14,0.32] cm−1 is used for all images to enhance visualization of the artifacts. Line profiles of the three images along the dashed line shown in (a) are plotted in (d). Solid line represents (a), dashed line (b), and dotted line (c).
The chord-based BPF algorithm in contrast achieves accurate image reconstruction in the face of a large degree of data truncation, which is a fundamental and often important advantage, for example, when CT numbers are to be used as input to radiation transport calculations, or intensity-based segmentation or registration methods. Of course, there may also be situations in which the inaccuracies in FDK reconstructions from truncated data can be acceptable. The accuracy of the chord-based BPF reconstruction has been verified extensively both in numerical and experimental studies.25, 16
The proposed IWROI technique can achieve more dose reduction than conventional approaches11, 12, 13 without appreciably sacrificing ROI image quality because the robustness to transverse data truncation allows the illuminated region to be further reduced. The zonal filter approach23 is not directly comparable with the IWROI technique in terms of dose saving because it cannot deal with ROI imaging tasks with transverse data truncations, although it can be considered a synergistic way to improve dose management. A variety of clinical scanning tasks can be performed by use of the IWROI technique, including a breast scan, hemithorax lung scan, extremities, and central-pelvis scan among many others. The potential amount of dose sparing from regional illumination allowed by using BPF reconstruction will be highly task dependent. Typically more superficial sites such as breast, head∕neck malignancies, and extremities will see the largest dose sparing. Sites off the central axis of the body may require more advanced hardware for true region of interest illumination but may still benefit significantly. Deep-seated sites may not be spared much dose but this technique with the chord-based reconstruction should perform no worse than if a conventional reconstruction were used.
IW filters are fundamentally different from bowtie filters, which are widely used in clinical systems such as OBI, in that the primary purpose of the bowtie filter is to improve overall image quality.26 Attenuation of the beam particularly at the peripheral regions of the patient allows the signal intensity to stay within the dynamic range of the detector. Reduced scatter due to attenuation of the beam can also contribute to better image quality. Imaging radiation dose reduction to the patient is an additional advantage of using bowtie filter, although it is not the primary concern. IW filters are introduced to reduce imaging radiation dose to the patient substantially by sacrificing the image quality in selected regions. Therefore the amount of beam filtration from the IW filters is substantially greater than that of the bowtie filters. In order to estimate the amount of beam filtration, exposure was measured with each filter using a Keithley parallel plate ion chamber (75972) and dosimeter (35050A). The results are summarized in Table 4. Although some reduction in exposure has been achieved by the Al1 filter which is close to a conventional bowtie filter in thickness, the ratio of the reduction becomes greater when other filters are used. Scatter -to-primary ratio (SPR) was estimated by use of Siewerdsen’s method for AP projection images of the SW phantom for each filter. The computed SPR values from the central region are listed in Table 4 as well. It is interesting to note that the results support the fact that the use of bowtie filter, i.e. the IW filters in this case, contributes to scatter reduction, although it can be difficult to directly relate the reduction in scatter to the reduction in exposure quantitatively.
Table 4.
Exposure was measured ten times at 125 kVp, 80 mA, 65 ms for each case, and average values are listed. SPR is estimated in the middle of AP projections of the SW phantom.
| Exposure (mR) | Exposure reduction (%) | SPR (%) | |
|---|---|---|---|
| No filter | 77.6 | 0 | 11 |
| Al1 | 14.1 | 81.8 | 10 |
| Al3 | 1.74 | 97.8 | 8.3 |
| Cu1 | 2.81 | 96.4 | 9.2 |
| Cu2 | 0.62 | 99.2 | 8.7 |
Throughout the reconstructed images in the previous section, ring artifacts are pronounced, although the severity varies depending on filter type and thickness. We would like to draw a distinction between the ring artifacts here and the ring artifacts conventionally encountered. Conventional ring artifacts result primarily from nonuniform detector response, which is generally well corrected for in these data. The ring artifacts in this work can be attributed to several factors: inaccurate correction of scatter and heterogeneous beam quality, filter shape, and position, and gravitationally induced pointing errors in the x-ray source. Since our correction methods are approximate and only first order, they may, in fact, amplify data inconsistency resulting in the ring artifacts. Asymmetry of the filter positions in terms of rotation axis would result in a ring-band structure in the images. The aforementioned deficiencies in correction methods and filter position asymmetry are thought to be the primary causes of the thick dropout in the images with Al3 filter. The sharp edges of the filters may also aggravate the effects of the asymmetry and thus increase inconsistency between projection data. Pointing errors and vibration in the source can cause inconsistencies in the transition region that may also increase these artifacts. Accounting for edge effects in the filter design may help minimize the ring artifacts. Pre- or postreconstruction correction algorithms for ring artifacts can be utilized as well, if necessary.27
Noise properties of the reconstructed images depend on a number of factors including exposure, electronic noise, energy response of the detector, and reconstruction algorithm. Although more rigorous analysis based on models such as cascaded linear systems of the overall imaging system can help to better understand the image noise, exposure plays a dominant role in determining the noise level of reconstructed images because the imaging system is quantum limited for scanning parameters used in this work.28 Slightly higher noise in the inner ROI with Al3 filter compared to others is thought to be due to more contamination of the data by scatter from this thick filter. CNR is also related to the factors that affect noise and, in addition, it is susceptible to additional image artifacts such as metal artifacts. Teflon rods create streak patterns around them and degrade image uniformity not only of the rods themselves but also of the neighboring materials. However, inner ROI CNRs of the high contrast material (Teflon) and the low contrast material (Lucite) in solid water are both up to about eight times higher than outer ROI CNRs. Image artifacts are thought to dominate CNR characteristics in Al1-filter case, where an inversion of the expected was observed.
Measurement of the dose reduction by use of the IW filters is in progress and will be reported elsewhere. The influence of image CNR on accuracy of image registration in IGRT must also be investigated so that the proper design of the IW filter can be obtained, for both dose reduction and successful image guidance. Although only a full-fan geometry, where the rotation axis is projected onto the central vertical line of the detector, is assumed in this work, a half-fan geometry in which the rotation axis is projected onto an off-central vertical line of the detector can also be used for the proposed IWROI imaging. The extended FOV of a half-fan geometry can be particularly useful for obese patients.
SUMMARY
Imaging radiation dose to a patient by repeated CBCT poses a patient radiation safety concern. In this regard, ROI imaging, which limits dose mostly to the imaging target, is desirable. Since ROI imaging of the target in many cases leads to an interior problem, we devised the IWROI method, which illuminates an outer ROI around the target with a reduced fluence, thereby permitting accurate reconstruction. Accurate image information within the inner ROI is maintained as required for tumor localization, whereas relatively poorer image quality in the outer ROI can still result in acceptable image registration in IGRT. The proposed method can reconstruct the target image with high CNR and the surrounding tissue image with a relatively low CNR. Data truncation artifacts can be avoided by using the proposed chord-based BPF-type algorithm, and noise propagation from outer ROI to inner ROI is well suppressed due to the noise properties of this algorithm. We believe the proposed approach is a promising new technique for CBCT in IGRT.
ACKNOWLEDGMENTS
The authors would like to thank K. Farrey for his help on using the OBI system and Dr. G. Ding at Vanderbilt University for granting the use of the spectrum data of the OBI system. One of the authors (S.C.) is supported in part by a DOD predoctoral training Grant PC061210. One of the authors (E.P.) is supported by NIH predoctoral training Grant T32 EB002103. This work was supported in part by Varian Medical Systems, Palo Alto, CA, and in part by National Institutes of Health under Grant Nos. EB00225 and CA120540. Partial funding for this work was also provided by the NIH S10 RR021039 and P30 CA14599. The contents of this article are solely the responsibility of the authors and do not necessarily represent the official views of any of the supporting organizations.
References
- Jaffray D. A., “Emergent technologies for 3-dimensional image-guided radiation delivery,” Semin. Radiat. Oncol. 15, 208–216 (2005). [DOI] [PubMed] [Google Scholar]
- Xing L., Thorndyke B., Schreibmann E., Yang Y., Li T.-F., Kim G.-Y., Luxton G., and Koong A., “Overview of image-guided radiation therapy,” Med. Dosim. 31, 91–112 (2006). [DOI] [PubMed] [Google Scholar]
- Balter J. M. and Kessler M. L., “Imaging and alignment for image-guided radiation therapy,” J. Clin. Oncol. 25, 931–937 (2007). [DOI] [PubMed] [Google Scholar]
- Murphy M. J., Balter J., Balter S., Bencomo J. A., Das I. J., Jiang S. B., Ma C. M., Olivera G. H., Rodebaugh R. F., Ruchala K., Shirato H., and Yin F. F., “The management of imaging dose during image-guided radiotherapy: Report of the AAPM Task Group 75,” Med. Phys. 10.1118/1.2775667 34, 4041–4063 (2007). [DOI] [PubMed] [Google Scholar]
- Zou Y. and Pan X., “Image reconstruction on PI-lines by use of filtered back projection in helical cone-beam CT,” Phys. Med. Biol. 10.1088/0031-9155/49/12/017 49, 2717–2731 (2004). [DOI] [PubMed] [Google Scholar]
- Zou Y., Pan X., and Sidky E. Y., “Theory and algorithms for image reconstruction on chords and within regions of interest,” J. Opt. Soc. Am. A 10.1364/JOSAA.22.002372 22, 2372–2384 (2005). [DOI] [PubMed] [Google Scholar]
- Noo F., Clackdoyle R., and Pack J., “A two-step Hilbert transform method for 2D image reconstruction,” Phys. Med. Biol. 10.1088/0031-9155/49/17/006 49, 3903–3923 (2004). [DOI] [PubMed] [Google Scholar]
- Pack J. D. and Noo F., “Cone-beam reconstruction using 1D filtering along the projection of M-lines,” Inverse Probl. 10.1088/0266-5611/21/3/019 21, 1105–1120 (2005). [DOI] [Google Scholar]
- Natterer F., The Mathematics of Computerized Tomography (Wiley, New York, 1986). [Google Scholar]
- Faridani A., Finch D. V., Ritman E. L., and Smith K. T., “Local tomography II,” SIAM J. Appl. Math. 10.1137/S0036139995286357 57, 1095–1127 (1997). [DOI] [Google Scholar]
- Chityala R., Hoffmann K. R., Bednarek D. R., and Rudin S., “Region of interest (ROI) computed tomography,” Proc. SPIE 5368, 534–541 (2004). [DOI] [PMC free article] [PubMed] [Google Scholar]
- Chityala R., Hoffmann K. R., Rudin S., and Bednarek D. R., “Region of interest (ROI) computed tomography (CT): Comparison with full field of view (FFOV) and truncated CT for a human head phantom,” Proc. SPIE 10.1117/12.595430 5745, 583–590 (2005). [DOI] [PMC free article] [PubMed] [Google Scholar]
- Chen L., Shaw C. C., Altunbas M. C., Lai C.-J., Liu X., Han T., and Wang T., “Feasibility of volume-of-interest (VOI) scanning technique in cone beam breast CT—A preliminary study,” Med. Phys. 10.1118/1.2948397 35, 3482–3490 (2008). [DOI] [PMC free article] [PubMed] [Google Scholar]
- Letourneau D., Wong J. W., Oldham M., Gulam M., Watt L., Jaffray D. A., Siewerdsen J. H., and Martinez A. A., “Cone-beam CT guided radiation therapy: Technical implementation,” Radiother. Oncol. 10.1016/j.radonc.2005.03.001 75, 279–286 (2005). [DOI] [PubMed] [Google Scholar]
- Feldkamp L. A., Davis L. C., and Kress J. W., “Practical cone-beam algorithm,” J. Opt. Soc. Am. A 10.1364/JOSAA.1.000612 1, 612–619 (1984). [DOI] [Google Scholar]
- Cho S., Bian J., Pelizzari C. A., Chen C. T., He T. C., and Pan X., “Region-of-interest image reconstruction in circular cone-beam microCT,” Med. Phys. 10.1118/1.2804924 34, 4923–4933 (2007). [DOI] [PubMed] [Google Scholar]
- Pan X., Xia D., Zou Y., and Yu L., “A unified analysis of FBP-based algorithms in helical cone-beam and circular cone- and fan-beam scans,” Phys. Med. Biol. 10.1088/0031-9155/49/18/011 49, 4349–4369 (2004). [DOI] [PubMed] [Google Scholar]
- Yu L., Zou Y., Sidky E. Y., and Pan X., “Region of interest reconstruction from truncated data in circular cone-beam CT,” IEEE Trans. Med. Imaging 10.1109/TMI.2006.872329 25, 869–881 (2006). [DOI] [PubMed] [Google Scholar]
- Xia D., Yu L., Sidky E., Zou Y., Zuo N., and Pan X., “Noise properties of chord-image reconstruction,” IEEE Trans. Med. Imaging 26, 1328–1344 (2007). [DOI] [PubMed] [Google Scholar]
- Han X., Xia D., Sidky E. Y., and Pan X., “Noise properties of the discrete finite Hilbert transform [abstract]. In IEEE Nuclear Science Symposium and Medical Imaging Conference,” October 19–25 2008, Dresden, Germany: The Nuclear and Plasma Science Society of the Institute of Electrical and Electronic Engineers, M11-5.
- Cho S., Pearson E., Xia D., Han X., Pelizzari C., and Pan X., “A preliminary study of intensity-weighted ROI imaging in cone-beam CT,” Proc. SPIE 10.1117/12.772063 6913, 69132C (2008). [DOI] [Google Scholar]
- Siewerdsen J. H., Daly M. J., Bakhtiar B., Moseley D. J., Richard S., Keller H., and Jaffray D. A., “A simple, direct method for x-ray scatter estimation and correction in digital radiography and cone-beam CT,” Med. Phys. 10.1118/1.2148916 33, 187–197 (2006). [DOI] [PubMed] [Google Scholar]
- Moore C. J., Marchant T. E., and Amer A. M., “Cone beam CT with zonal filters for simultaneous dose reduction, improved target contrast and automated set-up in radiotherapy,” Phys. Med. Biol. 10.1088/0031-9155/51/9/005 51, 2191–2204 (2006). [DOI] [PubMed] [Google Scholar]
- Ohnesorge B., Flohr T., Schwarz K., Heiken J. P., and Bae K. T., “Efficient correction for ct image artifacts caused by objects extending outside the scan field of view,” Med. Phys. 10.1118/1.598855 27, 39–46 (2000). [DOI] [PubMed] [Google Scholar]
- Zou Y., Pan X., Xia D., and Wang G., “PI-line-based image reconstruction in helical cone-beam computed tomography with a variable pitch,” Med. Phys. 10.1118/1.1902530 32, 2639–2648 (2005). [DOI] [PubMed] [Google Scholar]
- Yoo S. and Yin F., “Dosimetric feasibility of cone-beam CT-based treatment planning compared to CT-based treatment planning,” Int. J. Radiat. Oncol., Biol., Phys. 10.1016/j.ijrobp.2006.08.031 66, 1553–1561 (2006). [DOI] [PubMed] [Google Scholar]
- Sijbers J. and Postnov A., “Reduction of ring artefacts in high resolution micro-CT reconstructions,” Phys. Med. Biol. 10.1088/0031-9155/49/14/N06 49, N247–N253 (2004). [DOI] [PubMed] [Google Scholar]
- Ding G. X., Duggan M., and Coffrey C. W., “Characteristics of kilovoltage x-ray beams used for cone-beam computed tomography in radiation therapy,” Phys. Med. Biol. 10.1088/0031-9155/52/6/004 52, 1595–1615 (2007). [DOI] [PubMed] [Google Scholar]


