Abstract
The effects of water on electron capture dissociation products, molecular survival, and recombination energy are investigated for diprotonated Lys-Tyr-Lys solvated by between zero and 25 water molecules. For peptide ions with between 12 and 25 water molecules attached, electron capture results in a narrow distribution of product ions corresponding to primarily the loss of 10-12 water molecules from the reduced precursor. From these data, the recombination energy (RE) is determined to be equal to the energy that is lost by evaporating on average 10.7 water molecules, or 4.3 eV. Because water stabilizes ions, this value is a lower limit to the RE of the unsolvated ion, but it indicates that the majority of the available RE is deposited into internal modes of the peptide ion. Plotting the fragment ion abundances for ions formed from precursors with fewer than 11 water molecules as a function of hydration extent results in an energy resolved breakdown curve from which the appearance energies of the b2+, y2+, z2+•, c2+, and (KYK + H)+ fragment ions formed from this peptide ion can be obtained; these values are 78, 88, 42, 11, and 9 kcal/mol, respectively. The propensity for H atom loss and ammonia loss from the precursor changes dramatically with the extent of hydration, and this change in reactivity can be directly attributed to a “caging” effect by the water molecules. These are the first experimental measurements of the RE and appearance energies of fragment ions due to electron capture dissociation of a multiply charged peptide. This novel ion nanocalorimetry technique can be applied more generally to other exothermic reactions that are not readily accessible to investigation by more conventional thermochemical methods.
Introduction
Upon capture of an electron, gaseous multiply charged peptides or proteins can dissociate via many different pathways, producing a rich fragmentation spectrum from which extensive sequence information and locations of posttranslational modifications can be determined. The captured electron can be originally free (ECD)1-4 or can be transferred by collisions with atoms (ECID)5,6 or anions (ETD).7,8 These three methods produce similar fragments from multiply charged peptides and proteins and have found application in “top-down” proteomics where an entire protein or a substantial fraction of a protein is directly sequenced by tandem mass spectrometry.4
Many other mass spectrometry based sequencing methods activate protonated peptides or proteins by collisions either with gases, surfaces, or photons, and typically cleave amide backbone bonds to form “b” and “y” type ions.9 In contrast, electron capture (EC) based methods typically cleave N-Cα backbone bonds to form “c” and “z” type ions,2 although “b” and “y” type ions can be produced as well.10,11 The mechanisms for b and y type ions formed by activating protonated peptides and proteins have been extensively studied using a wide variety of different methods, including thermochemical12-14 and spectroscopic methods,15,16 and are thought to be relatively well understood.9,17-20 In contrast, mechanisms for formation of “c” and “z” type ions by ECD have been more controversial and are still the subject of heated debate.1-3,21-32 Among the proposed mechanisms are capture of the electron by a protonated nitrogen followed by hydrogen-atom transfer to a nearby carbonyl oxygen and subsequent nonergodic cleavage;22 capture of the electron at an amide group and abstraction by the resulting amide “superbase” of H+ from a nearby protonated moiety, followed by facile N-Cα cleavage;26 and a “radical cascade” mechanism in which electron capture at a protonation site leads to initial H-atom transfer, which is followed by iterative loss of neutral fragments.3 ECD spectra can change with initial ion temperature, suggesting that ion conformation can influence the observed products,33,34 consistent with recent results which showed that ECD spectra of different ubiquitin conformers with the same charge state, separated by differential ion mobility, differ.35
One of the most important factors that affect observed ion fragmentation is the energy deposited by a particular ion activation technique. It has been estimated that the recombination energy (RE) when a free electron combines with a multiply protonated peptide or protein is roughly 4-7 eV.1,2,36 Some or all of this energy may be deposited into internal modes of the peptide or protein ion to form the resulting fragment ions. An important advantage of ECD is that large proteins can be fragmented even though the RE is relatively small compared to the thermal energy of a large protein at room temperature. This phenomenon has been attributed to nonergodic dissociation in which the RE is localized and contributes to bond cleavage before energy randomization occurs.1,22 It has also been attributed to very low activation barriers for formation of product ions from the reduced precursor so that statistical dissociation is prompt even at room temperature.27 Data from many experiments and quantum chemical calculations have been obtained that support one or the other mechanism.1-3,21-30
A significant obstacle to better understanding how ions are formed in ECD is the difficulty in obtaining thermochemical information about these reactions. Experimental methods, such as blackbody infrared radiative dissociation (BIRD),12-14 high-pressure drift cell experiments,37 energy resolved surface induced dissociation,38,39 or guided ion beam mass spectrometry,40,41 have been used to measure activation energies for biomolecule dissociation reactions that are endothermic and have provided important information about the mechanisms by which many endothermic reactions occur. However, these methods cannot be applied directly to exothermic reactions, such as ECD. Some dissociation experiments on intact reduced precursors have been performed,22,42,43 but no thermochemical information has been obtained. An alternative approach to investigating ion thermochemistry is to use quantum chemical calculations, which have been done on small model systems and provide useful insights into ECD dissociation.21,23-29 However, high-level quantum chemical calculations have not been applied to multiply protonated peptides or proteins investigated by experimental methods owing to the large size of these molecules.
Recent ion nanocalorimetry experiments have been used to measure the RE when an aqueous nanodrop containing a metal ion is reduced by a thermally generated electron in the gas phase.44-48 In brief, when an electron is captured by a charged nanodrop, the RE can be deposited into internal modes of the nanodrop resulting in the evaporation of water molecules. The value of the RE can be obtained from the sum of the threshold dissociation energies for the maximum number of water molecules that are lost from the cluster. A more accurate measure can be obtained from the average number of water molecules lost combined with estimates of the translational, rotational, and vibrational energy partitioned into the evaporated water molecules.46 This method has recently been used to measure absolute reduction energies of gaseous nanodrops that contain different redox active species.46,47 These measured values can be related to bulk solution to obtain absolute reduction potentials. By comparing these absolute reduction potentials obtained from gas-phase measurements to relative electrochemical potentials measured in aqueous solution, an absolute potential for the standard hydrogen electrode of 4.2 ± 0.4 V was obtained.46
Here, this nanocalorimetry approach is used to obtain thermochemical information, including appearance energies and relative entropies for fragment ions formed by ECD of the diprotonated peptide Lys-Tyr-Lys (KYK) and of this ion with up to 25 water molecules attached. These experiments provide the first experimental measure of the RE for electron capture by a diprotonated peptide and also provide a novel route to establishing appearance energies of different fragments, including b, y, c, and z type ions, as well as loss of an H atom from this peptide, despite the fact that EC by the unsolvated peptide ion is exothermic. Finally, the reactivity of the peptide is influenced by the water molecules through a “caging” effect, which increases survival of the intact molecule and significantly reduces H-atom loss, but makes loss of an ammonia molecule a competitive process.
Experimental Section
ECD experiments are performed using a 2.75 T FT/ICR mass spectrometer equipped with a nanoelectrospray ion source and a temperature-controlled ion cell. This instrument is described in detail elsewhere.48-50 A copper jacket that can be cooled using a regulated flow of liquid nitrogen surrounds the ion cell and is equilibrated to a temperature of -140.0 °C for at least 8 h prior to experiments. Ions are generated by nanoelectrospray using borosilicate capillaries that are pulled to ~1 μm inner diameter at the tip and filled with a 10 μM aqueous solution of Lys-Tyr-Lys (99%, Sigma Chemical Co., St. Louis, MO), into which a platinum electrode is inserted. Ions are accumulated for 3-10 s in the ion cell during which time nitrogen gas is pulsed into the vacuum chamber to a pressure of ~10-6 Torr to enhance trapping and thermalization of the ions. Trapping plate potentials are 9.2 and 10.0 V (source side and far side, respectively) and are lowered to 2.0 V for ion excitation and detection. These trapping conditions were found to maximize total ion abundance following ECD in this instrument.48 The trapped ions are allowed to thermalize during a 5 to 12 s period, during which time the ion cell pressure returns to <5 × 10⁻⁹ Torr. Ions of interest are isolated using stored waveform inverse Fourier transform (SWIFT) techniques.
Electrons are thermally generated using a 1.0 cm diameter barium-scandate impregnated cathode (HeatWave Laboratories, Watsonville, CA) mounted axially 20 cm away from the cell center. The cathode is heated to a temperature of ~950 °C using a 3 A direct current. Following a 50 ms delay after ion isolation, electrons are introduced into the cell by pulsing the cathode housing potential from +10.0 to -1.5 V for 120 ms. In BIRD experiments, the cathode housing potential was maintained at +10.0 V to prevent electrons from entering the cell. In all experiments, a potential of +9.0 V was applied to a copper wire mesh mounted 0.5 cm in front of the cathode. All potentials are referenced to instrumental ground. For both ECD and BIRD experiments, a 500 μs delay precedes ion excitation and detection.
Sustained off-resonance irradiation collisionally activated dissociation (SORI-CAD) experiments are performed using a 9.4 T FT/ICR mass spectrometer with a nanoelectrospray ion source.51 Singly protonated KYK is generated directly by nanoelectrospray as described above. Ions are accumulated in a hexapole trap for 0.5 s, injected into the ion cell, where trapping is enhanced by pulsing in nitrogen gas for 0.2 s. (KYK + H)+ is then isolated using SWIFT techniques and excited using a single frequency waveform (4.0 V peak-to-peak, -1500 to -1700 Hz offset, 0.1 s duration), which results in maximum laboratory-frame translational energies of 2.1-2.7 eV. Nitrogen gas is pulsed into the cell during the excitation and is followed by a 2.7 s delay before ion excitation and detection.
Ion abundances were obtained by subtracting the average noise in a ~30 m/z signal-free region near the precursor. In ECD experiments, the average number of water molecules lost from the reduced precursor was calculated as the weighted average of reduced product cluster abundances (including abundances of the reduced precursor that has lost both small neutral species and water molecules). A correction for background dissociation due to BIRD resulting from radiative emission from the surrounding copper jacket and from the heated cathode was estimated as the water loss observed from the precursor ion when no electrons are introduced into the cell;45 this correction (~0.1 water molecules) was subtracted from the average water molecule loss.
Molecular mechanics was used to identify candidate low-energy structures of (KYK + 2H)2+, (KYK + 2H)(H 2O)102+, and (KYK + 2H)(H2O)252+ using conformational searching with MacroModel 8.1 (Schrödinger, Inc., Portland, OR). Two separate 10 000-conformer Monte Carlo searches were performed for each ion with either the MMFFs or OPLS force field using unconstrained geometries. Calculations with each force field resulted in at least 1000 structures within 50 kJ/mol of the lowest-energy structure.
Results and Discussion
Formation of Hydrated Ions
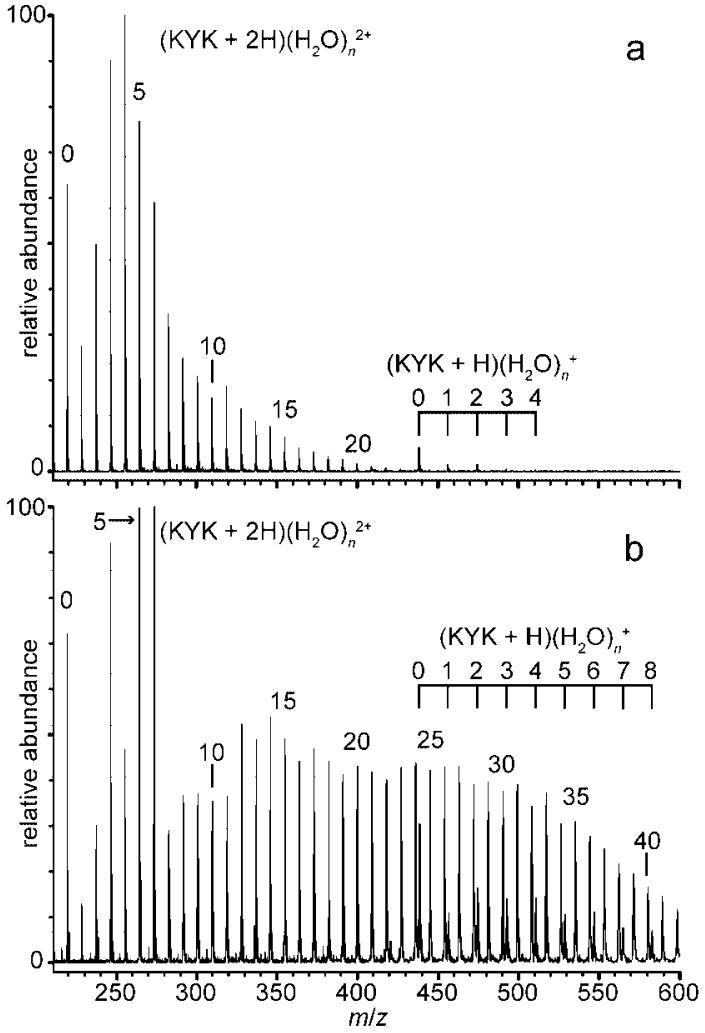
With electrospray ionization, hydrated ions can be formed by evaporation of water molecules from even more extensively hydrated ions or by condensation of water molecules onto bare or minimally solvated ions in the supersonic expansion that takes place in the ESI interface.52 A typical electrospray mass spectrum of KYK formed from aqueous solution and introduced into the mass spectrometer under conditions where the peptide ion should remain hydrated49 is shown in Figure 1a. The distribution of solvated ions, (KYK + 2H)(H2O)n 2+ depends on a number of experimental parameters, including the temperature of the heated metal inlet capillary and voltages applied to the skimmers and lens elements in the ESI interface. The distribution of ions can be shifted to lower or higher hydration extents by changing these parameters (Figure 1b). Because the ions are stored for 5 to 12 s prior to ion isolation and subsequent ECD experiments, the precursor ions should achieve a steady state internal energy distribution determined by the temperature of the copper jacket that surrounds the ion cell. This process occurs both by radiative absorption and emission, as well as by evaporative cooling in the cell.50,53,54
Figure 1.
Electrospray ionization mass spectra of KYK from aqueous solution showing hydrated ions of the doubly protonated peptide, (KYK + 2H)(H2O)n 2+, and a minor distribution of the singly protonated peptide, (KYK + H)(H2O)n +, with the temperature of the copper block that surrounds the interface capillary at (a) ~95 °C and (b) ~80 °C.
Fragmentation Pathways
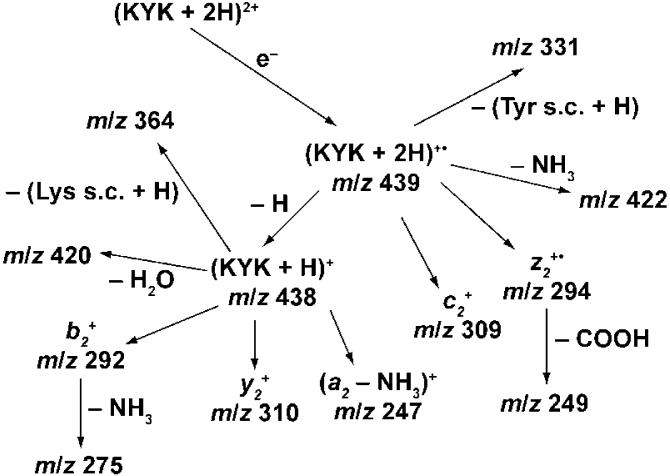
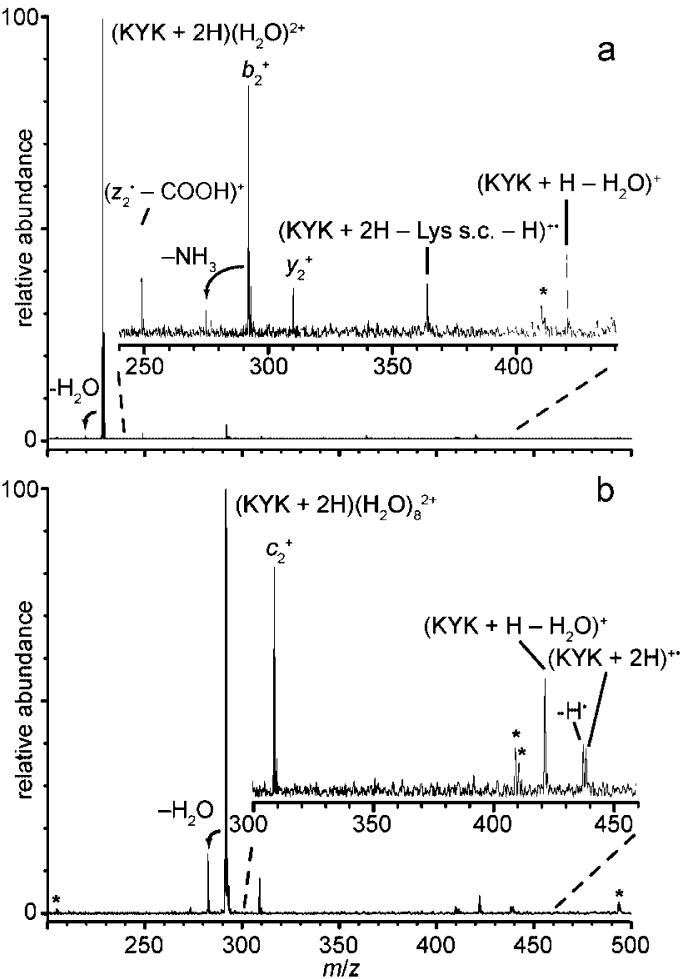
Many different ions are formed upon ECD of hydrated (KYK + 2H)2+, and fragment ion identities are assigned based on known peptide fragmentation pathways and logical neutral loss pathways. The observed dissociation pathways are summarized in Scheme 1. In detail, for the diprotonated molecular ion of KYK, ECD results in formation of b2+ with a 65% abundance normalized to the total ECD product ion abundance, (b2 - NH3)+ 3)+ (7%), (a2 - NH3)+ (10%), y2 + (8%), and (z 2• - COOH)+ (11%). The abundances of these ions decrease with increasing precursor hydration, and new ions appear (Figure 2, data for n = 1 and 8 shown). For example, ECD of (KYK + 2H)(H2O)4 2+ results in formation of (KYK + 2H)+• (m/z 439, 2%), (KYK + 2H - NH3)+• (2%), (KYK + H)+ (21%), (KYK + H - H2O)+ (3%), (KYK + 2H - tyrosine side chain - H)+• (m/z 331, 9%), c2 + (52%), and z2 +• (8%), and (z2 • - COOH)+ (3%). No hydrated species are observed upon EC of precursor ions with fewer than 10 water molecules attached, indicating that all water molecules are lost either from the reduced precursor itself or from the product ions. Loss of water from the reduced precursor should occur with a negligible reverse activation barrier and should occur via a “loose” transition state, making it an entropically favored process.
Scheme 1.
Fragmentation Pathways for (KYK + 2H)2+ upon Electron Capture
Figure 2.
Representative electron capture dissociation mass spectra for (a) (KYK + 2H)(H2O)2+ and (b) (KYK + 2H)(H2O) 2+ Insets are ×20 and ×6 expansions of the spectral regions indicated in a) and b), respectively; asterisks (*) indicate noise peaks.
The change in fragmentation behavior with increasing hydration can be largely attributed to a smaller fraction of the RE that is available for forming peptide fragment ions due to the energy necessary to evaporate the water molecules, i.e., energy that goes into evaporating water molecules from the reduced precursor ion is not available to form fragment ions that have significant activation barriers. With increasing hydration, the RE upon EC should decrease owing to increased charge solvation. These combined effects result in decreased internal energy available to fragment the reduced precursor as the extent of hydration increases. Changes in structure induced by hydration may also contribute to the changing fragmentation, including solvent “caging” effects,55 which appear to be significant for the larger clusters and influence the fragmentation (vide infra).
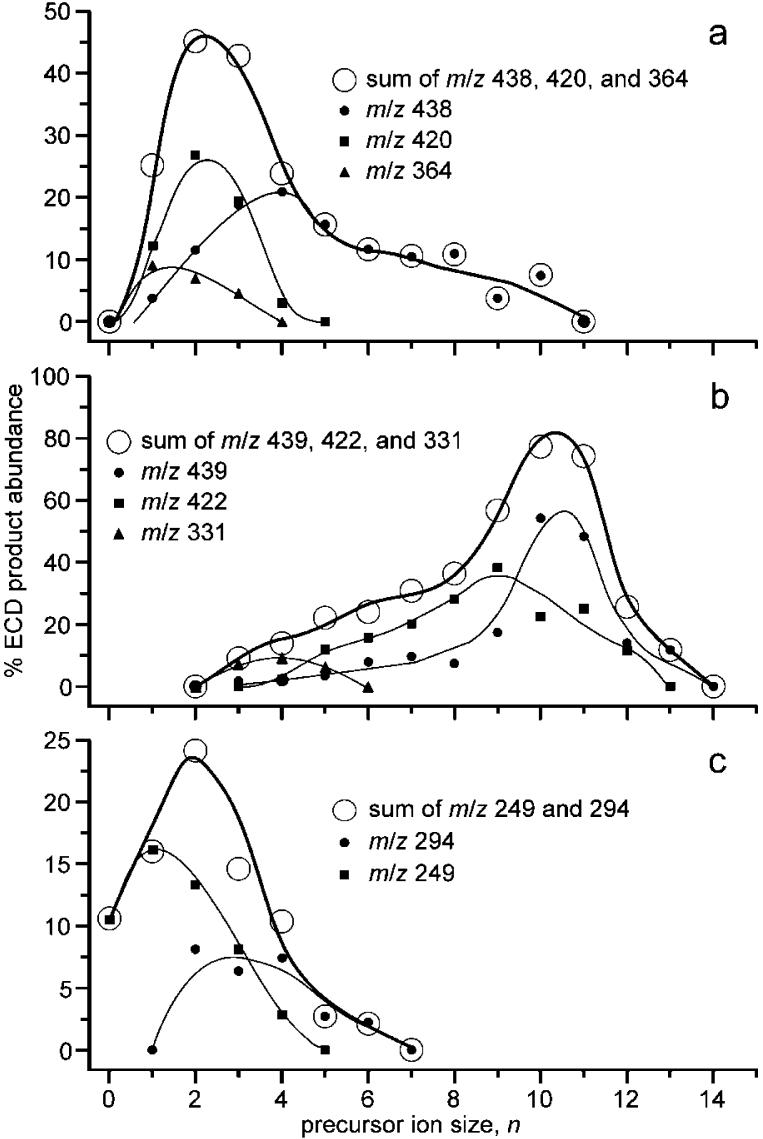
Fragment ions resulting from the EC process can be formed directly from the reduced precursor or by one or more consecutive reactions. Whether some ions formed by EC of (KYK + 2H)2+ occur from consecutive dissociation can be established from the abundances of these ions as a function of hydration extent (Figure 3). For example, the abundances of the m/z 438, 420, and 364 ions as a function of n are shown in Figure 3a. The abundances of the m/z 420 and 364 ions are larger at small n but decrease with a concomitant increase in the abundance of the m/z 438 ion. This suggests that the m/z 420 and 364 ions are formed from the m/z 438 ion, consistent with assignment of these three ions as (KYK + H - H2O)+ (KYK + H - lysine side chain - H)+, and (KYK + H)+, respectively. Products of subsequent dissociation of (KYK + H)+ are preferentially formed at lower n, corresponding to higher internal energies. Similar results are obtained for the m/z 439, 422, and 331 ions, and these ions are assigned as (KYK + 2H)+•, (KYK + 2H - NH3) +•, and (KYK + 2H - tyrosine side chain - H)+•, respectively (Figure 3b), although the possibility that the m/z 331 ion comes from (KYK + H)+ cannot be completely ruled out from this analysis. However, collisional dissociation of (KYK + H)+ (vide infra) does not result in the formation of m/z 331 ions, strongly suggesting that it is formed instead from (KYK + 2H)+•. The m/z 249 ion appears at lower n than the m/z 294 ion, consistent with loss of COOH from z2 +• (Figure 3c). From similar analysis of each fragment ion, the ECD reaction pathways (Scheme 1) are established for (KYK + 2H)2+.
Figure 3.
Fragment abundances for major ECD product ions of (KYK + 2H)(H2O) n 2+ and suspect fragment ions formed by consecutive reactions of these ions, plotted as a function of n.
Energy Resolved Primary Fragmentation
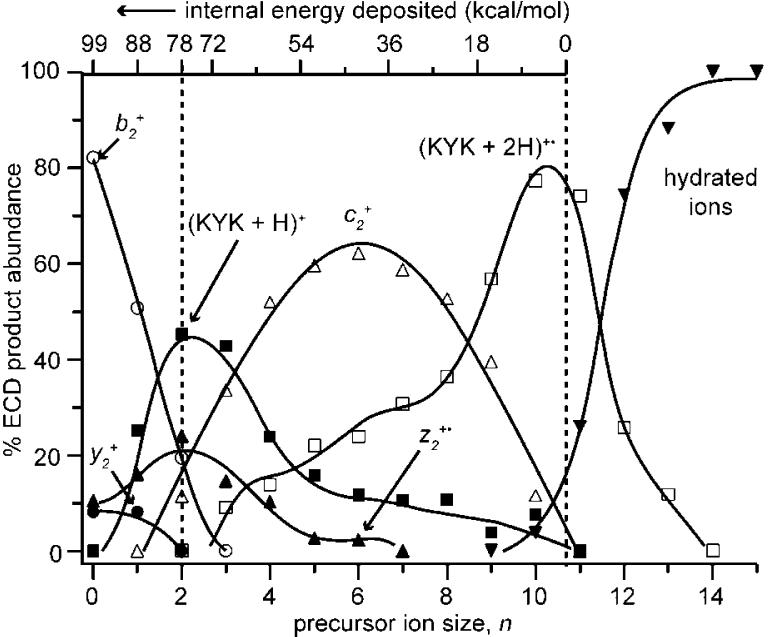
The abundances of fragment ions produced by EC of (KYK + 2H)(H2O)n 2+ 2 n normalized to total ECD product ion signal as a function of n are shown in Figure 4. In this Figure, the abundances of product ions formed by consecutive dissociation (Scheme 1) are added to the abundance of the respective intermediate fragment to make more clear the primary reaction pathways originating either from the intact reduced precursor, (KYK + 2H)+•,or the reduced precursor that has lost an H atom, (KYK + H)+.56 These data show clear trends in the appearance and disappearance of fragment ions with increasing cluster size. Both b2 + and y2 + decrease with a concomitant increase in (KYK + H)+ with increasing n. The (KYK + H)+ ion reaches a maximum around n = 2 or 3 but is not observed at n ≥ 11. The abundance of z2 +• initially increases and then decreases with increasing n, reaching a maximum at n = 2, and it is not observed at n ≥ 7. The c2 + ion is observed between n = 2 and 10, reaching a maximum in relative intensity around n = 6. Note that the high normalized abundance of the c2 + ion over this region contributes to the asymmetry of the (KYK + H)+, z2 +•, and (KYK + 2H)+• normalized abundance curves. The trend in ion formation as a function of hydration extent can be directly related to formation energies; ions formed at lower n have higher barriers to formation than those preferentially formed at higher n.
Figure 4.
Normalized abundances of dissociation products from intact reduced (KYK + 2H)(H2O)n 2+ and reduced ions that have lost a hydrogen atom, plotted as a function of n. Each curve is the sum of the indicated major product ion and its subsequent neutral losses (Scheme 1). The internal energy deposition scale, determined from the number of water molecules lost in ECD of these ions (see text), is used to establish an energy resolved breakdown curve for fragment ion formation; note that this scale is nonlinear above 78 kcal/mol.
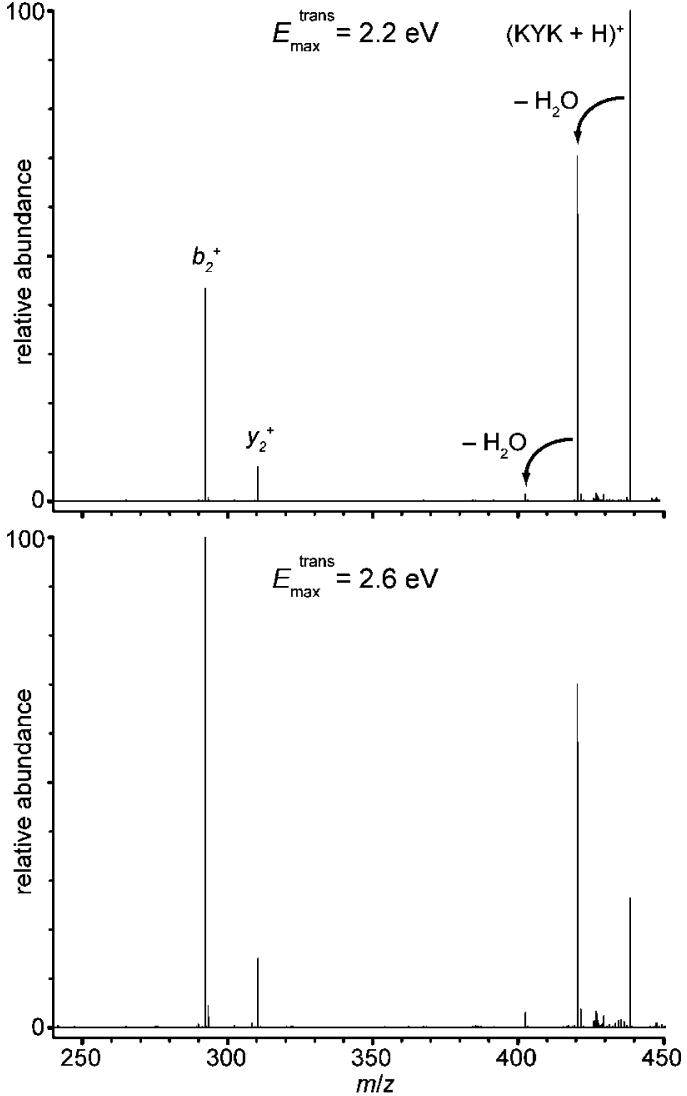
A b type ion can be readily formed from activated (KYK + H)+, but it could also potentially be formed by subsequent dissociation of a corresponding c ion by loss of NH3. However, the decrease in b2 + abundance before significant increase in c2 + abundance with increasing n indicates that b2 + is not formed by dissociation of c2 +. To provide additional evidence that the b2 + is formed by dissociation of (KYK + H)+, singly protonated molecular ions were formed directly by ESI and dissociated using SORI-CAD at two different maximum collision energies (Figure 5). The ratio of b2 + and y2 formed by SORI-CAD is comparable at both energies and is similar to that observed in our ECD experiments of (KYK + 2H)2+ and this ion with one water molecule. However, the abundances of these ions increase relative to that of (KYK + H - H2O)+ with increasing collision energies, indicating that the b2 + and y2 + ions have higher formation energies but their formation is entropically favored over loss of a water molecule. These results are entirely consistent with the ECD experiments where water molecule loss from the (KYK + H)+ occurs preferentially over b2 + and y2+ formation at higher n, corresponding to lower internal energies (see Figures 3 and 4).
Figure 5.
SORI-CAD spectra of (KYK + H)+ formed directly by nanoelectrospray ionization with two different excitation conditions corresponding to maximum translational energies in the laboratory frame, Emax trans, of 2.2 (top) and 2.6 eV (bottom).
Recombination Energy
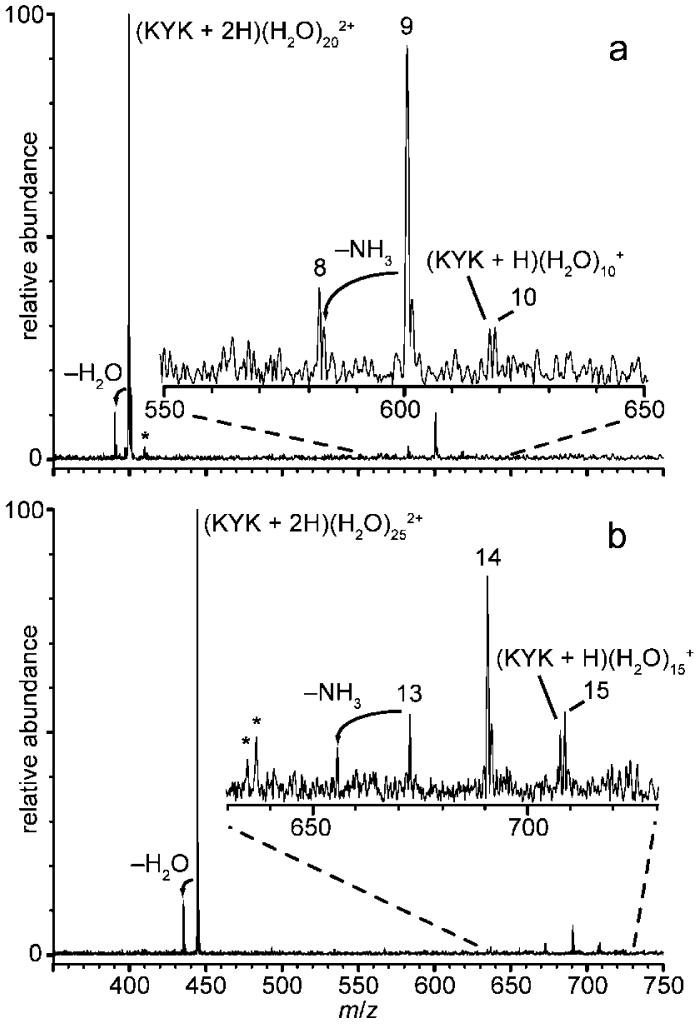
A measure of the internal energy deposited into a hydrated ion can be obtained from the number of water molecules lost from the reduced precursor ion.44-48 Water molecule retention by b, y, c, or z type fragment ions (or any of their subsequent dissociation products) is not observed for any of the precursors in this study, and no fragment ions with water molecules attached are observed for n < 10. However, one or more water molecules are retained by the reduced precursor or reduced precursor that has lost a hydrogen atom for n ≥ 10. The distribution of hydrated ions is quite narrow. For example, product ions resulting from EC of (KYK + 2H)(H2O)n2+, n = 20 and 25, are shown in Figure 6a and b, respectively. Predominantly loss of 10, 11, and 12 water molecules occurs from these reduced precursors. The width of this product ion distribution can be attributed to partitioning of the recombination energy resulting from electron capture into rotational and translational energy of the departing water molecules, as observed in previous ion nanocalorimetry studies.46 Minor product ions corresponding to both hydrogen atom and ammonia loss, both accompanied by water loss, are observed. These minor dissociation channels can be attributed to a water caging effect and will be discussed in more detail subsequently. The weighted average of the number of water molecules determined from the abundances of these product ions is 10.9 and 10.8 for n = 20 and 25, respectively.
Figure 6.
ECD spectra of (a) (KYK + 2H)(H2O) 202+and (b) (KYK + 2H)(H2O)252+. Numbers, n, above ECD product ion peaks indicate major products (KYK + 2H)(H2O)n+•. Insets are ×7 expansions of the relative abundances of the spectral regions indicated; asterisks (*) indicate noise peaks.
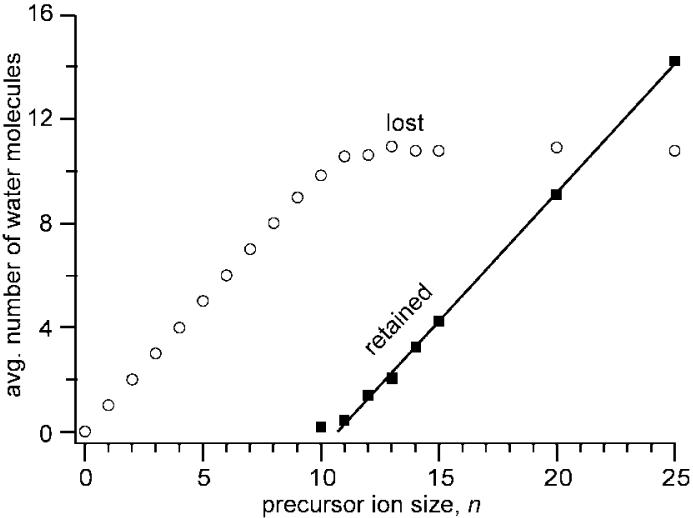
From the distribution of ions that retain one or more water molecules, the average number of water molecules lost from the reduce precursor or the average number of water molecules retained by the reduced precursor can be obtained as a function of n. The abundances of hydrated precursor ions that have lost NH3 or H are included in this analysis. These data are shown in Figure 7. For n = 10, the combined abundance of the solvated ions is only 4% of the total ECD product ion signal, whereas solvated ions are 74% of the overall ECD product ion signal for n = 12, and only hydrated ions are observed for n ≥ 14. The average number of lost water molecules increases with n and reaches a plateau of ~10.8 for n ≥ 12 (Figure 7). The average number of water molecules retained by the reduced precursor (including reduced precursor that has lost NH3 or H) is zero for n < 10 but increases linearly with size for n ≥ ~11. Fitting these data to a straight line (R2 = 0.999) results in an x-intercept value of 10.7, consistent with the observed plateau in the average number of water molecules lost upon EC (10.8). This value of 10.7 corresponds to the cluster size at which the energy of evaporative cooling of an equivalent number of water molecules is equal to the RE that is deposited into these ions.
Figure 7.
Average number of water molecule lost (○) and retained (■) upon ECD of (KYK + 2H)(H2 O)n2+, plotted as a function of n. The line represents a least-squares fit to the water molecule retention data for n ≥ 11.
Recent experiments done on this instrument indicate that the internal energy deposited into hydrated ions upon EC depends on neither the cathode voltage nor electron irradiation time under the conditions used in these experiments, although some ion activation as a result of inelastic ion-electron collisions does occur at longer irradiation times.48 Ion excitation can occur with higher energy electrons or in some instruments employing multipass setups.57-59 BIRD also occurs in these experiments as a result of radiative emission from the surrounding copper jacket and from the heated cathode, but the results are corrected for this effect using data obtained when electrons are not introduced into the cell. EC is most efficient when the relative velocity between an ion and an electron is zero. For example, the EC cross section for D+(D2O)2 increases by about 3 orders of magnitude when the ion-electron center-of-mass-frame kinetic energy decreases from 0.01 to 0.001 eV.60 The spread of electron velocities in these nanocalorimetry experiments is broad, owing both to effects of varying electrostatic potentials inside the cell and to electron-electron repulsion resulting from the high electron currents used in these experiments. In addition, inelastic ion-electron collisions that do not result in electron capture can result in lower electron kinetic energies. These factors could result in a small fraction of electrons with near-zero kinetic energy inside the ion cell, and these electrons should be the ones most efficiently captured in these experiments.
To obtain an estimate of the internal energy deposition from the number of water molecules lost from the reduced precursor ions, the threshold dissociation energies for loss of each water molecule must be known. These values have not been measured, but estimates of these values can be obtained from water binding enthalpy measurements for similar small protonated peptides. For example, Bowers and co-workers have measured the individual water binding enthalpies of up to four water molecules to different protonated peptides and analogous molecules.61,62 They found that these values are lower when the protonation site is involved in intramolecular hydrogen bonding,61,62 as should be the case for the reduced precursor in this study. From these measurements, we estimate that the water binding energies to the singly charged reduced precursor in our experiments are roughly 9.5 and 8.5 kcal/mol for the first and second water molecule, and 7.5 kcal/mol for all additional water molecules. By comparison, the binding energy of a water molecule to a neutral water cluster is calculated to be 7.5-8.2 kcal/mol for n = 10-25 using a discrete implementation of the Thomson liquid drop model for an uncharged cluster.63 The threshold dissociation energies are lower than the binding enthalpies, but some energy also partitions into translational and rotational modes of the evaporating water molecules.46 In sum, we estimate that the energy removed from the reduced precursor by an evaporating water molecule is ~1.5 kcal/mol higher than the binding energies in these experiments based on calculations for similar size hydrated metal ion clusters,46 that is, the energy removed is approximately 11 kcal/mol for the last water molecule, 10 kcal/mol for the second to last, and 9 kcal/mol for each additional water molecule. Sequential loss of individual water molecules is entropically favored over loss of water clusters, although we cannot eliminate the possibility that the latter occurs. However, both the narrow hydrated product ion distribution and the excellent agreement between results from nano-calorimetry experiments with redox active species and reduction potentials in solution46 indicate that water loss occurs sequentially.
Using these binding energies combined with estimates of energy partitioning, the RE determined from the equivalent of 10.7 water molecules is 11 + 10 + 9 × 8.7 ≈ 99 kcal/mol (4.3 eV). Because solvent and molecular reorganization occur on a time scale much faster than these experiments, the measured RE reflects the reorganization energy and is an adiabatic value.46,47 This value is within the range of values between 4 and 7 eV that have been estimated previously,1,2,36 but this value has neither been measured nor calculated for multiply protonated peptides or proteins. The RE obtained from these measurements is for hydrated precursor ions with between 10 and 25 water molecules and is remarkably constant over this range in cluster size, indicating that significant charge solvation occurs for even smaller clusters. The RE is expected to be somewhat larger for precursor ions with fewer water molecules owing to the effects of charge solvation by the water molecules, so the value of 4.3 eV represents a lower limit to the RE of the unsolvated precursor. These results do show that the vast majority of the RE is deposited into internal modes of the reduced precursor, consistent with EC results obtained from extensively hydrated calcium dications.45
The RE of the diprotonated peptide is equal to the ionization energy of a hydrogen atom plus the hydrogen atom affinity of the singly protonated peptide, less the proton affinity of the singly protonated peptide. The protonation sites and the surrounding molecular environments in the diprotonated peptide differ, and these two protonation sites may be expected to have slightly different intrinsic proton affinities. The distribution of hydrated ions with n ≥ 12 resulting from EC indicates that the energy deposition is very narrow, and the width of this distribution can be largely accounted for by the distribution of kinetic and rotational energy of the evaporating water molecules, indicating a single RE value despite the presence of two different protonation sites. The presence of 12 or more water molecules on the diprotonated peptide reduces the intramolecular solvation of the charge compared to the unsolvated ion (vide infra) and may make both proton sites more equivalent.
Fragment Formation Energies and Entropies
Breakdown curves, in which fragment ion abundances are plotted as a function of a measure of internal energy deposition, e.g., center-of-mass collision energies in collisional activation experiments, are useful for determining information about activation energies for endothermic reactions.38,39,64 In contrast, EC reactions are exothermic by a value corresponding to the difference in the recombination energy and the stabilities of the products. Owing in part to the fact that the recombination energy is often greater than any activation barriers for product formation, no experimental measurements have been made on the barriers for ECD product ion formation for reduced peptides.
From the EC data of the unsolvated and hydrated precursor ions as a function of n, estimates of appearance energies (AE) and relative entropies for forming various ECD product ions can be obtained in an analogous manner to more conventional energy resolved experiments for endothermic reactions. The evaporation enthalpies for the loss of water molecules can be used to establish an energy scale. The “zero” on this scale corresponds to the cluster size where the energy required to evaporate all of the water molecules equals the recombination energy. This cluster size can be obtained by extrapolating the average number of water molecules lost from more highly solvated ions that retain water molecules to zero water retention. As described above, extrapolating these data for n ≥ 11 results in a value of 10.7 water molecules.
With a “zero” energy on the breakdown curve established for n = 10.7 (Figure 7), the internal energy of the reduced precursor increases with decreasing n, with the difference in internal energy determined by the energy taken away by evaporating each water molecule from the cluster. This energy scale, which is superimposed in Figure 4, makes it possible to establish an AE for forming each product ion. For example, c2 + is observed even at n = 10, for which cluster size some (KYK + 2H)(H2O) + is also observed. This places the appearance energy for forming c2 + as competitive with the energy required for evaporating this last water molecule from the reduced precursor. Because loss of a water molecule occurs with a “loose” transition state, it is entropically favored over rearrangement reactions. This establishes an approximate energy for formation of the c2 + ion as 11 kcal/mol (0.5 eV), the energy required to evaporate the last water molecule. An upper limit to the formation of this and other ions can be calculated using eq 1:
| (1) |
where ΣEw is the total energy removed by lost water molecules. This establishes an upper limit to the energy for formation of the c2 + ion of about (99 - [10 + 9 × 8]) = 17 kcal/mol (0.7 eV). Similarly, z2 +• ions are observed for n = 6 but not 7 placing the minimum energy required for formation of the z2 +• ion as comparable to the difference of the RE and the energy taken away by the loss of 6 water molecules, or (99 - [11 + 10 + 9 × 4]) = 42 kcal/mol (1.8 eV). The preferential formation of z2 +• ions over c2+ ions at higher internal energy despite its higher appearance energy indicates that formation of the z2 +• is entropically favored over formation of c2 +. Moreover, the fact that formation of these ions depends on available internal energy is consistent with these ions being formed by a statistical process. Quantum calculations for cleavage of the N-Cα backbone bond of a model reduced peptide, Nα-glycylglycine amide radical cation, indicate formation energies for competing c and z type ions of 16 and 29 kcal/mol, respectively.27 The agreement between these quantum chemical values and the measured appearance energies for formation of c2 + and z2 +• from KYK is very good, given the uncertainty in the measured values (±1 water molecule or ~9 kcal/mol) and likely structural effects due to the different ions investigated.
Formation of the b2 + ion appears 8 water molecules above the “zero” corresponding to an appearance energy of (99 - [11 + 10]) = 78 kcal/mol (3.4 eV), making it a significantly higher energy dissociation process than formation of either c2 + or z2 +•. This energy is higher than typical threshold dissociation energies to form many b ions from other protonated peptides and proteins.12-14,38,39 The abundance of y2 + tracks that of b2 + indicating its appearance energy is only slightly higher (88 kcal/mol), but its formation entropy is similar. In addition, the recombination energy of an unsolvated ion should be higher than that with 10 water molecules attached so this value should be a lower limit to the appearance energy. The high appearance energy may be due to significant stability of the intermediate (KYK + H)+ ion, the low initial internal energy of the cold ions in this experiment, or it could be that the H atom that is lost from the bare or minimally solvated reduced precursor carries away a significant amount of the available RE. The process for H-atom formation and temperature effects are currently under investigation. The energetic information deduced from these nanocalorimetry experiments for ECD of (KYK + 2H)(H2O)n 2+ is summarized in Figure 8.
Figure 8.
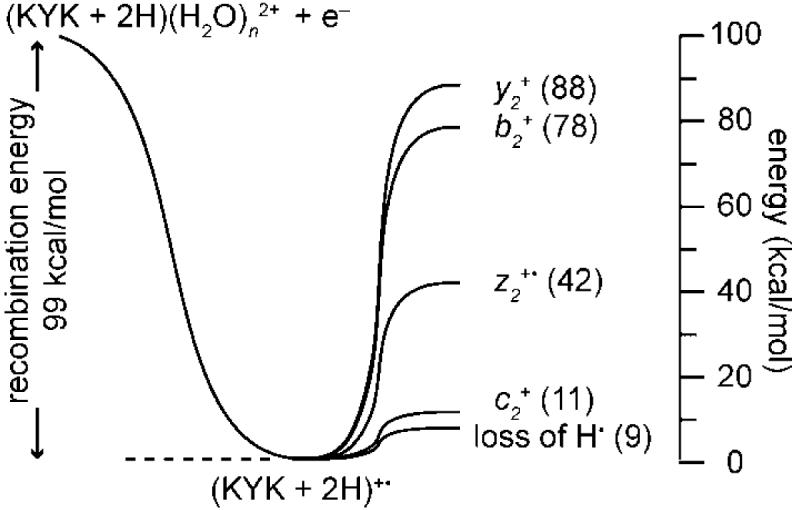
Thermochemistry for electron capture by (KYK + 2H)(H2O)n 2+ deduced from ion nanocalorimetry experiments, where the recombination energy is determined from the number of water molecules lost from the reduced precursor (see text). Appearance energies (kcal/mol) relative to the reduced precursor are indicated in parentheses.
Solvent Caging
Internal hydrogen bonding has been implicated in the formation of c and z ions in ECD spectra.1,30,33,65 Recent ECID results on small di- and tripeptides indicate that retention of the H atom by the reduced precursor ion increases with molecular size suggesting that intramolecular solvation plays a role in reducing H-atom loss, consistent with results for ions with methanol molecules attached that also result in increased abundance of the intact reduced precursor.55 No correlation between H-atom loss and formation of c or z ions was observed in the ECID experiments suggesting that ionic hydrogen bonding and charge solvation does not play a role in forming these ions.
To determine the extent to which the protonation sites in the unsolvated (KYK + 2H)2+ form intermolecular hydrogen bonds to other polarizable atoms, conformational searching using both the MMFFs and OPLS force fields was performed. Many low-energy structures were identified (at least 1000 within 50 kJ/mol of the lowest-energy structure for each ion) and a representative low-energy structure identified in this search is shown in Figure 9 (top). In almost all the low-energy structures found for the bare ion, the protonated amines each form one or more hydrogen bonds to polarizable atoms in the peptide, either the N-terminus (not protonated in these calculations, but similar binding motifs are possible if protonated), a carbonyl oxygen of the backbone, or the hydroxyl oxygen or phenyl ring of tyrosine. Of the 280 structures identified within 30 kJ/mol of the lowest-energy structure, only 7 exhibit a lysine side chain not involved in hydrogen bonding, and all 7 of these structures are at least 26 kJ/mol higher in energy than the lowest-energy structure. These results strongly indicate that both protonation sites in the diprotonated peptide participate in intramolecular hydrogen bonding at the temperature of the ECD experiments (-140 °C).
Figure 9.
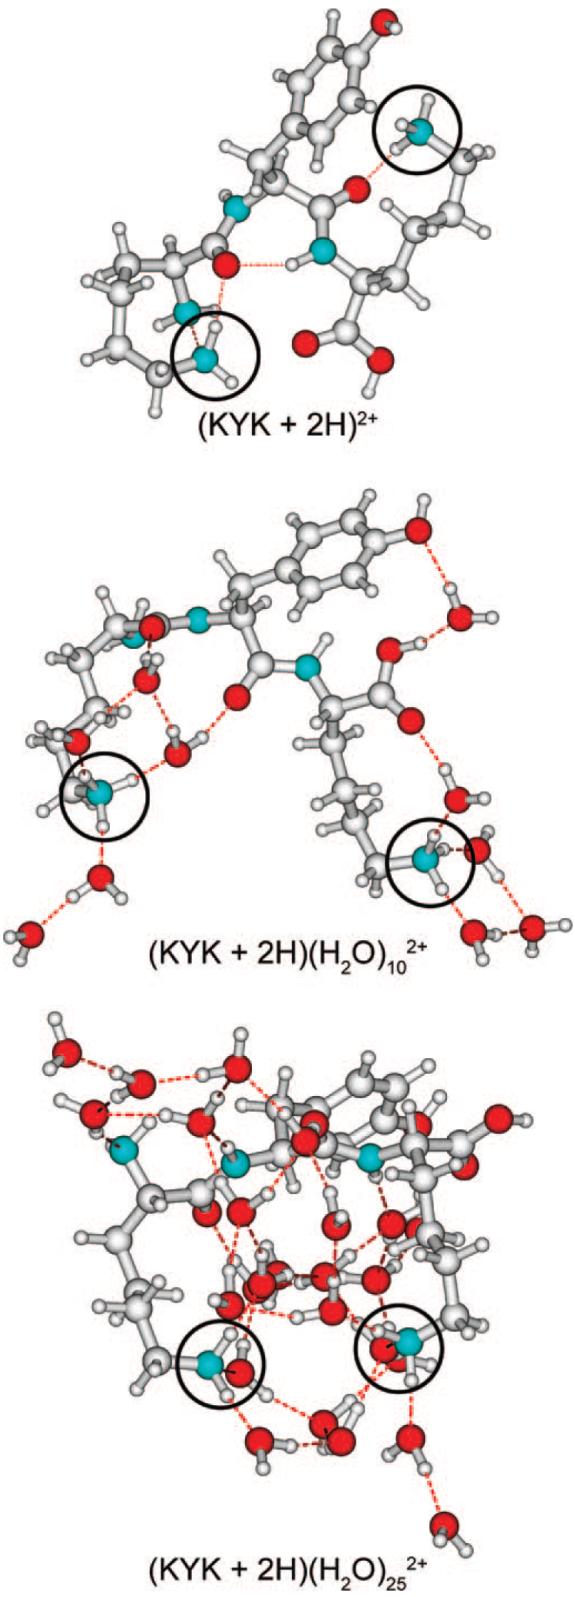
Representative low-energy structures of (KYK + 2H)2+, (KYK + 2H)(H2O)10 2+, and (KYK + 2H)(H2O)252+ obtained from 10 000 conformer Monte Carlo searches using the MMFFs force field (similar structures were identified using the OPLS force field), with the amino groups of both lysine sidechains protonated; these groups are circled for ease of identification.
Low-energy structures for the diprotonated peptide with 10 and 25 water molecules are shown in Figure 9 (middle and bottom, respectively). These structures are representative of the types of structures that may be present in this experiment and provide insights into how water organizes around this ion. In the structure with 10 water molecules, 6 water molecules attach directly to the protonated nitrogens, completely solvating both charge sites. The remaining 4 water molecules hydrogen bond to other water molecules or form hydrogen-bond networks to other heteroatoms in the peptide. With 25 water molecules, the charge sites are extensively solvated by the water molecules, which bridge the two charge sites and also form hydrogen bonds to the peptide. These results show that the attachment of water molecules can influence the structure of the diprotonated peptide by directly solvating the protonation sites and reducing intrinsic intramolecular solvation of these sites.
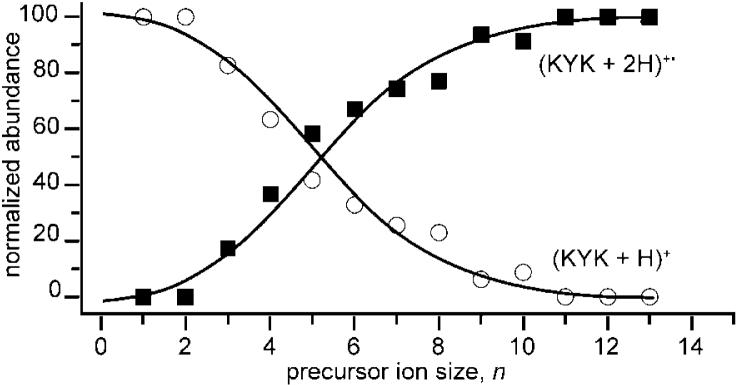
The normalized relative abundances of (KYK + 2H)+• and (KYK + H)+, corrected for the loss of NH3 and H2O and water retention by these respective ions, as a function of n are shown in Figure 10. Data for n = 0 are not shown because these ions do not survive. Formation of (KYK + H)+ is dominant at small n whereas formation of (KYK + 2H)+• is dominant at large n. A transition between formation of (KYK + H)+ and (KYK + 2H)+• occurs at n ≈ 5. At this cluster size, these two ions are formed with nearly equal abundance.
Figure 10.
Normalized abundances of (KYK + 2H)+• (including water retention) and (KYK + H)+ formed by EC of (KYK + 2H)(H2O)n2+ as a function precursor ion size, n. The abundances of ions formed by subsequent loss of ammonia from (KYK + 2H)+• or water from (KYK + H)+ have been included in the normalized abundance of their respective precursors.
The transition between loss of hydrogen from the reduced precursor to survival of the reduced precursor appears to correlate with the extent of hydrogen bonding of the protonation sites, that is, H-atom loss becomes increasingly unlikely when all of the H atoms at the protonation site are involved in hydrogen bonds. Loss of an H atom continues for clusters as large as n = 10, although a small amount of H-atom loss in competition with water loss is also observed for the much larger clusters. Upon EC of (KYK + 2H)(H2O)102+, nearly all water molecules are lost and the dominant ions are the intact reduced precursor and reduced precursor that has lost an ammonia molecule.
These results indicate that the water molecules effectively act as a “cage” that traps the H atom in the reduced precursor. The intact reduced precursor either survives, because the majority of the recombination energy goes into evaporating the water molecules, or it dissociates by loss of an ammonia molecule or a hydrogen atom, which for an unsolvated hypervalent ethylammonium radical is expected to occur with barriers of about 0.4 and 0.2 eV, respectively.66
There appears to be a relationship between retention of the hydrogen atom and c and z ion formation for (KYK + 2H)2+, based on their relative abundances as a function of hydration extent (Figure 4). Although some (z2• - COOH)+ is formed even at n = 0(~11%), both b2+ (~82%) and y2+ (~8%) are significantly more abundant and are almost certainly formed by excited (KYK + H)+, consistent with the SORI-CAD data of this same ion formed directly by ESI (Figure 5), and the breakdown curves (Figure 4). The small abundance of (z2• - COOH)+ can be attributed to dissociation of excited (KYK + 2H)+•. The increase in z2+• and subsequently c2+ with increasing n appears to be related to the decreased propensity for H-atom loss from the reduced precursor. These results strongly indicate that both z2+• and c2+2 require the retention of a hydrogen atom for their formation and that their abundance is directly related to the extent of hydrogen bonding or solvent caging that occurs in these ions. Changes to the peptide conformation or even zwitterion formation as a result of increasing hydration can occur, and these effects may also influence the fragment ions observed.
Effects of Hydration on Molecular Survival
It is clear from these data that water molecules can protect the reduced precursor from dissociating by removing a large portion of the recombination energy when these water molecules evaporate from the cluster. For clusters with n ≥ 10, some water molecules remain attached to the reduced precursor ions, and for n ≥ 14, all product ions are hydrated. For these larger hydrated precursor ions, the majority of the ion signal corresponds to (KYK + 2H)(H2O)n+•, but minor ions corresponding to these ions that have either lost an H atom or an ammonia molecule are also observed (Figure 6). Interestingly, these latter ions have slightly different distributions of water molecules attached. For example, EC of (KYK + 2H)(H2O)252+ results in loss of 10, 11, and 12 water molecules from the intact reduced precursor, corresponding to an average of 10.8 water molecules lost. An ion corresponding to (KYK + H)(H2O)15+ is also observed. The one less water molecule that is lost from this ion compared to the average number lost from the intact reduced precursor indicates that the energy required for the loss of an H atom from these clusters is about that required for the loss of a single water molecule, or roughly 9 kcal/mol (0.4 eV). Formation of (KYK + 2H - NH3)(H2O)13+• is more surprising because no (KYK + 2H - NH3)(H2O)14+• is observed (Figure 6). Because loss of NH3 should not be significantly exothermic, the accompanying net loss of 12 water molecules from the intact reduced precursor suggests that ammonia leaves with one or two water molecules attached, that is, a hydrated cluster of ammonia is lost.
The comparable abundance for the loss of ammonia and loss of an H atom from (KYK + 2H)(H2O)25+• indicates that these processes are competitive. Loss of an H atom is significantly favored for the unsolvated ion despite having only a slightly lower dissociation barrier than that for loss of ammonia. The competitive loss for the more highly solvated ions indicates that water molecules form an effective cage that significantly reduces direct H-atom loss. Because the CH2-NH3 bond is also very weak, cleavage of this bond is nearly as probable as cleavage of the CH2NH2-H bond in the solvated ion.
Conclusions
The recombination energy of an electron captured by a multiply protonated peptide ion can be determined using ion nanocalorimetry by measuring ECD spectra as a function of the number of water molecules in a hydrated peptide ion. For (KYK + 2H)(H2O)n2+, the RE is equal to the energy that is taken away by evaporating the equivalent of 10.7 water molecules from the reduced clusters, or about 4.3 eV. This value does not change significantly for hydrated ions with between 11 and 25 water molecules, indicating that the charge sites in the protonated dipeptide are significantly solvated in even smaller clusters, consistent with results from molecular mechanics calculations. Because water molecules should stabilize these gaseous ions, the RE value obtained from this experiment represents a lower limit to the RE of the unsolvated precursor. These results show that the majority of the available RE is deposited into internal modes of the peptide ion.
An important feature of these experiments is the ability to measure appearance energies and obtain information about relative entropies of fragment formation, even though these processes can be highly exothermic in ECD of the bare ion. Energy taken away by evaporating water molecules is not available for fragment ion formation, so that a breakdown curve of fragment ion abundance with an energy scale determined by the energy removed by each water molecule can be used to establish appearance energies. Information about dissociation pathways and relative entropies can then be deduced. Ion nanocalorimetry is a general method that could readily be applied to other exothermic processes that are inaccessible to direct investigation by more conventional thermochemical methods.
Water molecules influence the conformation of the peptide primarily by replacing intramolecular interactions at protonation sites with more favorable interactions with water molecules, which also form hydrogen bonding networks to polarizable atoms in the peptide. Water also acts as a “cage” that significantly reduces H-atom loss compared to the unsolvated peptide and makes loss of an ammonia molecule from highly solvated ions a competitive process. Hydrated ions will also have different electronic properties than the unsolvated ion, which can affect how electron capture and subsequent dissociation occur. By investigating other peptides and even proteins using this nanocalorimetry approach, thermochemical data can be obtained that may provide significant new insights into the role of sequence, hydration, and even conformation on the ECD fragmentation process. This may prove useful for improving automated algorithms aimed at extracting structural information from large databases of ECD spectra. The appearance energy for formation of c2+ from (KYK + 2H)+• (~11 kcal/mol) is ~88 kcal/mol less than the recombination energy. Thus, formation of this fragment ion should be prompt and likely occurs on a time scale substantially shorter than H/D scrambling, making ECD a potentially attractive method to elucidate protein conformations from solution-phase H/D exchange rates. Recent ECD results for a selectively labeled peptide suggest that the extent of scrambling can be minimal for small peptides.67 The role of electrons in DNA damage, which can occur as a result of ionizing radiation in vivo, could be investigated using this ion nanocalorimetry method, and information about how water molecules or other molecules may mitigate DNA damage could be obtained from such experiments.
Acknowledgment
This work is supported by the National Science Foundation (Grant CHE 0718790), the National Institutes of Health (Grant R01GM064712), and the European Project ITS LEIF (RII 3/02 6016) for support of A.I.S.H. as a visiting graduate student from the Department of Physics and Astronomy, University of Aarhus, Denmark.
References
- (1).Zubarev RA, Kelleher NL, McLafferty FW. J. Am. Chem. Soc. 1998;120:3265–3266. [Google Scholar]
- (2).Zubarev RA, Haselmann KF, Budnik B, Kjeldsen F, Jensen F. Eur. J. Mass Spectrom. 2002;8:337–349. [Google Scholar]
- (3).Leymarie N, Costello CE, O'Connor PB. J. Am. Chem. Soc. 2003;125:8949–8958. doi: 10.1021/ja028831n. [DOI] [PubMed] [Google Scholar]
- (4).Ge Y, Lawhorn BG, ElNaggar M, Strauss E, Park JH, Begley TP, McLafferty FW. J. Am. Chem. Soc. 2002;124:672–678. doi: 10.1021/ja011335z. [DOI] [PubMed] [Google Scholar]
- (5).Hvelplund P, Liu B, Nielsen SB, Tomita S. Int. J. Mass Spectrom. 2003;225:83–87. [Google Scholar]
- (6).Hvelplund P, Liu B, Nielsen SB, Tomita S, Cederquist H, Jensen J, Schmidt HT, Zettergren H. Eur. Phys. J. D. 2003;22:75–79. [Google Scholar]
- (7).Coon JJ, Shabanowitz J, Hunt DF, Syka JEP. J. Am. Soc. Mass Spectrom. 2005;16:880–882. doi: 10.1016/j.jasms.2005.01.015. [DOI] [PubMed] [Google Scholar]
- (8).Syka JEP, Coon JJ, Schroeder MJ, Shabanowitz J, Hunt DF. Proc. Natl. Acad. Sci. U.S.A. 2004;101:9528–9533. doi: 10.1073/pnas.0402700101. [DOI] [PMC free article] [PubMed] [Google Scholar]
- (9).Paizs B, Suhai S. Mass Spectrom. Rev. 2005;24:508–548. doi: 10.1002/mas.20024. [DOI] [PubMed] [Google Scholar]
- (10).Cooper HJ. J. Am. Soc. Mass Spectrom. 2005;16:1932–1940. doi: 10.1016/j.jasms.2005.07.014. [DOI] [PubMed] [Google Scholar]
- (11).Liu HC, Håkansson K. J. Am. Soc. Mass Spectrom. 2007;18:2007–2013. doi: 10.1016/j.jasms.2007.08.015. [DOI] [PubMed] [Google Scholar]
- (12).Schnier PD, Price WD, Jockusch RA, Williams ER. J. Am. Chem. Soc. 1996;118:7178–7189. doi: 10.1021/ja9609157. [DOI] [PMC free article] [PubMed] [Google Scholar]
- (13).Jockusch RA, Schnier PD, Price WD, Strittmatter EF, Demirev PA, Williams ER. Anal. Chem. 1997;69:1119–1126. doi: 10.1021/ac960804q. [DOI] [PMC free article] [PubMed] [Google Scholar]
- (14).Price WD, Schnier PD, Williams ER. Anal. Chem. 1996;68:859–866. doi: 10.1021/ac951038a. [DOI] [PubMed] [Google Scholar]
- (15).Polfer NC, Oomens J, Suhai S, Paizs B. J. Am. Chem. Soc. 2005;127:17154–17155. doi: 10.1021/ja056553x. [DOI] [PubMed] [Google Scholar]
- (16).Polfer NC, Oomens J, Suhai S, Paizs B. J. Am. Chem. Soc. 2007;129:5887–5897. doi: 10.1021/ja068014d. [DOI] [PubMed] [Google Scholar]
- (17).El Aribi H, Rodriquez CF, Almeida DRP, Ling Y, Mak WWN, Hopkinson AC, Siu KWM. J. Am. Chem. Soc. 2003;125:9229–9236. doi: 10.1021/ja0207293. [DOI] [PubMed] [Google Scholar]
- (18).Harrison AG, Csizmadia IG, Tang TH. J. Am. Soc. Mass Spectrom. 2000;11:427–436. doi: 10.1016/S1044-0305(00)00104-5. [DOI] [PubMed] [Google Scholar]
- (19).Laskin J, Bailey TH, Futrell JH. Int. J. Mass Spectrom. 2006;249:462–472. [Google Scholar]
- (20).Wysocki VH, Tsaprailis G, Smith LL, Breci LA. J. Mass Spectrom. 2000;35:1399–1406. doi: 10.1002/1096-9888(200012)35:12<1399::AID-JMS86>3.0.CO;2-R. [DOI] [PubMed] [Google Scholar]
- (21).Bakken V, Helgaker T, Uggerud E. Eur. J. Mass Spectrom. 2004;10:625–638. doi: 10.1255/ejms.665. [DOI] [PubMed] [Google Scholar]
- (22).Breuker K, Oh HB, Lin C, Carpenter BK, McLafferty FW. Proc. Natl. Acad. Sci. U.S.A. 2004;101:14011–14016. doi: 10.1073/pnas.0406095101. [DOI] [PMC free article] [PubMed] [Google Scholar]
- (23).Chamot-Rooke J, Malosse C, Frison G, Tureček F. J. Am. Soc. Mass Spectrom. 2007;18:2146–2161. doi: 10.1016/j.jasms.2007.09.009. [DOI] [PubMed] [Google Scholar]
- (24).Fung YME, Chan TWD. J. Am. Soc. Mass Spectrom. 2005;16:1523–1535. doi: 10.1016/j.jasms.2005.05.001. [DOI] [PubMed] [Google Scholar]
- (25).Sobczyk M, Anusiewicz W, Berdys-Kochanska J, Sawicka A, Skurski P, Simons J. J. Phys. Chem. A. 2005;109:250–258. doi: 10.1021/jp0463114. [DOI] [PubMed] [Google Scholar]
- (26).Syrstad EA, Tureček F. J. Am. Soc. Mass Spectrom. 2005;16:208–224. doi: 10.1016/j.jasms.2004.11.001. [DOI] [PubMed] [Google Scholar]
- (27).Tureček F. J. Am. Chem. Soc. 2003;125:5954–5963. doi: 10.1021/ja021323t. [DOI] [PubMed] [Google Scholar]
- (28).Tureček F, Syrstad EA. J. Am. Chem. Soc. 2003;125:3353–3369. doi: 10.1021/ja021162t. [DOI] [PubMed] [Google Scholar]
- (29).Tureček F, Syrstad EA, Seymour JL, Chen XH, Yao CX. J. Mass Spectrom. 2003;38:1093–1104. doi: 10.1002/jms.527. [DOI] [PubMed] [Google Scholar]
- (30).Zubarev RA, Kruger NA, Fridriksson EK, Lewis MA, Horn DM, Carpenter BK, McLafferty FW. J. Am. Chem. Soc. 1999;121:2857–2862. [Google Scholar]
- (31).Patriksson A, Adams C, Kjeldsen F, Raber J, van der Spoel D, Zubarev RA. Int. J. Mass Spectrom. 2006;248:124–135. [Google Scholar]
- (32).Xia Y, Gunawardena HP, Erickson DE, McLuckey SA. J. Am. Chem. Soc. 2007;129:12232–12243. doi: 10.1021/ja0736764. [DOI] [PubMed] [Google Scholar]
- (33).Breuker K, Oh HB, Horn DM, Cerda BA, McLafferty FW. J. Am. Chem. Soc. 2002;124:6407–6420. doi: 10.1021/ja012267j. [DOI] [PubMed] [Google Scholar]
- (34).Mihalca R, Kleinnijenhuis AJ, McDonnell LA, Heck AJR, Heeren RMA. J. Am. Soc. Mass Spectrom. 2004;15:1869–1873. doi: 10.1016/j.jasms.2004.09.007. [DOI] [PubMed] [Google Scholar]
- (35).Robinson EW, Leib RD, Williams ER. J. Am. Soc. Mass Spectrom. 2006;17:1469–1479. doi: 10.1016/j.jasms.2006.06.027. [DOI] [PMC free article] [PubMed] [Google Scholar]
- (36).Iavarone AT, Paech K, Williams ER. Anal. Chem. 2004;76:2231–2238. doi: 10.1021/ac035431p. [DOI] [PMC free article] [PubMed] [Google Scholar]
- (37).Liu DF, Wyttenbach T, Carpenter CJ, Bowers MT. J. Am. Chem. Soc. 2004;126:3261–3270. doi: 10.1021/ja0393628. [DOI] [PubMed] [Google Scholar]
- (38).Laskin J, Denisov E, Futrell JH. Int. J. Mass Spectrom. 2002;219:189–201. [Google Scholar]
- (39).Vékey K, Somogyi A, Wysocki VH. Rapid Commun. Mass Spectrom. 1996;10:911–918. doi: 10.1002/(SICI)1097-0231(19960610)10:8<911::AID-RCM593>3.0.CO;2-7. [DOI] [PubMed] [Google Scholar]
- (40).Rodgers MT, Armentrout PB. J. Am. Chem. Soc. 2000;122:8548–8558. [Google Scholar]
- (41).Yang ZB, Ruan C, Ahmed H, Rodgers MT. Int. J. Mass Spectrom. 2007;265:388–400. [Google Scholar]
- (42).Horn DM, Breuker K, Frank AJ, McLafferty FW. J. Am. Chem. Soc. 2001;123:9792–9799. doi: 10.1021/ja003143u. [DOI] [PubMed] [Google Scholar]
- (43).Horn DM, Ge Y, McLafferty FW. Anal. Chem. 2000;72:4778–4784. doi: 10.1021/ac000494i. [DOI] [PubMed] [Google Scholar]
- (44).Leib RD, Donald WA, O'Brien JT, Bush MF, Williams ER. J. Am. Chem. Soc. 2007;129:4894–4895. doi: 10.1021/ja0666607. [DOI] [PMC free article] [PubMed] [Google Scholar]
- (45).Leib RD, Donald WA, Bush MF, O'Brien JT, Williams ER. J. Am. Soc. Mass Spectrom. 2007;18:1217–1231. doi: 10.1016/j.jasms.2007.03.033. [DOI] [PMC free article] [PubMed] [Google Scholar]
- (46).Donald WA, Leib RD, O'Brien JT, Bush MF, Williams ER. J. Am. Chem. Soc. 2008;130:3371–3381. doi: 10.1021/ja073946i. [DOI] [PMC free article] [PubMed] [Google Scholar]
- (47).Leib RD, Donald WA, O'Brien JT, Bush MF, Williams ER. J. Am. Chem. Soc. 2007;129:7716–7717. doi: 10.1021/ja067794n. [DOI] [PMC free article] [PubMed] [Google Scholar]
- (48).O'Brien JT, Prell JS, Holm AIS, Williams ER. J. Am. Soc. Mass Spectrom. 2008;19:772–779. doi: 10.1016/j.jasms.2008.02.010. [DOI] [PMC free article] [PubMed] [Google Scholar]
- (49).Bush MF, Saykally RJ, Williams ER. Int. J. Mass Spectrom. 2006;253:256–262. doi: 10.1016/j.ijms.2006.04.009. [DOI] [PMC free article] [PubMed] [Google Scholar]
- (50).Wong RL, Paech K, Williams ER. Int. J. Mass Spectrom. 2004;232:59–66. [Google Scholar]
- (51).Jurchen JC, Williams ER. J. Am. Chem. Soc. 2003;125:2817–2826. doi: 10.1021/ja0211508. [DOI] [PMC free article] [PubMed] [Google Scholar]
- (52).Rodriguez-Cruz SE, Klassen JS, Williams ER. J. Am. Soc. Mass Spectrom. 1999;10:958–968. doi: 10.1016/S1044-0305(99)00068-9. [DOI] [PMC free article] [PubMed] [Google Scholar]
- (53).Price WD, Schnier PD, Jockusch RA, Strittmatter EF, Williams ER. J. Am. Chem. Soc. 1996;118:10640–10644. doi: 10.1021/ja961812r. [DOI] [PMC free article] [PubMed] [Google Scholar]
- (54).Price WD, Williams ER. J. Phys. Chem. A. 1997;101:8844–8852. doi: 10.1021/jp9722418. [DOI] [PMC free article] [PubMed] [Google Scholar]
- (55).Chakraborty T, Holm AIS, Hvelplund P, Nielsen SB, Poully J-C, Worm ES, Williams ER. J. Am. Soc. Mass Spectrom. 2006;17:1675–1680. doi: 10.1016/j.jasms.2006.07.018. [DOI] [PubMed] [Google Scholar]
- (56).The isotopic contribution of (KYK + H)+ (m/z 438) was subtracted from the abundance of m/z 439 to obtain the abundance of (KYK + H)+•
- (57).Chan TWD, Ip WHH. J. Am. Soc. Mass Spectrom. 2002;13:1396–1406. doi: 10.1016/S1044-0305(02)00703-1. [DOI] [PubMed] [Google Scholar]
- (58).Kjeldsen F, Haselmann KF, Budnik BA, Jensen F, Zubarev RA. Chem. Phys. Lett. 2002;356:201–206. [Google Scholar]
- (59).Tsybin YO, He H, Emmett MR, Hendrickson CL, Marshall AG. Anal. Chem. 2007;79:7596–7602. doi: 10.1021/ac071165u. [DOI] [PubMed] [Google Scholar]
- (60).Någård MB, Pettersson JBC, Derkatch AM, Al Khalili A, Neau A, Rosen S, Larsson M, Semaniak J, Danared H, Kallberg A, Österdahl F, af Ugglas M. J. Chem. Phys. 2002;117:5264–5270. [Google Scholar]
- (61).Liu DF, Wyttenbach T, Barran PE, Bowers MT. J. Am. Chem. Soc. 2003;125:8458–8464. doi: 10.1021/ja034638x. [DOI] [PubMed] [Google Scholar]
- (62).Wyttenbach T, Liu DF, Bowers MT. Int. J. Mass Spectrom. 2005;240:221–232. [Google Scholar]
- (63).Donald WA, Williams ER. J. Phys. Chem. A. 2008;112:3515–3522. doi: 10.1021/jp711012b. [DOI] [PMC free article] [PubMed] [Google Scholar]
- (64).Armentrout PB. In: Modern Mass Spectrometry. Schalley CA, editor. Vol. 225. Springer; Berlin: 2003. pp. 233–262. [Google Scholar]
- (65).McLafferty FW, Horn DM, Breuker K, Ge Y, Lewis MA, Cerda B, Zubarev RA, Carpenter BK. J. Am. Soc. Mass Spectrom. 2001;12:245–249. doi: 10.1016/S1044-0305(00)00223-3. [DOI] [PubMed] [Google Scholar]
- (66).Yao CX, Tureček F. Phys. Chem. Chem. Phys. 2005;7:912–920. doi: 10.1039/b414764b. [DOI] [PubMed] [Google Scholar]
- (67).Rand KD, Adams CM, Zubarev RA, Jørgensen TJD. J. Am. Chem. Soc. 2008;130:1341–1349. doi: 10.1021/ja076448i. [DOI] [PubMed] [Google Scholar]


