

Abstract
Biomarkers for treatment response would facilitate the testing of urgently needed new anti-tuberculous drugs. The present study investigated the profiles of 30 proinflammatory, anti-inflammatory and angiogenic factors [epidermal growth factor, eotaxin, fractalkine, granulocyte colony-stimulating factor, granulocyte–macrophage colony-stimulating factor, interleukin (IL)-1α, IL-1β, IL-1ra, IL-2, IL-4, IL-5, IL-6, IL-7, IL-8, IL-10, IL-12p40, IL-12p70, IL-13, IL-15, IL-17, interferon-γ, interferon-inducible protein-10, Krebs von den Lungen-6, monocyte chemotactic protein-1, macrophage inflammatory protein (MIP)-1α, MIP-1β, sCD40L, transforming growth factor-α, tumour necrosis factor-α and vascular endothelial growth factor] in the plasma of 12 healthy tuberculin skin test-positive community controls and 20 human immunodeficiency virus-negative patients with active tuberculosis (TB) and identified potential biomarkers for early treatment response. We showed differences in the level of circulating cytokines between healthy controls and TB patients, but also between fast responders and slow responders to anti-tuberculosis treatment. The general discriminant analysis based on pre-treatment and week 1 measurements identified 10 sets of three-variable models that could classify fast and slow responders with up to 83% accuracy. Overall, this study shows the potential of cytokines as indicators of anti-tuberculosis treatment response.
Keywords: biomarkers, cytokine, treatment response, tuberculosis
Introduction
Mycobacterium tuberculosis, an obligate, aerosol-transmitted bacterium, is known for its ability to enter a dormant state under adverse metabolic conditions and to delay its multiplication for years, enabling long-term survival in humans [1]. Despite the availability of chemotherapies to combat tuberculosis (TB), the TB epidemic is not under control and case-loads increase every year [2,3]. Several factors are involved in the rise in incidence of TB: the ability of the bacteria to subvert the host immune response, poor TB management programmes, poor treatment adherence, co-infection with the human immunodeficiency virus (HIV) and the emergence of drug-resistant M. tuberculosis strains. It has been predicted that, if TB control is not improved, 1 billion people will be newly infected with M. tuberculosis by 2020, more than 150 million people will develop active TB and 36 million will die as a result of this infection [4].
The International Union Against Tuberculosis and Lung Disease (IUATLD) currently recommends the Ziehl–Nielssen test for bacilli in the sputum 2 months after the start of therapy as a marker of early treatment response for patients undergoing directly observed short-course anti-TB chemotherapy (DOTS) [5]. Implementation of the IUATLD recommendations has certainly improved TB outcome, although there are limitations to this current evaluation process, mainly because 2 months is too long to ascertain the individual treatment response, which may have clinical implications, including the need for drug sensitivity testing or changes in treatment regimens. Additionally, during this 2-month period, primary multi-drug resistant organisms will remain untreated and drug-resistant mycobacteria may have time to develop resistance to additional drugs in partly effective regimens [6]. The discovery of biomarkers for TB treatment response is therefore important for both clinical practice and for clinical trials of new anti-TB drugs. Such markers may include three different types: markers for relapse after initial cure, markers for early treatment effect and markers of baseline differences between patients. Markers for relapse may reduce the duration of clinical trials, which currently have to include at least a 2-year follow-up per participant, as this is the time-frame during which most relapses occur. Markers for early treatment effect may replace sputum culture or smear status at month 2 of treatment, which is currently the only accepted indicator of early response. Markers for baseline differences may identify patients with different treatment needs (i.e. duration of therapy) and may ensure equality across treatment arms in clinical trials. The present study aims to screen 30 host markers in small groups of TB patients and controls to identify promising markers for large-scale testing, which would not be financially feasible for a large number of potential markers. We will focus upon differences between controls and TB patients, baseline differences between responder phenotypes and changes of marker levels during treatment.
A successful host response to an invading pathogen requires precise co-ordination of the components of the immune system [7]. The recognition of a pathogen by phagocytes induces cell activation and cytokine and chemokine secretion [7], requiring a complex process of regulation and cross-regulation. Depending on the magnitude and type of cytokine responses that are induced, the host protective mechanisms can be stimulated and also over-stimulated, leading to tissue injury, fever and cachexia [8,9]. With advances in technology and knowledge of physiological and pathogenic features of TB, we can now assess the relationship between secreted host proteins and treatment response phenotypes, opening the door to the identification of prognostic or response markers.
The present study investigated the profiles of Krebs von den Lungen (KL)-6 (a mucin-like glycoprotein expressed on type II pneumocytes) and 29 cytokines, including proinflammatory, anti-inflammatory and angiogenic factors in healthy tuberculin skin test-positive community controls and HIV-negative patients with active TB before treatment, during treatment and at the end of treament. The hypothesis was that the magnitude of changes in host parameters associated with the anti-mycobacterial immune response during active infection with M. tuberculosis, and during anti-tuberculosis chemotherapy can be used to predict early treatment outcome.
Materials and methods
Subjects
Twelve healthy community controls with latent TB infection (LTBI) as indicated by a positive (≥ 10 mm) tuberculin skin test and absence of symptoms and signs of active TB and 29 newly diagnosed sputum smear- and BACTEC 460T (Becton Dickinson, Cowley, Oxford, UK) culture-positive patients, infected with drug-sensitive M. tuberculosis strains, from the Cape Town metropolitan area in South Africa were enrolled, started on DOTS treatment and followed up for 26 weeks. Nine patients were excluded for non-adherence to treatment, multi-drug-resistant TB, refusal to undergo HIV testing or incomplete follow-up visits. The remaining 20 patients (11 males and nine females, aged 18–51 years) and controls (three males and 10 females, aged 21–47 years) were HIV-negative. Patients were classified into fast or slow responders to chemotherapy based on their BACTEC culture status at week 8 after start of treatment. Eight fast responders (sputum culture-negative) and 12 slow responders (sputum culture-positive) were identified. Leucocyte profiles and phenotypes of this population [10], as well as the serum levels of selected immune parameters [11], have been investigated previously and reported.
Samples
Plasma samples were collected from healthy LTBI individuals at one time-point and from all active TB patients before treatment and at weeks 1, 5, 13 and 26 after the start of anti-tuberculosis treatment and stored at –80°C until tested by Luminex and enzyme-linked immunosorbent assay (ELISA).
Linco-plex assay
The Lincoplex human cytokine 29-plex assays (Millipore, Billerica, MA, USA) were performed in duplicate and according to the manufacturer's instructions in a filter plate with vacuum aspiration for the washing steps. All reagents were supplied in the kits. A standard curve ranging from 3·2 pg/ml to 10 000 pg/ml was generated for each assay. After a blocking step the undiluted plasma samples or standards were mixed with fluorescent beads coated with capture antibody. After incubation and washing, the beads were reacted with biotinylated detection antibody followed by phycoerythrin-conjugated streptavidin. The beads were analysed immediately on a Bio-plex array reader (Bio-rad, Hercules, CA, USA).
The KL-6 ELISA
Plasma KL-6 was measured using sandwich ELISA kits (Sanko Junyaku, Tokyo, Japan). Samples, standards and controls were assayed in duplicate according to the manufacturer's protocol. Plates were read using a Biotek microplate reader (Winooski, VT, USA) set to 405 nm. Concentrations of the respective analytes were determined using the Biotek KC 4 version 3.4 software.
Interplate and intra-assay quality controls
The reliability and accuracy of the individual kits in measuring the selected cytokines were assessed using the quality controls provided with the kits. The levels of each of the measured cytokines fell within the manufacturer's expected range. As interplate quality control, we used five aliquots from the plasma of one patient; one aliquot of the interplate control was included in each plate with each run. For each of the cytokines measured, the variation of the interplate control did not generally exceed 15%.
Statistics
All statistical analyses of the soluble markers was performed using statistica software version 7. The difference between the level of cytokines in healthy individuals with LTBI and active TB patients was analysed using Mann–Whitney U-tests. One-way anova was used to analyse the changes in cytokine levels in active TB patients from diagnosis to treatment end. Statistical analysis of the immune response between groups (slow and fast responders) was performed using variance estimation, precision and comparison analysis including the least significant difference (LSD)-test. The predictive power of the measured analytes for sputum culture status at week 8 was assessed by general discriminant analysis (GDA) and support vector machines [12].
Ethics
Written consent was obtained from all participants. The study was approved by the local health committees representing the people in the areas and the Ethics Committee of the Faculty of Health Sciences, Stellenbosch University, the Ethics Committee of Tygerberg Hospital and the Head of Health, City of Cape Town.
Results
The LTBI individuals and TB patients
Proinflammatory and T helper type 1-type cytokines
No significant differences were found between the plasma levels of granulocyte colony-stimulating factor (G-CSF), granulocyte–macrophage colony-stimulating factor (GM-CSF), interferon (IFN)-γ, interleukin (IL)-1α, IL-1β, IL-1ra, IL-2, IL-12p40, IL-12p70, IL-15, IL-17, IL-8, monocyte chemotactic protein (MCP)-1, macrophage inflammatory protein (MIP)-1α, MIP-1β and sCDs40L in LTBI individuals and active TB patients before treatment. Generally, very low to undetectable levels of IL-1α, IL-1β, IL-2, IL-8, IL-12p70, IL-15, IL-17, GM-CSF and tumour necrosis factor (TNF)-alpha were found in both groups. The levels of IL-6 and interferon-inducible protein (IP)-10 were significantly higher in active TB patients compared with LTBI controls (P = 0·01; P = 0·001 respectively) (Fig. 1a and b) and dropped significantly from pretreatment levels during therapy [P = 0·02; P = 0·000002 respectively (week 26)] (Fig. 1c and d). During treatment, G-CSF, GM-CSF, IL-1α, IL-1β, IL-2, IL-7, IL-8, IL-12p70, IL-15, IL-17 and IFN-γ levels remained low or unchanged. Although the P-value did not reach statistical significance, active TB patients before treatment had lower levels of MCP-1 than individuals with LTBI. During anti-TB treatment MCP-1 level increased significantly compared with pretreatment (week 1: P = 0·0005; week 5: P = 0·000001), reaching levels observed in individuals with LTBI by week 5. At the end of treatment MCP-1 concentrations remained significantly higher compared with pretreatment levels (P = 0·0003) (Fig. 2a–f). At weeks 1 or 5 after the initiation of treatment a significant but transient increase in the concentrations of IL-12p40 (week 1: P = 0·01), MIP-1α (week 1: P = 0·02; week 5: P = 0·001), MIP-1β (week 1: P = 0·03), sCD40L (week 5: P = 0·00001) and TNF-α (week 5: P = 0·0003) were observed in active TB patients before returning to pretreatment levels (Fig. 2a–f).
Fig. 1.

Plasma concentrations of (a) interleukin (IL)-6 and (b) interferon-inducible protein (IP)-10 in individuals with latent tuberculosis infection (LTBI) and active tuberculosis (TB) pretreatment (PT). (c) Mean concentrations of IL-6 and (d) IP-10 in the plasma of active TB patients PT, and at weeks (W) 1, 5, 13 and 26 of treatment. The vertical bars denote 95% confidence intervals. *Significant difference between groups; +: significant difference from pretreatment. */+: P < 0·05; **/++: P < 0·005; ***/+++: P < 0·0005.
Fig. 2.

Mean concentrations of (a) interleukin (IL)-12p40, (b) monocyte chemotactic protein (MCP)-1, (c) macrophage inflammatory protein (MIP)-1α, (d) MIP-1β, (e) sCD40L and (f) tumour necrosis factor (TNF)-α in the plasma of active tuberculosis (TB) patients pretreatment (PT) and at weeks (W) 1, 5, 13 and 26 of treatment. The vertical bars denote 95% confidence intervals. +Significant differences from pretreatment; +: P < 0·05; ++: P < 0·005; +++: P < 0·0005.
Anti-inflammatory and T helper type 1-type antagonist cytokines
The IL-4, IL-5, IL-10 and IL-13 were present at very low levels in both LTBI and active TB patients before treatment. Eotaxin was significantly lower in TB patients before treatment when compared with LTBI controls (P = 0·006) (Fig. 3a). In active TB patients the levels of eotaxin rose progressively and significantly during treatment when compared with pretreatment levels (week 1: P = 0·004; week 5: P = 0·0001; week 13: P = 0·0005; week 26: P = 0·000002) and reached control values by the end of treatment (Fig. 3b). IL-10 and IL-13 peaked at week 1 (P = 0·01) and week 5 (P = 0·003) respectively, before returning to their baseline levels at the end of treatment (Fig. 3c and d).
Fig. 3.

Plasma concentrations of (a) eotaxin in individuals with latent tuberculosis infection (LTBI) and active active tuberculosis (TB) (pretreatment). (b) Mean concentrations of eotaxin, (c) interleukin (IL)-10 and (d) IL-13 in the plasma of active TB patients pretreatment (PT), at weeks (W) 1, 5, 13 and 26 of treatment. The vertical bars denote 95% confidence intervals. *Significant difference between groups: +: significant differences from pretreatment; */+: P < 0·05; **/++: P < 0·005; ***/+++: P < 0·0005.
Angiogenic factors and KL-6
No significant differences were found between LTBI controls and active TB patients before treatment for the levels of epidermal growth factor (EGF), fractalkine, IL-7, transforming growth factor (TGF)-α and vascular endothelial growth factor (VEGF). KL-6 protein concentration was significantly higher in active TB compared with LTBI (P = 0·0008) (Fig. 4a). No significant changes in the levels of fractalkine, TGF-α, VEGF and KL-6 were seen in active TB patients during the course of treatment. EGF increased significantly in active TB patients at week 1 (P = 0·02) and week 5 (P = 0·002) of treatment, compared with pretreatment levels, and returned to its baseline levels at the end of treatment (Fig. 4b).
Fig. 4.

Plasma concentrations of (a) Krebs von den Lungen (KL)-6 protein in individuals with latent tuberculosis infection (LTBI) and active tuberculosis (TB) [pretreatment (PT)]. (b) Mean concentrations of epidermal growth factor (EGF) in the plasma of active TB patients pretreatment and at weeks (W) 1, 5, 13 and 26 of treatment. The vertical bars denote 95% confidence intervals. *Significant difference between groups; +: significant difference from pretreatment; */+: P < 0·05; **/++: P < 0·005; ***/+++: P < 0·0005.
Cytokine profiles in fast and slow responders to anti-TB treatment
The repeated-measures analysis showed no significant differences in cytokine secretion by fast and slow responders during anti-TB treatment. However, the LSD test, which allowed comparison between fast and slow responders at specified time-points, revealed that there were differences in cytokine production between the fast and the slow responders. Analysis of week 1 plasma showed that the slow responders had significantly higher levels of IL-10 and MIP-1α than the fast responders (P = 0·04 and P = 0·02 respectively) (Fig. 5a and b). In the fifth week of treatment, fast responders had significantly higher levels of IL-13 and sCD40L compared with the slow responders (P = 0·02 and P = 0·04 respectively) (Fig. 5c and d). Additionally, the separate analysis of the cytokine secretion profile for each group showed a relatively constant level of IL-15 and VEGF in fast responders throughout treatment and a significant increase of IL-15 and VEGF in slow responders after 1 week of treatment (P = 0·03 and P = 0·02 respectively) (Fig. 5e and f).
Fig. 5.
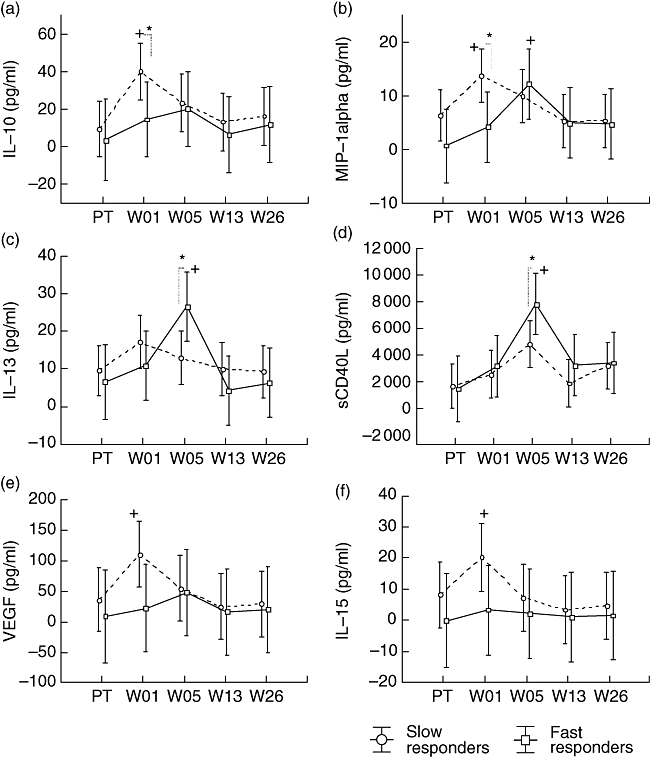
Differences in plasma markers of active tuberculosis (TB) patients with fast and slow treatment responses. Blood was collected pretreatment (PT) and at weeks (W) 1, 5, 13 and 26 of treatment. Host markers were measured using the Luminex platform. (a) Interleukin (IL)-10, (b) macrophage inflammatory protein (MIP)-1α, (c) IL-13, (d) sCD40L, (e) vascular endothelial growth factor (VEGF), (f) IL-15 mean concentrations are shown. The vertical bars denote 95% confidence intervals. *Significant difference between groups; +: significant differences from pretreatment; */+: P < 0·05; **/++: P < 0·005; ***/+++: P < 0·0005.
Further analysis of our data using multi-variant analysis (GDA) produced 10 three-variable models with the ability to classify fast and slow responders with up to 83% accuracy using pretreatment and week 1 measurements. The frequency with which variables were used as classifiers in the 10 models is shown in Fig. 6. The level of pretreatment MCP-1 was used the most, followed by the pretreatment level of IL-10 and week 1 level of TGF-α, MIP-1α and IP-10. Based on the GDA, fast responders to treatment are characterized by lower concentrations of IL-10 (pretreatment), MCP-1 (pretreatment), MIP-1α (week 1), TGF-α (week 1) and IP-10 (week 1) when compared with slow responders.
Fig. 6.

Number of inclusions of individual variables into the top 10 three-variable predictive models for week 8 sputum status as determined by general discriminant analysis (GDA). The top 10 models had accuracies exceeding 83%. W00 represents pretreatment and W01 represents week 1 of tuberculosis treatment.
Discussion
In this study we investigated the profiles of 29 plasma cytokines/chemokines and KL-6 protein in healthy LTBI community controls and active TB patients before and during anti-tuberculosis treatment to identify promising markers for treatment effect and baseline differences between responder phenotypes for future larger-scale testing.
Eleven of 29 markers included in the commercial Luminex kit were present in very low to undetectable concentrations in the plasma of healthy LTBI controls and active TB patients throughout therapy. Although detectable, no significant differences in levels of fractalkine, G-CSF, IFN-γ, IL-1ra, TGF-α and VEGF were found between healthy LTBI individuals and active TB patients at any time during treatment. In patients with active TB this may be surprising, but there are at least two possible explanations for this observation. First, localization of the disease to the lung and compartmentalized expression of some cytokines [13–15] could play a role and secondly, the nature and function of some cytokines could preclude significant involvement in the immunity or immunopathology to TB [16–18].
The differential expression of IL-6 and IP-10 observed between healthy controls with LTBI and active TB patients before treatment is indicative of disease activity, and is consistent with previous reports on IL-6 [9,19–21] and with the study of Azzuri et al.[22]. KL-6 is secreted principally by type II pneumocytes and associated with lung injury and the consistently high levels of KL-6 in active TB patients is in keeping with previous publications on lung diseases [23–25].
The increased levels of EGF, IL-10, IL-12p40, IL-13, MCP-1, MIP-1α, MIP-1β and sCD40L in active TB patients after the initiation of anti-tuberculosis treatment, and their resolution by the end of treatment, as well as the decrease of IL-6, IP-10 and TNF-α to normal levels following therapy, may suggest the transient induction of regulatory immune mechanisms leading to subsequent restoration of immune homeostasis. These cytokines may be suitable non-specific biomarkers of treatment effect [26] and should be investigated further.
The comparison of fast and slow responders to treatment showed that the levels of IL-10 were significantly higher in slow responders very early during treatment, suggesting that an early increased anti-inflammatory response during treatment may lead to the delay of sputum culture conversion in patients. Indeed, it has been demonstrated that IL-10 promotes mycobacterial persistence by acting on macrophages [27]. Furthermore, although the slow responders had significantly higher levels of MIP-1α only at week 1, this suggests a higher bacterial activity and increased macrophage activation in slow responders. It is known that MIP-1α is produced by macrophages after bacterial stimulation [28,29].
Concentrations of IL-13 and sCD40 ligand were found to be significantly higher in fast responders to treatment than in slow responders in the fifth week of treatment. The role of IL-13 in M. tuberculosis infection is not well defined. Harris et al. showed that IL-13 abrogates autophagy-mediated killing of M. tuberculosis in human and murine macrophages [30]. However, IL-13 has been shown to modulate resistance to a number of intracellular pathogens including Leishmania major, L. mexicana and Listeria monocytogenes[31]. In viral lung infection, a high concentration of IL-13 was associated with reduced illness, impaired replication of syncytial virus and reduced weight loss in a murine model [32]. Thus the elevated level of IL-13 observed in fast responders compared with slow responders may suggest their better resistance to the infection, although the mechanisms for the IL-13 effect are not yet clear.
CD40 ligand is a co-stimulatory molecule which is expressed on activated antigen-presenting cells, basophils, eosinophils, mast cells and platelets [33–37]. CD40 ligand interacts with its receptor CD40 which is found on dendritic cells, monocytes, eosinophils, neutrophils and B cells [35,38]. CD40/CD40 ligand interaction has been shown to stimulate IL-12 production to a great extent, thereby enhancing cell-mediated immunity to intracellular pathogen [39,40]. Although no significant differences were found between fast and slow responders for the concentration of IL-12, our data showed a significant increase of both soluble CD40 ligand and IL-12p40 in all patients between weeks 1 and 5. Additionally, CD40 ligand gene defect leads to increased susceptibility to pathogens [41,42]. In tuberculosis, Samten et al. demonstrated that depressed CD40 ligand contributes to reduced M. tuberculosis-induced IFN-γ production by peripheral blood nuclear cells [43] and that the CD8+ T cell response to M. tuberculosis could be enhanced by CD40 ligand trimers [44]. Thus, the high level of soluble CD40 ligand observed at week 5 in fast responders compared with slow responders could most probably be a reflection of an enhanced early immune responses that takes place after treatment-induced reduction of bacterial numbers, which may be more noticeable in fast responders. Additionally, the multi-variant analysis performed on pretreatment and week 1 measurements showed that high pretreatment levels of IL-10 and MCP-1 and high levels of MIP-1-α, TGF-α and IP-10 at week 1 of treatment are indicators of late sputum culture sterilization in patients.
The MCP-1 chemoattractant function is crucial for anti-mycobacterial responses [45–47]. Here we showed that initially low MCP-1 levels increased during anti-TB treatment to the levels observed in healthy subjects, which may suggest some restoration of host immune function after chemotherapy-induced reduction of the bacterial burden. However, studies have also shown that MCP-1 may increase susceptibility to M. tuberculosis infection in mice [48] and humans [49], and that high levels of the protein are associated with death in patients with the acute respiratory distress syndrome [50,51]. Although the difference in MCP-1 levels between the two responder groups did not reach statistical significance, the prominent role of higher levels of this marker (although still lower than in healthy controls) in the multi-variate predictive models for late sputum conversion is difficult to explain. Whether this is a spurious finding in an underpowered study or whether this is a reflection of underlying pathophysiological mechanisms needs to be explored in further studies.
Angiogenic factors including EGF, fractalkine, TGF-α and VEGF are involved in wound healing and tissue repair. Thus, the level of angiogenic factors during infection most probably reflects the degree of the infection and disease activity [52–55] as their secretion is stimulated by pathogens and tissue damage [55–57]. To our knowledge, this is one of the first reports on TGF-α responses to anti-tuberculosis treatment. Here we showed, using multi-variant analysis, that TGF-α is a discriminative parameter in the identification of slow and fast responders to treatment. Although VEGF was not selected by the multi-variant analysis as the discriminative factor between the responder groups, increased VEGF was found in slow responders but not in fast responders after 1 week of treatment, supporting a role of angiogenic factors as potential biomarkers of disease activity and delayed resolution of infection. Like VEGF, IL-15 remained relatively constant in fast responders throughout treatment, whereas it increased significantly in slow responders at week 1 after initiation of treatment before returning to the pretreatment level. Secreted by phagocytes following infection by intracellular pathogens, IL-15 induces natural killer and innate immune cell proliferations [58,59]. Therefore, the increased level of IL-15 observed in the slow responders at week 1 may indicate increased activation of the innate immune response much needed to control what is, for the slow responders, an overwhelming infection.
The present study identified a number of candidate immune markers (IL-10, IL-13, IP-10, MCP-1, MIP-1-α, sCD40 ligand and TGF-α) with a good potential as biomarkers for treatment response and early identification of fast and slow responders to anti-TB treatment. These candidates, together with those identified in our previous study [11], need to be investigated further and validated in large-scale studies. However, these findings are encouraging, as they support the concept of host biomarkers for the prediction of differential treatment responses. This concept, if validated, could lead to the development of clinical interventions and accelerate the conduction of TB clinical trials.
Acknowledgments
We acknowledge the European and Developing Countries Clinical Trials Partnership for funding support.
References
- 1.Cardona PJ, Ruiz-Manzano J. On the nature of Mycobacterium tuberculosis-latent bacilli. Eur Respir J. 2004;24:1044–51. doi: 10.1183/09031936.04.00072604. [DOI] [PubMed] [Google Scholar]
- 2.Global Tuberculosis Control: Surveillance. 2008. Planning, Financing: WHO report.
- 3.Dolin PJ, Raviglione MC, Kochi A. Global tubercolosis incidence and mortality during 1990–2000. Bull WHO. 1994;72:213–20. [PMC free article] [PubMed] [Google Scholar]
- 4.World Health Organization. World Health Organization fact sheet. Geneva, Switzerland: World Health Organization; 2002. [Google Scholar]
- 5.Enarson DE, Rieder HL, Arnadottir T, Trebucq A. Management of tuberculosis a guide for low income countries. 5th edn. Paris: IUATLD; 2000. [Google Scholar]
- 6.Sharma KS, Mohan A. Multidrug-resistant tuberculosis. Chest. 2006;130:261–72. doi: 10.1378/chest.130.1.261. [DOI] [PubMed] [Google Scholar]
- 7.Frankenstein Z, Alon U, Cohen I. The immune-body cytokine network defines a social architecture of cell interactions. Biol Direct. 2006;1:32. doi: 10.1186/1745-6150-1-32. [DOI] [PMC free article] [PubMed] [Google Scholar]
- 8.Zganiacz A, Santosuosso M, Wang J, et al. TNF-alpha is a critical negative regulator of type 1 immune activation during intracellular bacterial infection. J Clin Invest. 2004;113:401–13. doi: 10.1172/JCI18991. [DOI] [PMC free article] [PubMed] [Google Scholar]
- 9.Juffermans NP, Verbon A, van Deventer SJ, van Deutekom H, Speelman P, van der Poll T. Tumor necrosis factor and interleukin-1 inhibitors as markers of disease activity of tuberculosis. Am J Respir Crit Care Med. 1998;157:1328–31. doi: 10.1164/ajrccm.157.4.9709126. [DOI] [PubMed] [Google Scholar]
- 10.Veenstra H, Baumann R, Carroll NM, et al. Changes in leucocyte and lymphocyte subsets during tuberculosis treatment; prominence of CD3dimCD56+ natural killer T cells in fast treatment responders. Clin Exp Immunol. 2006;145:252–60. doi: 10.1111/j.1365-2249.2006.03144.x. [DOI] [PMC free article] [PubMed] [Google Scholar]
- 11.Djoba Siawaya JF, Bapela NB, Ronacher K, et al. Immune parameters as markers of tuberculosis extent of disease and early prediction of anti-tuberculosis chemotherapy response. J Infect. 2008;56:340–7. doi: 10.1016/j.jinf.2008.02.007. [DOI] [PubMed] [Google Scholar]
- 12.Hastie T, Tibshirani R, Friedman J. The elements of statistical learning. Data mining, inference and predicition. New York/Berlin/Heidelberg: Springer-Verlag; 2001. [Google Scholar]
- 13.Bothamley GH. New tests for tuberculosis: local immune responses have greater specificity. Thorax. 2008;63:4–5. doi: 10.1136/thx.2007.084202. [DOI] [PubMed] [Google Scholar]
- 14.Hirsch CS, Toossi Z, Johnson JL, et al. Augmentation of apoptosis and interferon-gamma production at sites of active Mycobacterium tuberculosis infection in human tuberculosis. J Infect Dis. 2001;183:779–88. doi: 10.1086/318817. [DOI] [PubMed] [Google Scholar]
- 15.Schwander S, Torres M, Sada E, et al. Enhanced responses to Mycobacterium tuberculosis antigens by human alveolar lymphocytes during active pulmonary tuberculosis. J Infect Dis. 1998;178:1434–45. doi: 10.1086/314454. [DOI] [PubMed] [Google Scholar]
- 16.Finkelman FD, Morris SC. Development of an assay to measure in vivo cytokine production in the mouse. Int Immunol. 1999;11:1811–18. doi: 10.1093/intimm/11.11.1811. [DOI] [PubMed] [Google Scholar]
- 17.Lebecque S. A new job for dendritic cells. Nat Immunol. 2001;2:830–1. doi: 10.1038/ni0901-830. [DOI] [PubMed] [Google Scholar]
- 18.Saunders BM, Britton WJ. Life and death in the granuloma: immunopathology of tuberculosis. Immunol Cell Biol. 2007;85:103–11. doi: 10.1038/sj.icb.7100027. [DOI] [PubMed] [Google Scholar]
- 19.Law K, Weiden M, Harkin T, Tchou-Wong K, Chi C, Rom WN. Increased release of interleukin-1 beta, interleukin-6, and tumor necrosis factor-alpha by bronchoalveolar cells lavaged from involved sites in pulmonary tuberculosis. Am J Respir Crit Care Med. 1996;153:799–804. doi: 10.1164/ajrccm.153.2.8564135. [DOI] [PubMed] [Google Scholar]
- 20.Kiropoulos TS, Kostikas K, Oikonomidi S, et al. Acute phase markers for the differentiation of infectious and malignant pleural effusions. Respir Med. 2007;101:910–18. doi: 10.1016/j.rmed.2006.09.019. [DOI] [PubMed] [Google Scholar]
- 21.Saltini C, Colizzi V. Soluble immunological markers of disease activity in tuberculosis. Eur Respir J. 1999;14:485–6. doi: 10.1034/j.1399-3003.1999.14c01.x. [DOI] [PubMed] [Google Scholar]
- 22.Azzurri A, Sow OY, Amedei A, et al. IFN-[gamma]-inducible protein 10 and pentraxin 3 plasma levels are tools for monitoring inflammation and disease activity in Mycobacterium tuberculosis infection. Microbes Infect. 2005;7:1–8. doi: 10.1016/j.micinf.2004.09.004. [DOI] [PubMed] [Google Scholar]
- 23.Inoue Y, Nishimura K, Shiode M, et al. Evaluation of serum KL-6 in patients with pulmonary tuberculosis. Tuber Lung Dis. 1995;76:230–3. doi: 10.1016/s0962-8479(05)80010-3. [DOI] [PubMed] [Google Scholar]
- 24.Nobuoki K. Serum marker KL-6/MUCI 1 for the diagnosis and management of interstitial pneumonitis. J Med Invest. 1999;46:151–8. [PubMed] [Google Scholar]
- 25.Yokoyama A, Kohno N, Hamada H, et al. Circulating KL-6 predict the outcome of rapidly progressive idiopathic pulmonary fibrosis. Am J Respir Crit Care Med. 1998;158:1680–4. doi: 10.1164/ajrccm.158.5.9803115. [DOI] [PubMed] [Google Scholar]
- 26.Deveci F, Akbulut HH, Turgut T, Muz MH. Changes in serum cytokine levels in active tuberculosis with treatment. Mediat Inflamm. 2005;2005:256–62. doi: 10.1155/MI.2005.256. [DOI] [PMC free article] [PubMed] [Google Scholar]
- 27.Murray PJ, Wang L, Onufryk C, Tepper RI, Young RA. T. cell-derived IL-10 antagonizes macrophage function in mycobacterial infection. J Immunol. 1997;158:315–21. [PubMed] [Google Scholar]
- 28.Sherry B, Espinoza M, Manogue KR, Cerami A. Induction of the chemokine beta peptides, MIP-1 alpha and MIP-1 beta, by lipopolysaccharide is differentially regulated by immunomodulatory cytokines gamma-IFN, IL-10, IL-4, and TGF-beta. Mol Med. 1998;4:648–57. [PMC free article] [PubMed] [Google Scholar]
- 29.Sherry B, Tekamp-Olson P, Gallegos C, et al. Resolution of the two components of macrophage inflammatory protein 1, and cloning and characterization of one of those components, macrophage inflammatory protein 1 beta. J Exp Med. 1988;168:2251–9. doi: 10.1084/jem.168.6.2251. [DOI] [PMC free article] [PubMed] [Google Scholar]
- 30.Harris J, De Haro SA, Master SS, et al. T Helper 2 cytokines inhibit autophagic control of intracellular Mycobacterium tuberculosis. Immunity. 2007;27:505–17. doi: 10.1016/j.immuni.2007.07.022. [DOI] [PubMed] [Google Scholar]
- 31.Wynn TA. IL-13 effector functions. Annu Rev Immunol. 2003;21:425–56. doi: 10.1146/annurev.immunol.21.120601.141142. [DOI] [PubMed] [Google Scholar]
- 32.Zhou W, Hashimoto K, Moore ML, et al. IL-13 is associated with reduced illness and replication in primary respiratory syncytial virus infection in the mouse. Microbes Infect. 2006;8:2880–9. doi: 10.1016/j.micinf.2006.09.007. [DOI] [PMC free article] [PubMed] [Google Scholar]
- 33.Schoenberger SP, Toes REM, van der Voort EIH, Offringa R, Melief CJM. T-cell help for cytotoxic T lymphocytes is mediated by CD 40-CD40L interactions. Nature. 1998;393:480–3. doi: 10.1038/31002. [DOI] [PubMed] [Google Scholar]
- 34.Grewal IS, Flavell RA. CD40 and CD154 in cell-mediated immunity. Annu Rev Immunol. 1998;16:111–35. doi: 10.1146/annurev.immunol.16.1.111. [DOI] [PubMed] [Google Scholar]
- 35.van Kooten C, Banchereau J. CD40-CD40 ligand. J Leukoc Biol. 2000;67:2–17. doi: 10.1002/jlb.67.1.2. [DOI] [PubMed] [Google Scholar]
- 36.Danese S, Katz JA, Saibeni S, et al. Activated platelets are the source of elevated levels of soluble CD40 ligand in the circulation of inflammatory bowel disease patients. Gut. 2003;52:1435–41. doi: 10.1136/gut.52.10.1435. [DOI] [PMC free article] [PubMed] [Google Scholar]
- 37.Schönbeck U, Libby P. The CD40/CD154 receptor/ligand dyad. Cell Mol Life Sci. 2001;58:4–43. doi: 10.1007/PL00000776. [DOI] [PMC free article] [PubMed] [Google Scholar]
- 38.Vanichakarn P, Blair P, Wu C, Freedman JE, Chakrabarti S. Neutrophil CD40 enhances platelet-mediated inflammation. Thromb Res. 2008;122:346–58. doi: 10.1016/j.thromres.2007.12.019. [DOI] [PubMed] [Google Scholar]
- 39.Yamauchi PS, Bleharski JR, Uyemura K, et al. A role for CD40–CD40 ligand interactions in the generation of type 1 cytokine responses in human leprosy. J Immunol. 2000;165:1506–12. doi: 10.4049/jimmunol.165.3.1506. [DOI] [PubMed] [Google Scholar]
- 40.Campbell KA, Ovendale PJ, Kennedy MK, Fanslow WC, Reed SG, Maliszewski CR. CD40 ligand is required for protective cell-mediated immunity to Leishmania major. Immunity. 1996;4:283–9. doi: 10.1016/s1074-7613(00)80436-7. [DOI] [PubMed] [Google Scholar]
- 41.Florido M, Goncalves AS, Gomes MS, Appelberg R. CD40 is required for the optimal induction of protective immunity to Mycobacterium avium. Immunology. 2004;111:323–7. doi: 10.1111/j.1365-2567.2004.01812.x. [DOI] [PMC free article] [PubMed] [Google Scholar]
- 42.Noelle RJ. CD40 and its ligand in host defense. Immunity. 1996;4:415–19. doi: 10.1016/s1074-7613(00)80408-2. [DOI] [PubMed] [Google Scholar]
- 43.Samten B, Thomas EK, Gong J, Barnes PF. Depressed CD40 ligand expression contributes to reduced gamma interferon production in human tuberculosis. Infect Immun. 2000;68:3002–6. doi: 10.1128/iai.68.5.3002-3006.2000. [DOI] [PMC free article] [PubMed] [Google Scholar]
- 44.Samten B, Wizel B, Shams H, et al. CD40 ligand trimer enhances the response of CD8+ T cells to Mycobacterium tuberculosis. J Immunol. 2003;170:3180–6. doi: 10.4049/jimmunol.170.6.3180. [DOI] [PubMed] [Google Scholar]
- 45.Serbina NV, Jia T, Hohl TM, Pamer EG. Monocyte-mediated defense against microbial pathogens. Annu Rev Immunol. 2008;26:221–52. doi: 10.1146/annurev.immunol.26.021607.090326. [DOI] [PMC free article] [PubMed] [Google Scholar]
- 46.Majumder N, Bhattacharjee S, Bhattacharyya Majumdar S, et al. Restoration of impaired free radical generation and proinflammatory cytokines by MCP-1 in mycobacterial pathogenesis. Scand J Immunol. 2008;67:329–39. doi: 10.1111/j.1365-3083.2008.02070.x. [DOI] [PubMed] [Google Scholar]
- 47.Lin Y, Gong J, Zhang M, Xue W, Barnes PF. Production of monocyte chemoattractant protein 1 in tuberculosis patients. Infect.Immun. 1998;66:2319–22. doi: 10.1128/iai.66.5.2319-2322.1998. [DOI] [PMC free article] [PubMed] [Google Scholar]
- 48.Rutledge BJ, Rayburn H, Rosenberg R, et al. High level monocyte chemoattractant protein-1 expression in transgenic mice increases their susceptibility to intracellular pathogens. J Immunol. 1995;155:4838–43. [PubMed] [Google Scholar]
- 49.Flores-Villanueva PO, Ruiz-Morales JA, Song CH, et al. A functional promoter polymorphism in monocyte chemoattractant protein-1 is associated with increased susceptibility to pulmonary tuberculosis. J Exp Med. 2005;202:1649–58. doi: 10.1084/jem.20050126. [DOI] [PMC free article] [PubMed] [Google Scholar]
- 50.Martin TR. Lung cytokines and ARDS: Roger S. Mitchell Lecture. Chest. 1999;116:2S–8S. doi: 10.1378/chest.116.suppl_1.2s. [DOI] [PubMed] [Google Scholar]
- 51.Goodman RB, Strieter RM, Martin DP, et al. Inflammatory cytokines in patients with persistence of the acute respiratory distress syndrome. Am J Respir Crit Care Med. 1996;154:602–11. doi: 10.1164/ajrccm.154.3.8810593. [DOI] [PubMed] [Google Scholar]
- 52.Husain N, Awasthi S, Haris M, Gupta RK, Husain M. Vascular endothelial growth factor as a marker of disease activity in neurotuberculosis. J Infect. 2008;56:114–19. doi: 10.1016/j.jinf.2007.11.004. [DOI] [PubMed] [Google Scholar]
- 53.Matsuyama W, Hashiguchi T, Matsumuro K, Iwami F, Hirotsu Y, Kawabata M, Arimura K, Osame M. Increased serum level of vascular endothelial growth factor in pulmonary tuberculosis. Am J Respir Crit Care Med. 2000;162:1120–2. doi: 10.1164/ajrccm.162.3.9911010. [DOI] [PubMed] [Google Scholar]
- 54.Alatas F, Alatas O, Metintas M, Ozarslan A, Erginel S, Yildirim H. Vascular endothelial growth factor levels in active pulmonary tuberculosis. Chest. 2004;125:2156–9. doi: 10.1378/chest.125.6.2156. [DOI] [PubMed] [Google Scholar]
- 55.Bannerman DD, Paape MJ, Chockalingam A. Staphylococcus aureus intramammary infection elicits increased production of transforming growth factor-[alpha], [beta]1, and [beta]2. Vet Immunol Immunopathol. 2006;112:309–15. doi: 10.1016/j.vetimm.2006.03.018. [DOI] [PubMed] [Google Scholar]
- 56.Maitre B, Boussat S, Jean D, et al. Vascular endothelial growth factor synthesis in the acute phase of experimental and clinical lung injury. Eur Respir J. 2001;18:100–6. doi: 10.1183/09031936.01.00074701. [DOI] [PubMed] [Google Scholar]
- 57.Dehio C. Recent progress in understanding Bartonella-induced vascular proliferation. Curr Opin Microbiol. 2003;6:61–5. doi: 10.1016/s1369-5274(03)00006-7. [DOI] [PubMed] [Google Scholar]
- 58.Vankayalapati R, Klucar P, Wizel B, et al. NK cells regulate CD8+ T cell effector function in response to an intracellular pathogen. J Immunol. 2004;172:130–7. doi: 10.4049/jimmunol.172.1.130. [DOI] [PubMed] [Google Scholar]
- 59.Ohteki T. Critical role for IL-15 in innate immunity. Curr Mol Med. 2002;2:371–80. doi: 10.2174/1566524023362519. [DOI] [PubMed] [Google Scholar]