Abstract
We investigated the effect of nanoscale topography on neurite development in pheochromocytoma (PC12 cells) by culturing the cells on substrates having nanoscale pillars and pores with sizes comparable with filipodia. We found that cells on nanopillars and nanopores developed fewer and shorter neurites than cells on smooth substrates, and that cells on nanopores developed more and longer neurites than cells on nanopillars. These results suggest that PC12 cells were spatially aware of the difference in the nanoscale structures of the underlying substrates and responded differently in their neurite extension. This finding points to the possibility of using nanoscale topographic features to control neurite development in neurons.
Keywords: nanopillars, nanopores, substrates, neurite extension, PC12 cells
Introduction
Cells in vivo are exposed to basal membranes that have topographic features in the micron and submicron ranges (Abrams, Goodman, et al 2000; Abrams, Schaus, et al 2000; Abrams et al 2002). Nanoscale pores, fibers, and ridges of the basal membranes present 3D topographical features that provide biophysical cues to the overlying cells (Abrams, Goodman, et al 2000; Abrams, Schaus, et al 2000; Abrams et al 2002). Even though the topography of the basal membranes has been characterized, their influence on cellular activities in vivo is not well understood. Cellular response to nanoscale substrate topography has been investigated using various topographic patterns (Andersson, Olsson et al 2003; Dalby, Riehle, et al 2002; Dalby, Yarwood, et al 2002; Rice et al 2003; Riehle et al 2003; Dalby, Gadegaard, et al 2004), biomaterials (Dalby, Riehle, et al 2002; Dalby et al 2003), and cell lines (Rice et al 2003; Miller et al 2004). Studies have shown that nanoscale cellular structures such as filopodia and integrins interact with the underlying topography of the substrate and affect cellular activities such as cell shape and spreading, cell adhesion, differentiation, proliferation and gene expression (Goldberg and Burmeister 1986; Polinsky et al 2000; Dalby, Gadegaard et al 2004; Dalby, Yarwood, et al 2002). Hence, the topography of the substrate upon which cells are cultured may be used to control and regulate specific cellular function and activity.
Cells have exhibited some unique responses to nano-featured substrates. For example in one study, human fibroblasts responded to arrays of nano-islands of 13 nm in height, 263 nm in diameter, and 527 nm in spacing with changes in gene regulation associated with cell signaling, proliferation, cytoskeleton, and proliferation of extracellular matrix proteins (Dalby, Yarwood, et al 2002). In another study, human fibroblasts cultured on arrays of columns of 160 nm in height and 100 nm in diameter showed decreased cell adhesion and spreading as compared with smooth substrates (Dalby et al 2005). Similarly, rat pancreatic epithelial cells exhibited decreased cell spreading with decreasing column diameter from 166 nm, 111 nm, 91 nm to 58 nm (Andersson, Bäckhed, et al 2003). Human osteoblasts cultured on porous anodized alumina with a 200 nm pore diameter showed a flattened morphology with filopodia attached to the pores (Karlsson et al 2003). Human umbilical vein endothelial cells showed good cell adhesion and proliferation on substrates with a 300 nm pore diameter but had reduced cell adhesion, restricted cell spreading, and limited proliferation on substrates with a 7 μm pore diameter (Kwon et al 2005).
In a previous study (Haq et al 2005), we showed that PC12 cells developed short neurites, numerous filopodia extensions, and high cell numbers on arrays of nanopillars of 103 nm in diameter and 131 nm in spacing compared with cells on smooth substrates. However, PC12 cells on substrates with arrays of micro-islands of 15 μm in diameter and 30 μm in spacing developed longer neurites, fewer filopodia, and lower cell numbers as compared with cells on smooth substrates. In this study we intend to investigate the effect of nanopillars and nanopores on neurite development in a parallel manner. Specifically, we want to know what will happen to neurite extension if the PC12 cells are exposed to nanopillars and nanopores having dimensions comparable with but slightly larger than that of filopodia (~100–150 nm). We hope that such a controlled study of neuronal responses to nanostructured topographies could shed some insights into using nanopillar or nanopore substrates for investigating the electrophysiological activities of neurons, using nanopore substrates as a vehicle for targeted drug delivery to neuronal cells, or using nanopillar substrates as electrodes for electrochemical and biomechanical sensing of cell-matrix interactions.
Materials and methods
Two types of nanostructured substrates were used in this study – nanopillars and nanopores, along with two smooth substrates – coated coverslips and bare coverslips as controls. For the nanopillar substrates, arrays of standing gold nano-pillars of 200 nm in diameter, 70 nm in spacing and 2 μm in height were fabricated using an electrodeposition technique. The details of the electrodeposition can be found elsewhere (Anandan et al 2006). Briefly, a thin layer of gold of about 150 nm was sputter-coated onto one side of a porous anodic alumina (PAA) disc (Whatman Inc, Middlesex, England) to provide a conductive layer. Gold was electrodeposited galvanostatically at 5 mA/cm2 in OROTEMP24 gold plating solution (Cranston, RI) through the open pores of the PAA disc for 3 minutes. After that the PAA disc was removed by dissolving it in a 2.0M NaOH solution to obtain a thin film structure with arrays of nanopillars. For the nanopore substrates, commercial PAA discs of 25 mm in diameter with a nanopore size of 200 nm were used. The PAA discs were coated with a thin layer of gold (50 nm) in a vacuum evaporator (BOC Edwards, Wilmington MA) to give them the same surface material as the nanopillars. For the two smooth substrates (coated and bare coverslips) 25 mm diameter coverslips coated with a thin layer of gold (50 nm) and noncoated coverslips were prepared to serve as two controls.
All the substrates were first sterilized in 95% ethanol for 30 minutes. For promoting cell adhesion on these gold-coated substrates, the top surfaces were coated with a self-assembled monolayer (SAM) of cysteamine to provide a thiol group (-SH) for molecular binding to gold surfaces. The thiolized substrates and coverslips were further treated with 0.05% poly-L-lysine (70–150 kD) for four hours followed by two 10-min washes in sterile deionized water to promote cell adhesion by ionic bonding.
A neuron precursor cell line, rat pheochromocytoma PC12, was used to study neurite development on these substrates. PC12 cells were seeded and cultured on these substrates in triplicates at a seeding density of 5,000 (cells/ cm2). Two sets of experiments were prepared: one for scanning electron microscope (SEM) analysis and the other for fluorescent microscopy (FM) analysis. The reason for the FM analysis in addition to the SEM analysis was that it did not entail the dehydration process needed for preparing the cell culture for SEM examination. In our early study we observed signs of cell damage caused by this dehydration process. Thus, the FM analysis was intended to complement the SEM analysis as well as to reveal the development of the structural proteins of actin filaments and microtubules in the developing neurites.
Since PC12 cells differentiate into sympathetic-neurons when exposed to nerve growth factor (NGF) (Greene et al 1998), their differentiation behavior upon NGF exposure was investigated. Cells were maintained in RPMI-1640 culture medium (Sigma-Aldrich, St. Louis, MO) supplemented with 10% horse serum (JRH Biosciences, Lenexa, KS), 5% fetal calf serum (Atlanta Biological, Norcross, GA), and 2% v/v penicillin (Sigma-Aldrich). 100 ng/ml NGF (Alomone Laboratories, Jerusalem, Israel) was added to elicit neurite growth in all cultures. Cell cultures were maintained at 37°C in a humidified atmosphere of 5% CO2/95% air for four days. NGF was added at the time of cell plating and at the 48th hour when the culture medium was changed.
For the SEM analysis, after four days of culture the cells were fixed in 0.25% glutaraldehyde and 4% formaldehyde. Quantitative characterization of neurite development was performed using SEM (LEO 982 FESEM, Leo Electron Microscopy Inc., Thornwood, NY). To prepare biological specimens for SEM analysis, cells on substrates were immersed in 1% osmium tetraoxide (OsO4) for 15 minutes, washed in buffered solution, and dehydrated by successive immersion in 10%, 30%, 50%, 70%, 90%, and 100% ethanol for five minutes each. Subsequently, cells with substrates were dried in a critical point drier (Samdri model 780-A, Tousimis Research, Rockville, MD). A thin layer of gold (about 7 nm) was then sputter-coated (Structure Probe Inc., West Chester, PA) on the cells to prepare conductive samples. Quantitative characterization of the cellular morphology (neurite length and neurite density) for PC12 cells on the gold nanopillars and nanopores as well as on the smooth gold coated and bare coverslips was performed based on the SEM images.
For the FM analysis, after four days of culture cells were fixed in 3.7% formaldehyde for 30 minutes in the dark and co-stained for F-actin and microtubules specific antibodies. The fixed cells were then washed twice in phosphate buffer solution (PBS) and then treated with a 0.1% Triton X-100 in PBS for 10 min (to permeabilize the cell membrane) followed by two PBS washes. The permeabilized cells were then stained for actin with rhodamine phallodin (Sigma-Aldrich) and α-tubulin with anti-tubulin (DM1a, Sigma-Aldrich) by diluting the antibodies at 1:200 and 1:100 in PBS, respectively. The stained cultures were then swirled to evenly distribute the contents and kept in the dark at room temperature for 20 min (for incubating the antibodies). The cultures were then washed again twice in PBS and the microtubule specific secondary antibody, fluorescein isothiocyanate (FITC) goat anti-mouse antibody (Sigma-Aldrich) diluted at 1:100 in PBS was added to the cultures. The cultures were swirled and kept in the dark at room temperature for 30 min to incubate the secondary antibody. The stained cells on the substrates were then prepared for fluorescent microscopy analysis by covering them with another coverslip using a 1:1 mounting solution of PBS and glycerol. The coverslips were sealed with paraffin to prevent desiccation of the mounted cells. The cells were examined under an upright fluorescence microscope (Zeiss Axioskop 40, Carl Zeiss Inc., Thornwood, NY). The stained tubulin and actin were observed using fluorescein (488 nm excitation and 510–520 nm emission wavelength) and rhodamine (546 nm excitation and 560–580 nm emission wavelength) respectively. Quantitative characterization of the neurite morphology (neurite length, and neurite density) for PC12 cells in all experimental groups was performed based on the FM images.
For quantitative analysis of cell development, cell density in all experimental setups was enumerated using an areal count method in conjunction with trypan blue (Erythrosin B, Nigrosin) solution to count viable cells. The number of cells in three randomly chosen microscopic fields (with identical surface area) in each replicate was enumerated for each substrate type using an inverted light microscope (Nikon Eclipse ME600, Nikon Inc., Melville, NY). To quantify the neurite development, the neurite length and neurite density (number of neurites per cell) of PC12 cells on all types of substrates were measured. A total of 60 cells were counted in each group (20 from each replicate). Manual tracing method was used to measure the neurite length. To do so the length of the scale bar specifying the scale (in microns) of the field-of-view was first measured in millimeters using a ruler and the corresponding conversion factor was determined. Then the respective neurite lengths were measured in millimeters and converted back to microns using the calculated conversion factor. Neurite lengths were measured from their base along the usually curved neurites to the tips of the leading edge of growth cones. Neurite density was counted as the number of neurites extending from a single cell body.
For assuring a high cell plating efficiency, prior to these studies, a separate plating efficiency study was performed using the same procedure as described elsewhere (Haq et al 2005). The ratio of the adhered viable cells to the plated cells at 6-h after plating was calculated. The mean plating efficiency was found to be 83.4 ± 6.6%, 85.8 ± 6.1%, 86.9 ± 7.3% and 90.1 ± 7.6% for cells on nanopillars, nanopores, gold-coated coverslips, and bare coverslips, respectively, and there was no significant difference in the plating efficiency between different types of substrates.
Statistical means and standard errors for the neurite length, neurite density, and cell density were calculated. For both the SEM and FM analyses, one-way analysis of variance (ANOVA) was performed to determine the statistical differences between different substrates in terms of neurite length, neurite density and cell density. A p-value of less than 0.05 was considered to be significantly different.
Results
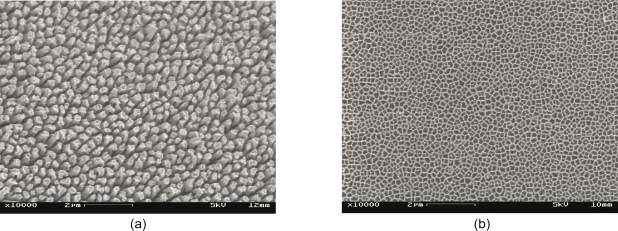
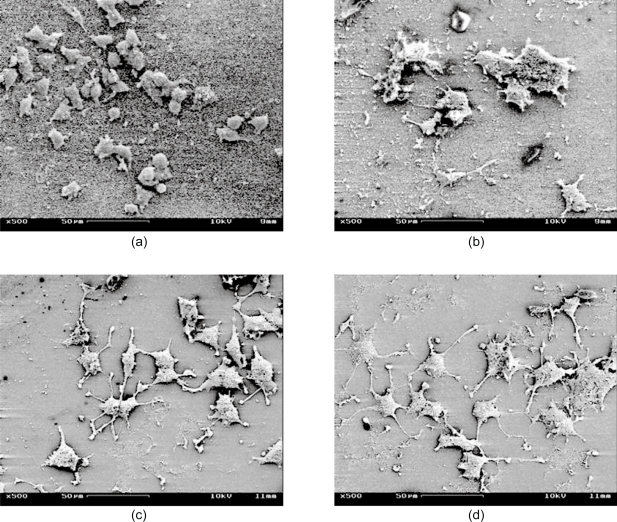
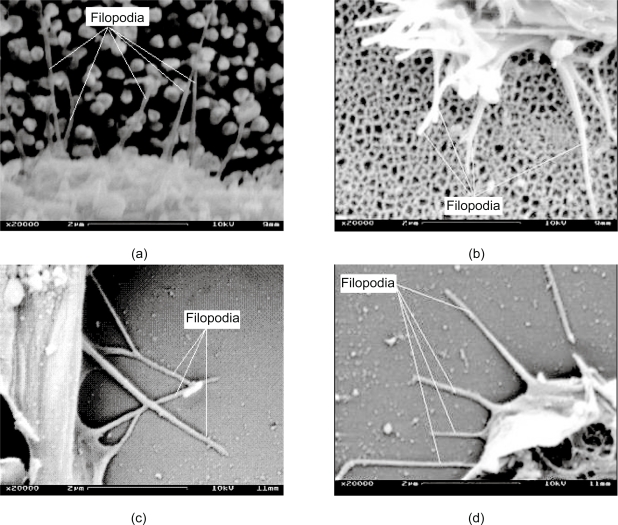
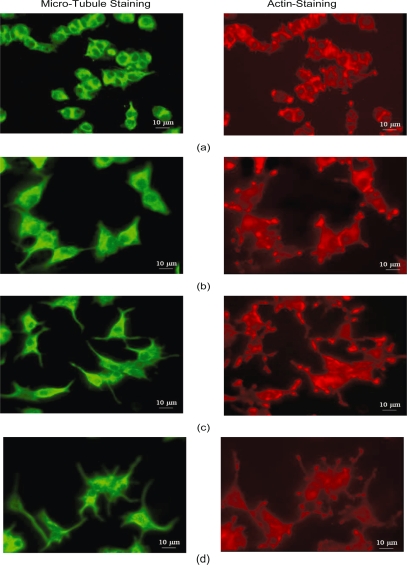
Figure 1 shows two SEM images of the nanopillar (Figure 1a) and nanopore (Figure 1b) substrates. These nanopillars had dimensions of 229 ± 28 nm in diameter, 69 ± 32 nm in spacing and 2123 ± 84 nm in height, and these nanopores had dimensions of 206 ± 42 nm in diameter and 41 ± 17 nm in spacing. The pores are through holes approximately 35 μm deep. Figure 2 shows four SEM images of PC12 cells cultured on four different types of substrates: Figure 2a shows a dense culture of cells on nanopillars with short and few neurites, Figure 2b shows cells cultured on nanopores with intermediate length and number of neurites, and Figure 2c and Figure 2d show cells on gold-coated and bare coverslips with long and multiple neurites. Figure 3 shows four SEM images at a higher magnification of cells on different types of substrates. In cells on nanopillars (Figure 3a) the filopodia tightly clung to the nanopillars, while in cells on the nanopore and smooth substrates (Figures 3b–3d) the filopodia seemed extended out in a more relaxed manner. Figure 4 shows the fluorescent images of the actin and microtubule co-staining in PC12 cells on four different types of substrates. Cells cultured on nano-pillars (Figure 4a) had short and few neurites per cell, while cells cultured on nanopores (Figure 4b) had neurites with intermediate lengths and numbers. Cells cultured on gold-coated (Figure 4c) and bare coverslips (Figure 4d) had long and multiple neurites. Also, in cells on nanopillars (Figure 4a) more actin-rich stains (indicating the presence of filopodia) were found cluttered at the edges of more rounded cells, while in cells on nanopores (Figure 4b) the actin-rich stains were scattered at several extending points of more spread cells. In cells on smooth substrates (Figures 4c and 4d), however, the actin-rich stains were present at the leading tips of the developing neurites of fully spread cells.
Figure 1.
SEM images show top-view of the nanostructured substrates with nanopillars (a) and nanopores (b).
Abbreviations: SEM, scanning electron microscope.
Figure 2.
SEM images of cells: (a) on nanopillars – cells with short and few neurites and a relatively high cell density, (b) on nanopores – cells with intermediate neurites, (c) on gold coated coverslips – cells with long and multiple neurites, (d) on bare coverslips – cells with long and multiple neurites.
Abbreviations: SEM, scanning electron microscope.
Figure 3.
SEM images at a higher magnification of cells cultured on various substrates. Filopodia clung tightly to the nanopillars (a), while they extended out in a relaxed manner on nanopores (b), gold coated coverslips (c) and bare coverslips (d).
Abbreviations: SEM, scanning electron microscope.
Figure 4.
Fluorescent images of cells: on nanopillars (a), nanopores (b), gold coated coverslips (c) and bare coverslips (d).
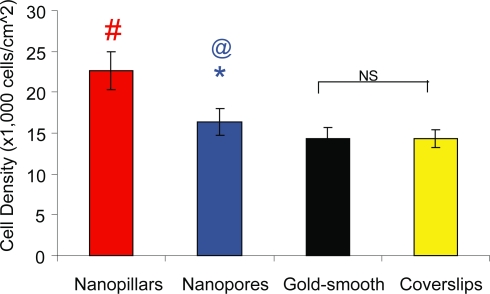
Figure 5 depicts the mean cell density obtained by pooling together the measurements from both the SEM and FM analyses (note that 18 measurements were used from 3 randomly chosen fields, 3 replicates and 2 analysis types). The mean cell density was 22.6 ± 2.3, 16.3 ± 1.6, 14.3 ± 1.4 and 14.3 ± 1.2 (×103-cells/cm2) for cells on nanopillars, nanopores, gold-coated and bare coverslips, respectively. Cells on nanopillars (#p < 0.05) and nanopores (*p < 0.05) had a significantly higher cell density than cells on smooth substrates. Cells on nanopores (@p < 0.05) had a significantly lower cell density than cells on nanopillars. There was no significant difference in cell density between cells on gold coated and bare coverslips.
Figure 5.
Bar graph depicts the mean cell density measured from cells on different types of substrates. Values reported are mean ± standard error; n = 18; #p < 0.05 (nano-pillars compared with smooth controls); *p < 0.05 (nanopores compared with smooth controls); @p < 0.05 (nanopillars compared with nanopores).
Abbreviations: NS, not significant.
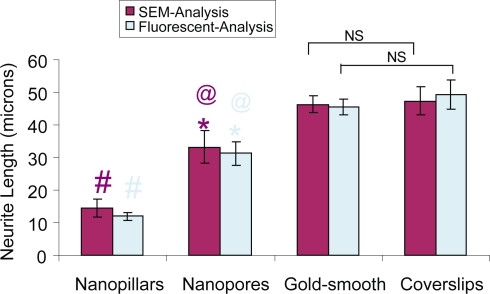
Figure 6 shows the measured mean neurite length in the SEM analysis: 14.5 ± 2.8 μm, 33.2 ± 5.0 μm, 46.3 ± 2.5 μm, and 47.4 ± 4.3 μm for cells on nanopillars, nanopores, gold-coated and bare coverslips, respectively. The mean neurite lengths measured in the FM analysis were not significantly different from their SEM counterparts. In both the SEM and FM analyses, cells on nanopillars (#p < 0.05) and nanopores (*p < 0.05) had significantly shorter neurites than cells on smooth coverslips, cells on nanopores (@p < 0.05) had significantly longer neurites than cells on nanopillars, and there was no significant difference in the mean neuirte length between the cells on gold-coated and bare coverslips.
Figure 6.
Bar graph shows the mean neurite length obtained from cells on different types of substrates. Values reported are mean ± standard error; n = 60; #p < 0.05 (nanopillars compared with smooth controls); *p < 0.05 (nanopores compared with smooth controls); @p < 0.05 (nanopillars compared with nanopores).
Abbreviations: NS, not significant.
Figure 7 shows that the mean neurite density in the SEM analysis was 2.3 ± 0.1, 3.8 ± 0.2, 4.3 ± 0.1 and 4.4 ± 0.1 (neurites/cell) for cells on nanopillars, nanopores, gold-coated and bare coverslips, respectively. The mean neurite densities measured in the FM analysis were not significantly different from their SEM counterparts. Again, in both the SEM and FM analyses, cells on nanopillars (#p < 0.05) and nanopores (*p < 0.05) had significantly fewer neurites per cell than cells on smooth coverslips, cells on nanopores (@p < 0.05) had significantly more neurites per cell than cells on nanopillars, and there was no significant difference in the number of neurites per cell between the cells on gold-coated coverslips and bare coverslips.
Figure 7.
Bar graph shows the mean neurite density measured from cells on different types of substrates. Values reported are mean ± standard error; n = 60; #p <0.05 (nanopillars compared with smooth controls); *p <0.05 (nanopores compared with smooth controls); @p <0.05 (nanopillars compared with nanopores).
Abbreviations: NS, not significant.
Discussion
In this study, we investigated the effect of nanopillars and nanopores with dimensions comparable with but slightly larger than that of filopodia on neurite extension in PC12 cells. Cells cultured under the identical culturing condition on different types of substrates exhibited different cell development. On nanopillars, cells had a higher density and shorter neurite extension, while on nanopores cells had a lower density and intermediate neurite extension. As discussed previously (Haq et al 2005), the outgrowth of neurites is the result of differentiation activity and the increase in cell counts proliferation activity, thus it is logical to see that the highly populated cells developed shorter neurites. It is unlikely, however, that the less neurite outgrowth in these cells is attributed to the fact that short neurites are required to establish cell-cell contacts because all the cells on nanopillar substrates behaved the same no matter how far they land from their neighbors. Thus the obtained result indicates that the nanopillars with slightly larger diameters and separations than that of filopodia restricted the mobility of filopodia and growth cones, which is necessary for guiding the neurite outgrowth. A recent study by Arnold and colleagues (2004) showed that the spacing between the nanodots (<8 nm in diameter) coated with cyclic RGDfK peptide for promoting molecular binding influenced the integrin activation for cell spreading and adhesion. A separation greater than 73 nm between the binding nanodots resulted in limited cell spreading and attachment, and reduced the formation of focal adhesion and actin stress-fibers in various cells including MC3T3, REF52, and 3T3 fibroblasts. For achieving good cell adhesion, it seemed necessary to have a cluster of bound integrins that are spaced no more than 58 nm in between the binding sites. These findings may explain why cells were not well spread on nanopillar substrates having a spacing of about 70 nm in between nanopillars.
The nanopore substrates did not seem to pose the same restriction as did the nanopillars to the mobility of the filo-podia and growth cones, thus an intermediate level of neurite extension was observed. This result may be attributed to the connected ridge network of the underlying substrates that permit the formation of integrin clustering and binding at desired distances. A similar trend was observed in neurite extension in cells on different types of substrates when comparing between the SEM and FM analyses. By contrast, cells on the gold-coated and bare coverslips develope d numerous and long extended neurites.
The difference in neurite extension seen in cells cultured on smooth and nanostructured substrates is clearly a sign that nanoscale topographic features influenced the neurite outgrowth activities. Under the same culturing condition, while cells on smooth substrates showed extensive neurite outgrowth, cells on nanopillars or nanopores had inhibited or limited neurite outgrowth. We believe that in the case of nanopillars the void-spaces between the vertically aligned nanopillars may be responsible for causing difficulty to the mobility of filopodia and growth cones for guiding neurite outgrowth, while in the case of nanopores the connected ridges still provide some support, albeit limited, for the movement of the filopodia and growth cones. Others have also reported that neuronal cells cultured on nano-structured substrates showed different cell morphology and neurite development as compared with smooth substrates. With PC12 cells cultured on ridges with widths in the nanoscale (70 nm to 1900 nm), Foley and colleagues (2005) observed a similar neurite development. The grooves and ridges constrained the number of neurites that the cells could extend, thus leading to a bipolar rather than branching phenotype typical of these cells when cultured on flat surfaces.
Conclusion
Nanostructured substrates such as nanopillars and nanopores with dimensions comparable with but slightly larger than that of filopodia inhibited or limited neurite outgrowth in PC12 cells when compared with smooth substrates. Nanopillars had a greater inhibiting effect on neurite outgrowth than nanopores. These findings may suggest the use of substrates with nanoscale features for controlling neurite development in neuronal cells.
Acknowledgments
This work was supported by National Science Foundation (ECS-0304340) and University of Georgia Research Foundation through an engineering grant.
References
- Abrams GA, Bentley E, Nealey PF, et al. Electron microscopy of the canine corneal basement membranes. Cells Tissues Organs. 2002;170:251–7. doi: 10.1159/000047929. [DOI] [PubMed] [Google Scholar]
- Abrams GA, Goodman SL, Nealey PF, et al. Nanoscale topography of the basement membrane underlying corneal epithelium of the Rhesus Macaque. Cell Tissue Res. 2000;299:39–46. doi: 10.1007/s004419900074. [DOI] [PubMed] [Google Scholar]
- Abrams GA, Schaus SS, Goodman SL, et al. Nanoscale topography of the corneal epithelial basement membrane and Descemet’s membrane of the human. Cornea. 2000;19:57–64. doi: 10.1097/00003226-200001000-00012. [DOI] [PubMed] [Google Scholar]
- Anandan V, Rao YL, Zhang G. Nanopillar array structures for enhancing biosensing performance. Int J Nanomed. 2006;1:73–9. doi: 10.2147/nano.2006.1.1.73. [DOI] [PMC free article] [PubMed] [Google Scholar]
- Andersson AS, Bäckhed F, Euler A, et al. Nanoscale features influence epithelial cell morphology and cytokine production. J Biomaterials. 2003;24:3427–36. doi: 10.1016/s0142-9612(03)00208-4. [DOI] [PubMed] [Google Scholar]
- Andersson AS, Olsson P, Lidberg U, et al. The effects of continuous and discontinuous groove edges on cell shape and alignment. Exp Cell Res. 2003;288:177–88. doi: 10.1016/s0014-4827(03)00159-9. [DOI] [PubMed] [Google Scholar]
- Arnold M, Cavalcanti AE, Glass R, et al. Activation of integrin function by nanopatterned adhesive interfaces. Chemphyschem. 2004;5:383–8. doi: 10.1002/cphc.200301014. [DOI] [PubMed] [Google Scholar]
- Dalby MJ, Gadegaard N, Riehle MO, et al. Investigating filopodia sensing using arrays of defined nano-pits down to 35 nm diameter in size. Int J Biochem Cell Biol. 2004;36:2005–15. doi: 10.1016/j.biocel.2004.03.001. [DOI] [PubMed] [Google Scholar]
- Dalby MJ, Riehle MO, Johnstone HJH, et al. Polymer demixed nanotopography: control of fibroblast spreading and proliferation. Tissue Engin. 2002;8:1099–108. doi: 10.1089/107632702320934191. [DOI] [PubMed] [Google Scholar]
- Dalby MJ, Riehle MO, Johnstone HJH, et al. Nonadhesive nanotopography: fibroblast response to poly (n-butyl methacrylate)-poly (styrene) demixed surface features. J Biomed Mater Res. 2003;67A:1025–32. doi: 10.1002/jbm.a.10139. [DOI] [PubMed] [Google Scholar]
- Dalby MJ, Riehle MO, Johnstone HJH, et al. Investigating the limits of filopodial sensing: a brief report using SEM to image the interaction between 10 nm high nanotopography and fibroblast filopodia. Cell Biol Int. 2004;28:229–36. doi: 10.1016/j.cellbi.2003.12.004. [DOI] [PubMed] [Google Scholar]
- Dalby MJ, Riehle MO, Sutherland D, et al. Morphological and micro-array analysis of human fibroblasts cultured on nanocolumns produced by colloidal lithography. J Eur Cells Mater. 2005;9:1–8. doi: 10.22203/ecm.v009a01. [DOI] [PubMed] [Google Scholar]
- Dalby MJ, Yarwood SJ, Riehle MO, et al. Increasing fibroblast response to materials using nanotopography: morphological and genetic measurements of cell response to 13-nm-high polymer demixed islands. Exp Cell Res. 2002;276:1–9. doi: 10.1006/excr.2002.5498. [DOI] [PubMed] [Google Scholar]
- Foley JD, Grunwald EW, Nealey PF, et al. Cooperative modulation of neuritogenesis by PC12 cells by topography and nerve growth factor. Biomaterials. 2005;26:3639–44. doi: 10.1016/j.biomaterials.2004.09.048. [DOI] [PubMed] [Google Scholar]
- Goldberg D, Burmeister D. Stages in axon formation: observations of growth of aplysia axons in culture using video-enhanced contrast-differential interference contrast microscopy. J Cell Biol. 1986;103:1021–31. doi: 10.1083/jcb.103.5.1921. [DOI] [PMC free article] [PubMed] [Google Scholar]
- Greene LA, Farenelli SE, Cunningham ME, et al. Culture and experimental use of PC12 rat pheochromocytoma cell line. In: Banker G, Goslin K, editors. Culturing nerve cells. Cambridge, MA: MIT Pr; 1998. pp. 161–88. [Google Scholar]
- Haq F, Rao YL, Zhang G, et al. Nano and micro structured substrates for neuronal cell development. J Biomed Nanotechnol. 2005;1:313–19. [Google Scholar]
- Karlsson M, Palsgard E, Wilshaw PR, et al. Initial in vitro interaction of osteoblasts with nano-porous alumina. J Biomater. 2003;24:3039–46. doi: 10.1016/s0142-9612(03)00146-7. [DOI] [PubMed] [Google Scholar]
- Kwon K, Kidoaki S, Matsuda T. Electrospun nano- to microfiber fabrics made of biodegradable copolyesters:structural characteristics, mechanical properties and cell adhesion potential. J Biomater. 2005;26:3929–39. doi: 10.1016/j.biomaterials.2004.10.007. [DOI] [PubMed] [Google Scholar]
- Miller DC, Thapa A, Haberstroh KM, et al. Endothelial and vascular smooth muscle cell function on poly (lactic-co-glycolic acid) with nano-structured surface features. J Biomater. 2004;25:53–61. doi: 10.1016/s0142-9612(03)00471-x. [DOI] [PubMed] [Google Scholar]
- Polinsky M, Balazovich K, Tosney KW. Identification of an invariant response: stable contact with schwann cells induces veil extension in sensory growth cones. J Neurosci. 2000;20:1044–55. doi: 10.1523/JNEUROSCI.20-03-01044.2000. [DOI] [PMC free article] [PubMed] [Google Scholar]
- Rice JM, Hunt JA, Gallagher JA, et al. Quantitative assessment of the response of primary derived human osteoblasts and macrophages to a range of nanotopography surfaces in a single culture model in vitro. J Biomaterials. 2003;24:4799–818. doi: 10.1016/s0142-9612(03)00381-8. [DOI] [PubMed] [Google Scholar]
- Riehle MO, Dalby MJ, Johnstone HJH, et al. Cell behavior of rat calvaria bone cells on surfaces with random nanometric features. J Mater Sci Eng C. 2003;23:337–40. [Google Scholar]


