Abstract
In optical imaging experiments, it is often advantageous to map the field of view and to converge the eyes without electrophysiological recording. This occurs when limited space precludes placement of an electrode or in chronic optical chambers in which one may not want to introduce an electrode each session or for determining eye position in studies of ocular disparity response in visual cortex of anesthetized animals. For these purposes, we have developed a spot imaging method that can be conducted rapidly and repeatedly throughout an experiment. Using small 0.2° – 0.5° spots, the extent of the imaged field of view is mapped by imaging cortical response to single spots, placed at different positions (0.2° steps) in either the horizontal or vertical axes. By shifting the relative positions of two spots, one presented to each eye, eye convergence can be assessed to within 0.1° resolution. Once appropriate eye alignment is determined, stimuli for further optical imaging procedures (e.g. imaging random dot stimuli for study of disparity responses) can then be confidently placed. This procedure can be quickly repeated throughout the experiment to ensure maintained eye alignment.
Keywords: disparity, spot imaging, point spread, topography, mapping, primary visual cortex
Introduction
In animals under anesthesia, the two eyes are often not aligned and may drift over time, even under general paralysis. This presents difficulties for vision studies in anesthetized animals, since the ability to determine and control the precise position of eyes are non-trivial issues. These issues become even more critical in experiments involving binocular aspects of vision (e.g. studies of ocular disparity response, see Chen et al. 2008), as the positions of the eyes need to be precisely determined and spontaneous eye movements need to be minimized. In previous electrophysiological studies, ocular alignment was achieved by recording binocular units in visual cortex and aligning the receptive fields (RFs) recorded through each eye via prisms placed in front of each eye (e.g. Hubel and Livingstone, 1987; Roe and Ts’o, 1995). In addition, in some studies the use of eye rings has been used to help stabilize the eyes (Allman and Kaas, 1971).
In optical imaging studies, performing simultaneous electrophysiological recording and imaging can pose technical difficulties. For example, it can be difficult to place an electrode concurrent with optical recording due to angle of the camera relative to the stereotaxic frame or closeness of camera lens to the brain (see Fig. 1). To study disparity response in anesthetized animals with optical imaging methods, it would be advantageous to have the ability to align the eyes and to do so rapidly and repeatedly throughout the imaging sessions. In addition, in animals with chronically implanted optical chambers, it is very useful to non-invasively (without introducing an electrode into the imaging field of view) map the field of view within the chamber. Such a non-invasive mapping method can be used for imaging in anesthetized monkeys and in awake monkeys.
Fig. 1. Proximity of imaging setup to optical chamber.
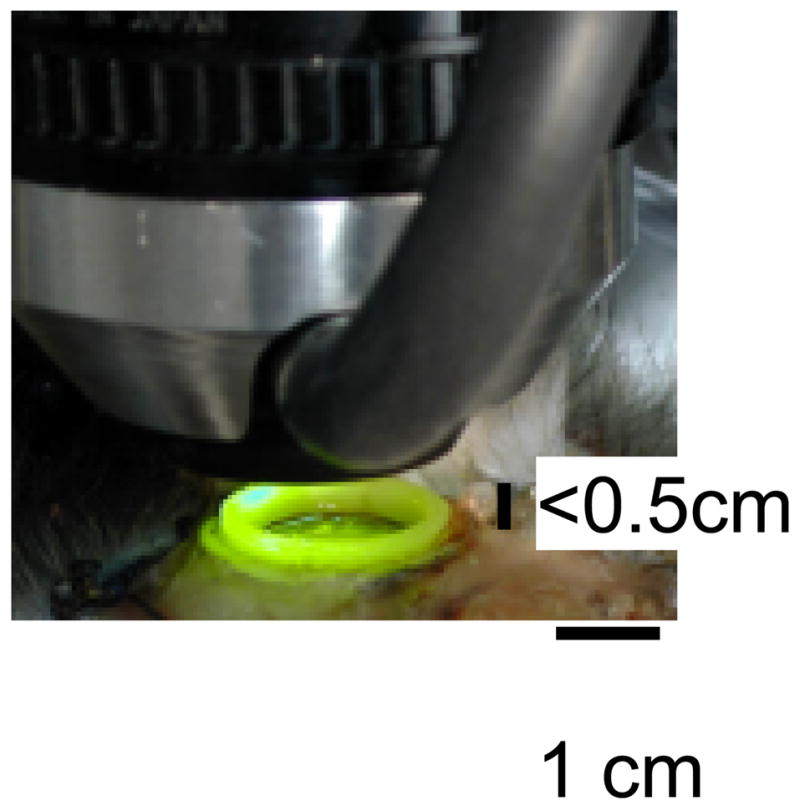
A 50mm/85mm tandem lens with a ring illuminator attached provides 540 nm illumination to the optical chamber. Often, the distance between the imaging chamber and the imaging lens setup is small (<0.5 cm), making placement of microelectrodes difficult. Furthermore, in awake animals or in repeat anesthetized imaging chambers, it is often convenient to be able to record optically without introduction of electrodes into the field of view.
In this paper, we report a rapid spot imaging method. This method is used to ensure proper convergence of the eyes in anesthetized animals and to determine the extent of the visual field represented in the cortical area of study.
Materials and methods
Animal preparation
Four Macaque monkeys (Macaca mulatta) were anesthetized (thiopental sodium, 1 – 2 mg/kg/hr i.v. and isoflurane, 0.2 – 1.5%), paralyzed with vecuronium bromide (0.05 mg/kg/hr i.v.), and artificially ventilated. Anesthetic depth was assessed continuously via implanted wire EEG electrodes, end-tidal CO2, oximetry, heart rate, and by regular testing for response to toe pinch while monitoring heart rate changes. In initial surgery, craniotomy and durotomy were performed to expose visual areas V1 and V2 (near the lunate sulcus at an eccentricity of 3° – 6° from the fovea). In all cases a chronic chamber was implanted (Chen et al., 2008; Chen et al., 2002; Roe, 2007). All surgical and experimental procedures conformed to the guidelines of the National Institute of Health and were approved by the Vanderbilt Animal Care and Use Committees.
Ocular refraction and ocular stability
We refracted the monkey’s eyes following the induction of paralysis. Eyes were dilated (atropine sulfate) and fitted with contact lenses of appropriate curvature to focus on a computer screen. Our refraction procedure was based on both ophthalmic reflection and minimization of receptive field size. We used a set of plano contact lenses of different curvature (45.0 – 64.0 in 0.5 steps, Danker Laboratories Inc, Sarasota, FL). By shining a small bar of light from an ophthalmoscope in the monkey’s eye, we determined whether the image of the bar moves ‘with’ (in front of crossover point) or ‘against’ (behind crossover point) the actual motion of the bar. The lenses were changed (in 0.5 diopter steps) until the crossover point lay at the distance of the monitor. This procedure was conducted for each eye in every experiment. To confirm this refraction, the receptive field of a cortical neuron was plotted and the lenses changed to ensure that the smallest receptive field size is obtained. Typically, in pentothal anesthetized monkeys, at eccentricities of 3° – 5°, well refracted monkeys have V1 receptive field sizes around 0.25°; closer to the fovea these sizes are around 0.125°. Such small receptive field sizes can only be obtained with proper refraction. Thus, we are fairly confident about our refraction methods.
The visual field of view of each eye was then diverged (by placing a Risley prism in front of each eye) to view different halves of the screen in front of the animal (Fig. 2). In some experiments, a binocular V1 cell was isolated and its receptive field plotted through each eye on a tangent screen. To further ensure ocular stability, we used eye rings attached to Kopf manipulators mounted on the stereotaxic frame and which are lightly pressed on to each eye.
Fig. 2. Spot imaging method for determining corresponding eye stimulation positions (ocular alignment).
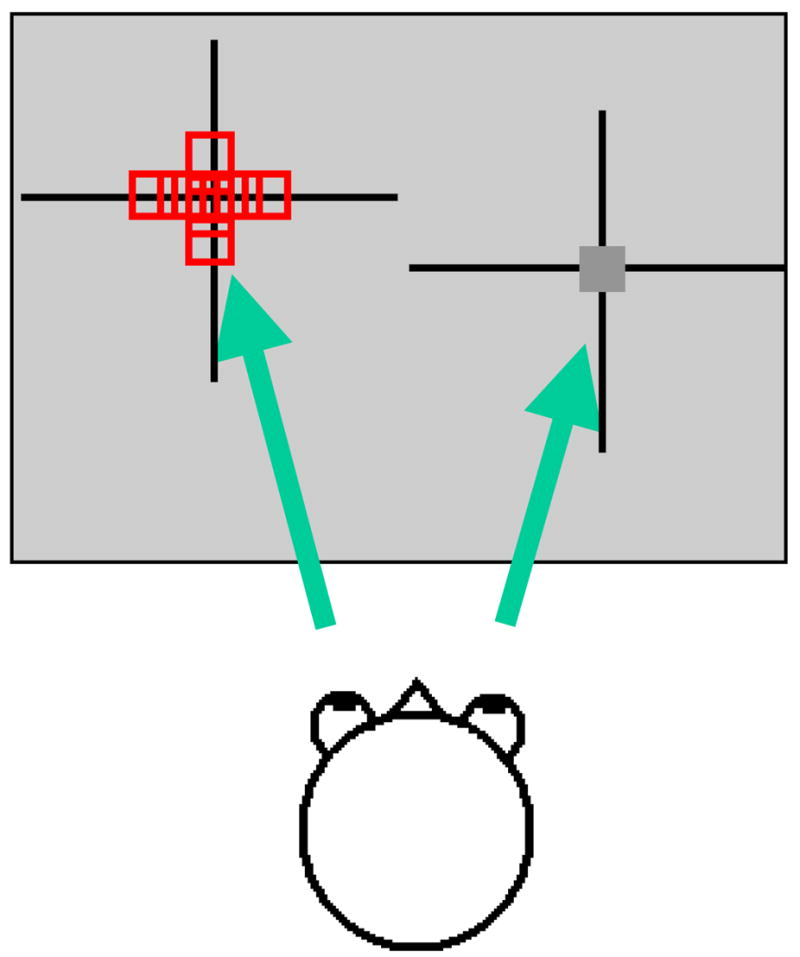
Eyes are diverged to different halves of a computer monitor using firmly secured Risley prisms in front of each eye. Depicted is a spot viewed through the right eye (dark gray box) and different spot positions (differing in either horizontal or vertical position) viewed through the left eye (red boxes). Optical images are then obtained in response to stimulation of left/right spot pairs representing different ocular offsets.
Crude ocular alignment with grating strips
During most of the experiments, instead of using electrophysiology for ocular alignment, we used optical imaging methods to align the eyes. We first imaged strips of gratings presented on a monitor to achieve a crude alignment of the eyes and then obtained more precise alignment with small spots presented on a monitor. These procedures are described below: For crude alignment, typically imaging conditions consisted of 5 vertical and 5 horizontal grating strips (from 0.2° – 1° wide), monocularly presented, where each strip contains moving oriented gratings of 0, 45, 90, and 135 degree orientations. To achieve eye alignment, termed the dichoptic method, a Risley prism was placed in front of each eye. Each optic disk was then back-projected (viewed through the prism) onto the monitor and position plotted. By adjusting the Risley prisms, the positions of the two fovea, as estimated from the optic disk positions, were then diverged to two different parts of the screen. This then determined the approximate locations of where stimuli to each eye can be presented to achieve stimulation of corresponding retinal locations. A brief optical imaging session of grating strips was then conducted (cf. Fig. 4) to determine the approximate stimulus locations which elicit cortical activation in the imaged field of view. Spot imaging (see below) was subsequently conducted for increased mapping precision.
Fig. 4. Rapid line imaging for mapping crude topography.
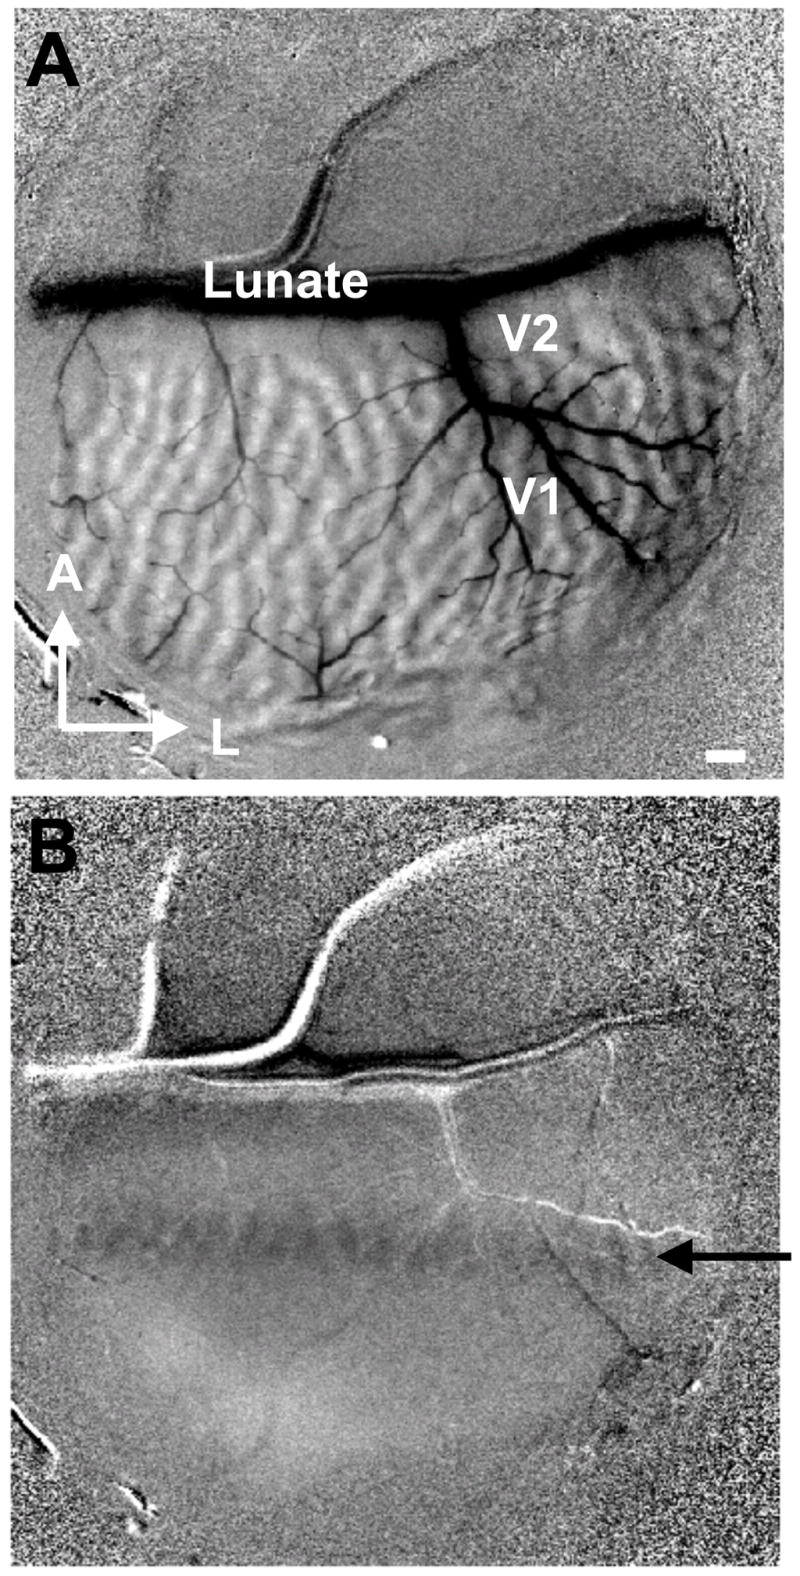
Low power image of entire chamber within field of view. (A) Ocular dominance image (left minus right). (B) Single condition (minus blank) monocularly viewed image in response to a vertical bar (0.2° wide, 3° long, 0.5° away from the vertical meridian) containing a drifting horizontal gratings. An elongated activation (black arrow) is seen in V1 (V1/V2 border determined by ocular dominance imaging). Large horizontal vessel runs in the lunate sulcus. In the activation region, right eye ocular dominance map can be seen (activation pixels are dark gray). Scale bar: 1 mm. A: anterior, L: lateral.
Precise ocular alignment with spot stimuli
Spot stimuli were produced by VSG (Cambridge Research System, Rochester England) on a computer (100 Hz refresh rate) monitor placed 76.2 cm in front of the animal. Once initial crude alignment was done (above), we needed only to test a limited range of stimulus positions ranging from −0.4° to +0.4° (or in some cases −0.2° to +0.2°) in the horizontal and vertical directions. We placed small 0.2° or 0.5° square stimuli (square wave grating patches presented in one of two orientations: 0 or 90 degree) at locations on the screen that corresponded to the center of the imaged V1 region, for each eye. Monocular images (first frame subtracted) were quickly obtained (1 – 5 trials per eye, randomly interleaved sequence, stimulus duration per condition 3 seconds, interstimulus interval 10–15 seconds) and ocular dominance maps generated. Leaving the stimulus over one eye fixed, we moved the stimulus over the other eye in 0.1° steps in horizontal and in vertical directions (see Fig. 2). The size of activation area to each spot stimulus was thresholded at the top 15% of the gray pixel value distribution (Chen et al., 2003). Of the significant pixels (t test between stimulus condition and blank condition, p < 0.05), the center of mass was taken as the center of spot activation. An interpolation was then used to find spot locations that produced the smallest combined left/right activation area (see Fig 11o), i.e. the best ocular alignment. Stimuli were subsequently placed based on this ocular alignment. As this procedure is rapid, it could be easily repeated throughout the experiment for intermittent confirmation (cf. Fig. 6).
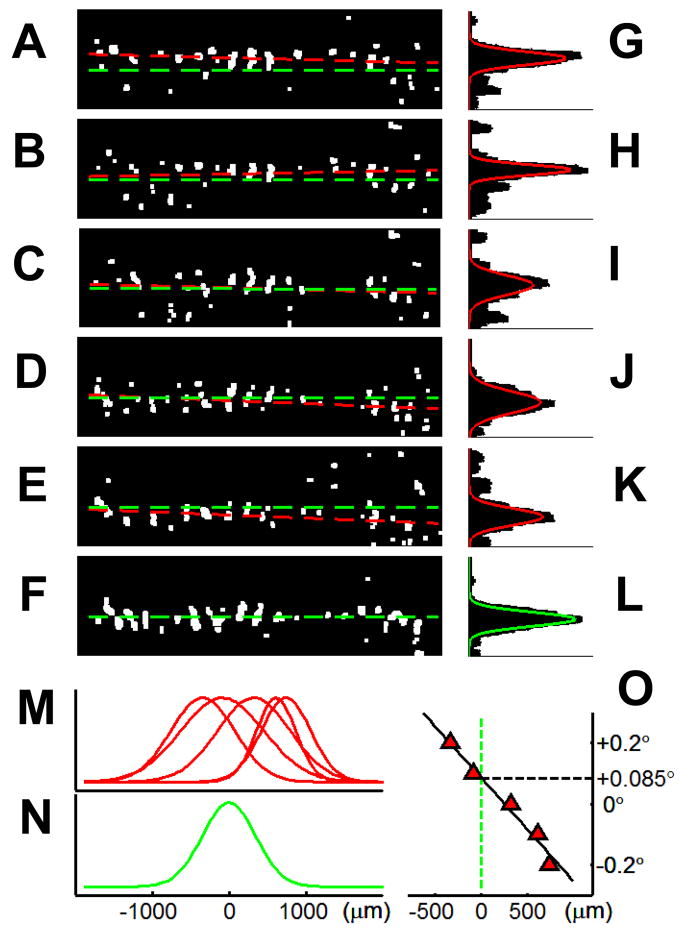
Fig. 11. Sensitivity to 0.1.
° shifts. (A) – (F) thresholded activations of images shown in Figs. 10A – F, respectively. (G) – (L), distribution of thresholded pixels (summed across length of activation). (M), distributions in (G) – (L) overlain and compared with the other eye’s distribution (N). The optimal alignment (+0.085°) is decided by a linear interpolation (O).
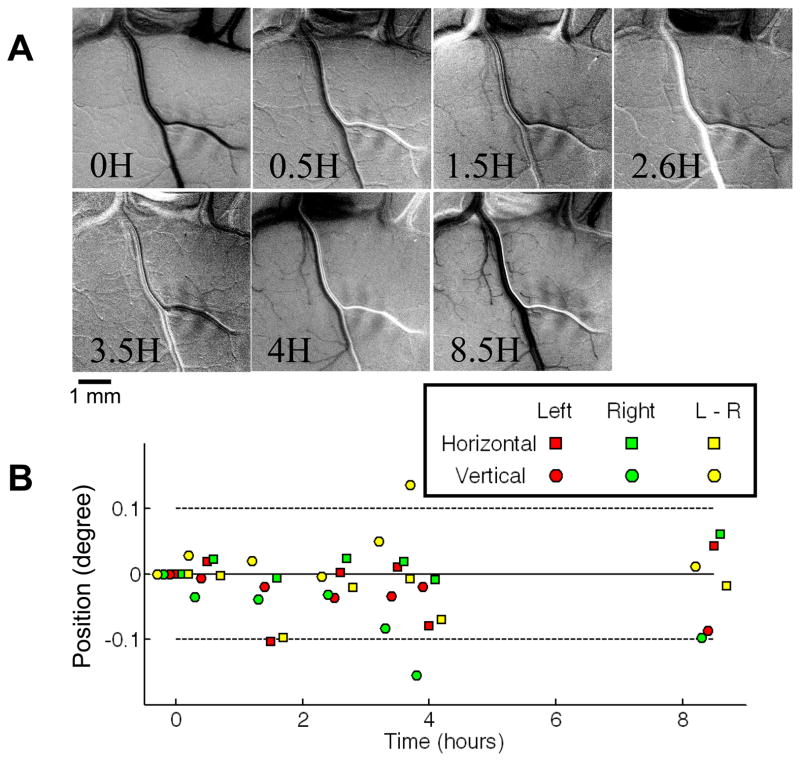
Fig. 6. Stability of preparation.
(A) Single condition monocular spot images in V1 obtained at different times over a period of over 8 hours (time points: 0, 0.5, 1.5, 2.6, 3.5, 4, 8.5 hours). Stimulus: 0.5° spot stimulus containing drifting horizontal grating. Scale bar: 1 mm. (B) Position of spot centers (see Fig. 9 for spot center determination) measured at each of the imaging time points (relative to the first measurement when the eyes have just been aligned: 0 left/right difference; left eye at 0,0; right eye at 0,0). Left eye spot center: red. Right eye spot center: green. Horizontal shift: squares. Vertical shift: circles. Yellow symbols indicate relative offset between the two eyes. Over the 8.5 hour period, position of each eye (red, green) remains largely within ±0.1° (dotted lines), as does the ocular difference (yellow).
Electrophysiological confirmation
Using this method, we found that over hours of recording, the location of a V1 receptive field was extremely stable. In three monkeys in which we also used electrophysiology to track the position of the eyes, we repeatedly checked the receptive field location of a binocular V1 neuron throughout the experiment. The position of the receptive field was rechecked throughout the experimental session (before and after each block of imaging and between collection of single unit recordings, cf. Chen et al 2008).
Visual field mapping
We also used spot imaging to map the extent of the visual field represented within the field of view (cf. Fig 7). Sets of imaging conditions contained spot stimuli with locations at different horizontal and vertical visual field locations. Typically these locations were separated by 0.3° – 0.5°, and spanned 2–3° of visual space. Images were acquired monocularly and revealed the region of elevational and azimuthal space represented in the cortical field of view.
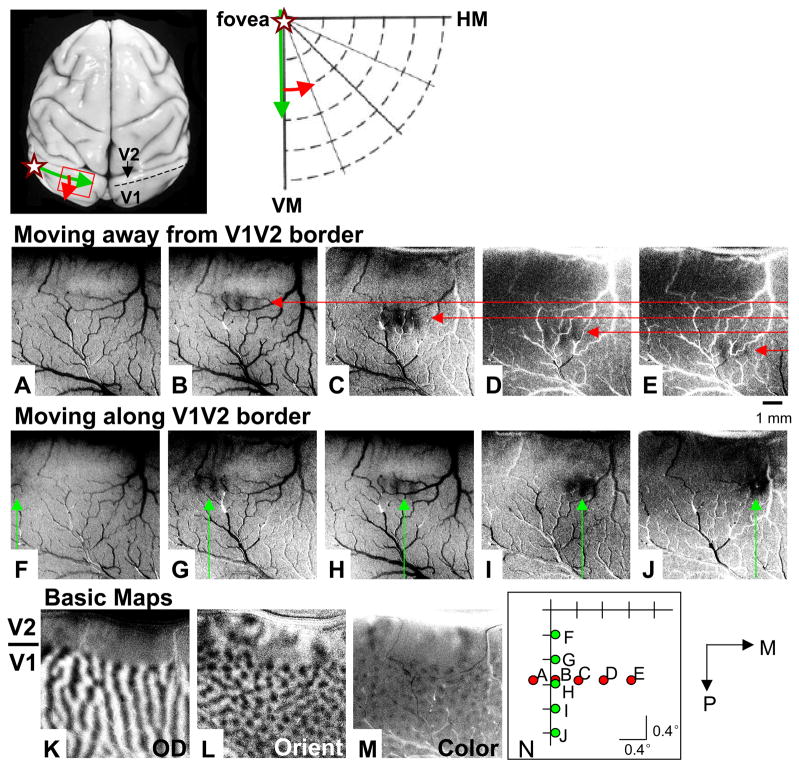
Fig. 7. Mapping the field of view.
Above) Left, The approximate location of the V1/V2 border (dotted line) and the topography of V1 in a macaque monkey brain. Green arrow: direction of increasing eccentricity (along iso-eccentricity line) parallel to the vertical meridian (V1/V2 border). Red arrow: direction of increasing eccentricity (along iso-radial line) from the vertical meridian. Star: location of fovea representation. Right, Green and red arrows indicate topography on brain shown at left. (A) – (E) Single condition spot images of spot locations shown in (N) ((A) – (E), respectively). Red arrows, which point to locations of spot activation, move from V1/V2 border in posterior direction (away from V1/V2 border, see (K). (F) – (J) Single condition spot images of spot locations shown in (N) ((F) – (J), respectively). Green arrows, which indicate locations of spot activation, move from lateral to medial (parallel to V1/V2 border). All single condition images obtained with 0.25° spot. Each spot location shift is 0.4°. (K) – (M) Difference images obtained in response to full field stimuli (see Methods). (K) Ocular dominance image (V1/V2 border indicated by bar at left). (L) Orientation image. (M) Color minus luminance image. (N) Locations of spot stimuli presented in (A) – (J). Scale bar in (E), applies to (A) – (M): 1 mm. P: posterior, M: medial.
General domain imaging
Following our standard mapping procedures, achromatic luminance contrast and isoluminant color gratings were used to image the location of blobs, interblobs, and thin and thick/pale stripes in V2 (Lu and Roe, 2007 Lu and Roe, 2008; Roe et al., 2005; Roe and Ts’o, 1995; Ts’o et al., 1990). Mechanical shutters placed over each eye (in front of the Risley prisms) permitted monocular presentation of stimuli and generation of ocular dominance maps from which the border between V1 and V2 were determined. As the V1/V2 border is known to represent the vertical meridian, this was also useful in assessing the corresponding spot stimulus locations (see Fig 7).
Evaluating cycloconvergence
To examine the degree of eye rotation under anesthesia and paralysis, intrinsic signal optical images were collected in response to thin grating strips or bars (0.1° wide). Eyes were diverged and two parallel bars were viewed, one through each eye. Stimuli are presented for 3 seconds. Bars were placed in corresponding locations in visual space as determined by spot imaging. If no relative eye rotation exists, then the two monocular cortical activation regions should be parallel to each other. A long bar shown to one eye was positioned at five different horizontal offsets (in steps of 0.1°) relative to the other eye. Monocular images were obtained, thresholded, and the axis of activation fitted. The distributions across the fitted axis were then compared with that of the single eye distribution. The difference between these distributions was then evaluated for statistical significance.
Results
Spot imaging with diverged eyes
Fig. 3 illustrates that the eyes are not aligned following anesthesia and paralysis (before positioning of Risley prisms and before placement of eye rings). Compared to the ocular dominance image obtained to full field stimulation (Fig. 3A), the ocular dominance image in response to spot stimulation (Fig. 3B) results in two activation zones. The dark patch (on left side of image) is cortical region responding to the left eye stimulation and the light patch (on right side of image) is cortical region responding to the right eye stimulation, consistent with the pattern of eye-specific activation (see overlay in Fig. 3C).
Fig. 3. Spot imaging with eyes diverged.
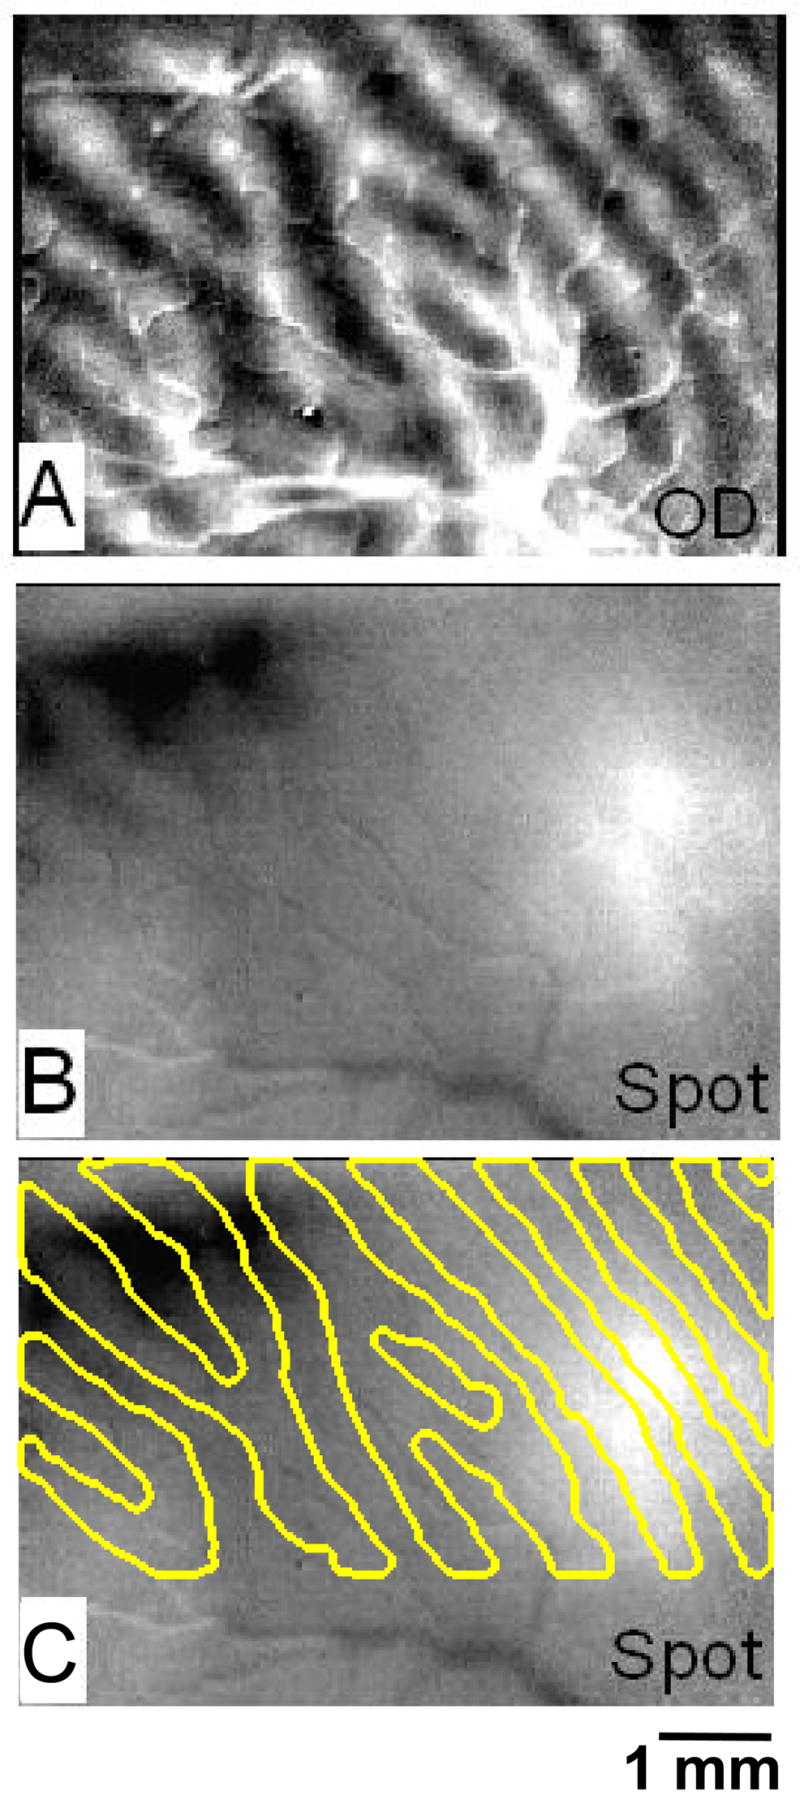
(A) Ocular dominance image obtained with full field moving grating (left minus right eye, sum of 1, 45, 90, 135 degree conditions). (B) Ocular dominance image obtained with small 0.5° spot (left minus right eye, sum of 1, 45, 90, 135 degree conditions). (C) Same image as in B, with ocular dominance outlines superimposed. Scale bar: 1 mm.
Imaging the approximate field of view without electrophysiology
After placement of eye rings, eyes are diverged to two halves of the screen using Risley prisms placed in front of each eye. The approximate field of view corresponding to the cortical region studied is then determined by back-projection of optic disk in each eye and very roughly aligned (using the Risley prisms). This brings eyes to within a few degrees of alignment. We then proceed with a rapid procedure for ocular alignment emplying grating strips for crude alignemnt followed by a precise alignment using small spots.
For crude alignment, we use grating strips to stimulate a restricted range of iso-elevations or iso-azimuths. For each eye, 5 strips of horizontal and 5 strips of vertical stimuli (10° long and 0.2° – 1° wide containing either 0, 45, 90, or 135 degree gratings) are positioned within the approximate corresponding visual field locations. As shown in Fig. 4, presentation of a 0.2° wide vertical line produces an elongated activation (indicated by black arrow) parallel to the V1/V2 border (determined by imaging ocular dominance in Fig 4A). Presentation of a 0.2° wide horizontal line produces orthogonal activation (not shown). The horizontal and vertical line conditions that produce clear topographic activation are then used to estimate for each eye corresponding locations to place spot stimuli for spot imaging.
Spot imaging is rapid
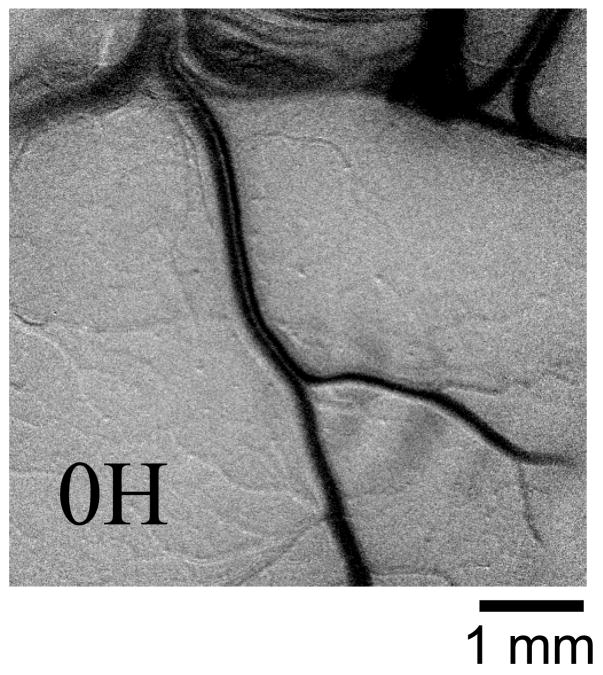
Fig. 5 illustrates a single condition map obtained in response to the presentation of a 0.5° spot imaged through the left eye. The activation reveals a restricted (approximately 2 mm in length and 1 mm in width) activation region in which the left ocular dominance columns are visible (dark pixels). This image is the sum of only 2 trials. As each stimulus trial takes about 15 seconds (3 second stimulus period, followed by 10 – 15 seconds interstimulus interval), this image was obtained in less than 30 seconds. Sets of images with 10 – 20 conditions can thus be obtained relatively rapidly (5 – 10 minutes).
Fig. 5. Spot imaging is rapid.
Single condition monocular ocular dominance image in response to a small spot (0.5°) containing a drifting horizontal grating (0H). Within only one trial, the left eye ocular dominance map can be seen (activation region with striped appearance, dark gray pixels correspond to left eye ocular dominance columns). Prominent blood vessel runs through this activation region. Same image as in Fig. 6A. Scale bar: 1 mm.
Eye position is stable over time
Fig. 6 illustrates that the position of each eye is relatively stable over time. Several single condition monocular spot images in V1 are obtained over a period of over 8 hours (Fig. 6A, time points: 0, 0.5, 1.5, 2.6, 3.5, 4, 8.5 hours). In Figure 6B, the positions of spot activation centers for each eye are plotted. Over a period of 8.5 hours, each of the eyes (Left eye: red, Right eye: green) stay within 0.1° (dotted lines) of the initial horizontal position (squares) and the initial vertical position (circles) (except for one point: 4 hour right eye). Importantly, the relative disparity between the two eyes (yellow symbols) stays largely within ±0.1° at any one point in time. Alignment is checked before and after each imaging run (see Chen et al. 2008). If it is discovered that eyes have moved out of alignment (e.g. Fig. 6B, 4 hour time point), then data from the previous run is discarded and eyes are realigned reimaging spot stimulus locations.
Imaging the field of view
Monocular spot imaging is useful for mapping the field of view without the need for electrical recording. As shown in Fig. 7, we first map the field of view with our standard methods for determining the V1/V2 border (Fig. 7K), orientation maps in V1 (Fig. 7L), orientation maps in V2 that reveal locations of thick/pale stripes (Fig. 7L), blobs in V1 (Fig. 7M), and thin stripes in V2 (Fig. 7M).
We then imaged with a small spot through a single eye (0.25° spot through left eye in Fig. 7). As the spot is moved in 0.4° steps from near the vertical meridian to more eccentric azimuthal locations (Fig. 7N from Figs. 7A – E, red dots), the activation spot moves from the V1/V2 border (Fig. 7B) in a posterior direction (Figs. 7C – E, red arrows). Note that the stimulus position presented in A produced no activation (Fig 7A). Given the progression of the spot stimulus locations (see N, progression from E - A), we infer that the location of spot A fell in the opposite hemifield and thus no spot activation is visible. As the spot is moved in 0.4° steps from near the horizontal meridian to lower fields (Fig. 7N, from Figs. 7F – J, green dots), the activation spot moves from left (lateral) to right (medial) in the field of view (Figs. 7F – J, green arrows). This imaging run contained 10 conditions. The map of the imaged field of view was obtained within 15 minutes.
This topography is consistent with the known topography within V1 (Daniel and Whitteridge, 1961; Gattass et al., 1987; Hubel and Wiesel, 1974; Van Essen and Zeki, 1978) and is consistent with optical mapping studies using lines (Blasdel and Campbell, 2001; Bosking et al., 2002; Shmuel et al., 2005, Figs. 7A – E). The entire mediolateral extent (Figs. 7F – J) extends no more than 2°. Knowing the visual extent of the imaged field of view is important for stimulus placement (e.g. in disparity experiments making sure the entire depth surface covers the field of view, see Chen et al., 2008).
Converging eyes with spot imaging
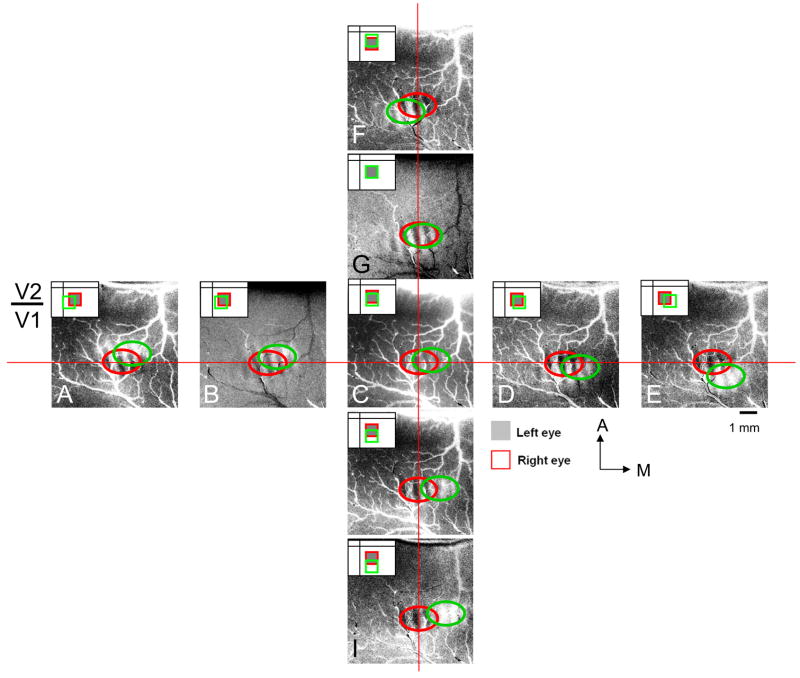
We used spot imaging of a 0.5° spot through each eye to obtain ocular dominance spot images (Fig. 8). Since initial alignment (before onset of imaging) is done by either recording a binocular receptive field in V1 or by crude line imaging, we only need to test a limited range of stimulus positions ranging from, in this case, −0.4 ° to +0.4° in the horizontal and vertical directions. As shown in Fig. 2, the location of the spot for one eye (gray box) was kept constant while the spot presented to the other eye was shifted in 0.2° steps in either the horizontal or vertical direction. Thus for the session shown in Fig. 8, there were 9 conditions for each eye. In each of Figs. 8A – 8I, the spot activation obtained through the left eye (circled by red) remains constant in position (use horizontal red line and vertical red line as guides). As the right eye spot is shifted (in 0.2° steps) from the left to the right relative to the left eye spot (see insets in upper left corner of each panel), the right eye spot activation shifts from near the V1/V2 border (indicated at left of panels, see ocular dominance image in Fig. 7K) to more posterior locations (circled by green). Similarly, as the right eye spot is shifted (in 0.2° steps) from the top to the bottom in relative to the left eye spot (see insets in each panel), the spot activation obtained through the right eye shifts from lateral to medial (circled by green).
Fig. 8. Procedure for placing stimuli at corresponding positions in left and right eyes.
(A) – (I) Ocular dominance maps (Left minus Right eye). Monocular presentation of a 0.5° spot (containing horizontally and vertically drifting gratings). Left eye spot location (gray filled box in inset) was kept fixed and activated left eye ocular dominance patch (encircled in red) in each condition. Right eye spot location (red box in inset) was shifted horizontally or vertically and activated right eye ocular dominance patch (encircled in green) in each condition. Relative shifts can be seen by using horizontal and vertical red lines as guides. Total of 9 different locations. The pair with greatest overlap (i.e. best alignment is (G). Shift step: 0.2° each. A: anterior, M: medial.
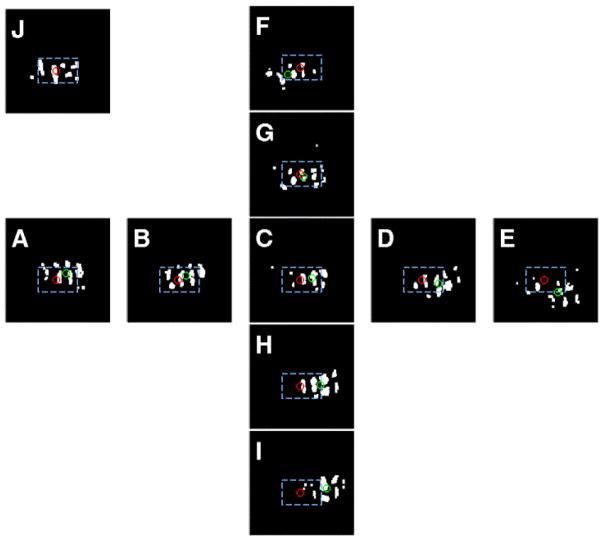
To determine the relative stimulus positions that give the best alignment, we calculated the center of mass of each eye’s activation (top 15% of pixel distribution, Fig. 9). Fig. 9J illustrates the center of mass of the right eye (red circle). Figs. 9A – I illustrate the thresholded pixels for the left eye (center of mass indicated by green circles, red circle superimposed for comparison). Of the 9 conditions, the greatest degree of overlap is given by the image with the shortest distance between left and right eye center of mass. In this case, the shortest distance is in Fig. 9G. By calculating the degree of horizontal and vertical shift per 0.2° of visual spot position shift, we have determined that there is about 600 μm per 0.2° shift in horizontal and 360 μm per 0.2° shift in vertical positions (or about 300 μm per 0.1° shift in horizontal and 180 μm per 0.1° shift in vertical). The cortical magnifications are 3.2 mm/° of vertical space and 1.8 mm/° of horizontal space. Given that optical imaging has spatial resolution of at least 100 μm (Bosking et al., 2002; Yang et al., 2007), this method has the sensitivity to detect 0.1° shifts in inter-ocular position.
Fig. 9. Determination of best ocular convergence.
Same images as shown in Fig. 8. Spot imaging activations shown in white pixels. (A) – (I) Spot activation for left eye. Top 15% of pixel value distribution. Center of mass indicated by green circle. Center of mass for left eye pixels (red circle) is superimposed. (J) Top 15% pixels distribution of spot activation for right eye. (G) reveals the pair of left/right activations that have the shortest distance between the left (red) and right (green) centers of mass and therefore provides the stimulus positions that achieve maximal ocular alignment.
Stimuli are subsequently placed based on this alignment. Once eyes are aligned, horizontal ocular disparity maps can be obtained using other types of stimuli such as random dot stimuli (Chen et al., 2008). This procedure can be repeated throughout the experiment.
Degree of cyclovergence
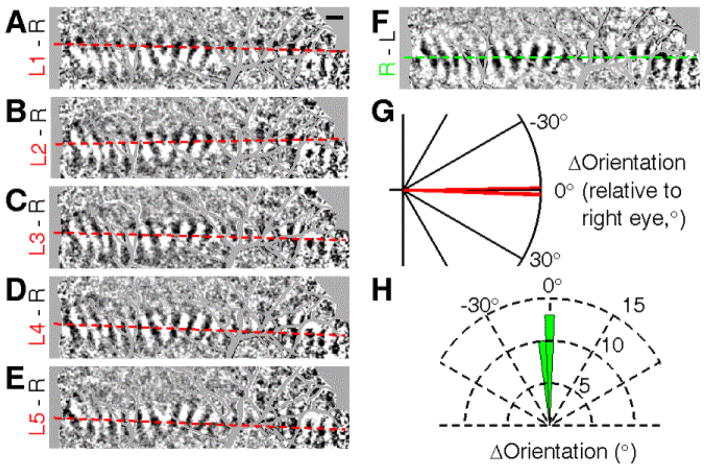
Inter-ocular disparity can also arise from differences in the rotational axes of the two eyes. To examine the degree of cyclovergence, eyes were diverged and two parallel bars were viewed, one through each eye. Bars were placed in corresponding locations in visual space (as determined by spot imaging). The reasoning is: if no relative eye rotation exists, then the two monocular cortical activation regions should be parallel to each other. As shown in Figures 10A – 10E, a long bar shown to the left eye was located at five different horizontal offsets from that shown to the right eye in steps of 0.1°. Fig. 10F shows the activation to right eye alone. Activated cortical areas were thresholded and fitted (left eye: dashed red lines in Figs. 10A – E; right eye: dashed green line in Fig. 10F). In this case, the relative slopes between two eyes are not significantly different (Fig. 10G). Moreover, across all cases (n=25), the degree of cyclovergence was not significantly different from zero (Fig. 10H, −0.77° ± 0.85°, mean ± SEM, N = 25, p = 0.23, t test). This suggests that the degree of cyclovergence is negligible.
Fig. 10. Degree of cyclovergence.
Eyes were diverged and two parallel vertical bars were viewed, one through each eye. The reasoning is if no relative eye rotation exists, then the two monocular cortical activation regions should be parallel to each other. (A) – (E), images of a long bar shown to the left eye at five different horizontal offsets from that shown to the right eye in steps of 0.1°. (F), the activation to right eye alone. Dashed red and green lines indicate fit of thresholded activations (shown in Fig. 11). (G), relative slope of responses to stimulus in the left and right eyes. (H), degree of cyclovergence is not significantly different from zero (−0.77° ± 0.85°, mean ± SEM, N = 25, p = 0.23, t test).
This type of bar imaging also demonstrates the sensitivity to shifts in inter-ocular position of less than 0.1°. The distributions of thresholded pixels from Figs 10A–E are shown in Figs. 11A – E and summed across the length of activation and displayed in histograms in Figs. 11G – K. These distributions (normalized) are overlain in Fig. 11M and compared with the distribution of the right eye alone (Fig. 11F, L, N). Thus, 0.1° shifts in the bar position result in detectable differences in cortical activation (283 ± 25 μm per 0.1°, N = 10). Finally, as shown in Figure 11O, interpolation of the distribution centers (X axis) vs the bar position (Y axis), reveals an optimal alignment of +0.085°.
Discussion
Other mapping methods
Topographic mapping has traditionally lay in the realm of electrophysiological recordings (e.g. Daniel and Whitteridge, 1961; Gattass et al., 1987; Van Essen and Zeki, 1978) and anatomical tract tracing (e.g. Weller and Kaas, 1983). In our own previous anesthetized experiments, we determined the extent of visual field represented within the imaged field of view by electrophysiological recording from the corners and perimeter of the field of view (e.g. Hung et al., 2001; Roe et al., 2005 Fig. 2). Cortical maps have also been elegantly demonstrated with 2-deoxyglucose methods (Tootell et al., 1988; Tootell et al., 1982). With the advent of human fMRI studies, the development of phase-encoded mapping ushered in a new era of topographic mapping methodology (DeYoe et al., 1996; Engel et al., 1997; Sereno et al., 1995; Wandell et al., 2007). This method was later adapted to animal studies (monkey fMRI: Brewer et al., 2002; Fize et al., 2003; mouse optical imaging: Kalatsky et al., 2005; Kalatsky and Stryker, 2003; monkey optical imaging: Yang et al., 2007). Topography of visual cortex has also been beautifully mapped in optical imaging experiments with lines or elongated bars (Blasdel and Campbell, 2001; Bosking et al., 2002; Lyon et al., 2002; Shmuel et al., 2005; Xu et al., 2004; Xu et al., 2005).
While visual field mapping methods have included both electrophysiology and imaging, methods for ocular alignment have depended largely on electrophysiology. Here, we present an alternative method for ocular alignment, one that relies on optical imaging rather than electrophysiology. We demonstrate that this method may be reliably used at times electrophysiology is either incompatible or inconvenient for the experimental setup. was to establish in the awake, fixating animal the field of view represented within the optical chamber. For chronic recordings in awake animals or for repeated recordings in anesthetized animals, it is often convenient not to open the optical window to insert electrodes. We now perform these procedures routinely (Lu and Roe 2007c, Tanigawa et al 2008).
Correlation with previous electrophysiology
From Figs. 4, 5, 8, and 10, we estimate cortical magnifications of 2.8–3.2 mm/° along vertical axis and 1.8 mm/° along horizontal axis in the visual field. This compares favorably with the 2.5 mm/° (at 4° eccentricity) from (Hubel and Wiesel 1974, see also Daniel and Whitteridge, 1961; Dow et al., 1981; Hubel and Wiesel, 1974; Van Essen et al., 1984). In addition, previous studies have reported a roughly 2:1 anisotropy of point activation in primary visual cortex of Macaque monkeys (Grinvald et al., 1994; Hubel and Wiesel, 1974, cf. Malach et al., 1993; Sincich and Blasdel, 2001; Yoshioka et al., 1992). Our activations also reveal this anisotropy of activation (Figs. 5 – 8). Thus, the topography revealed with optical imaging is comparable to previous electrophysiological studies.
Estimating center of activation
Based on the report by (Hubel and Wiesel 1974, see also Roe and Ts’o, 1995 for similar organization in V2), adjacent ocular dominance columns re-represent the same location in space, although shifted by a ‘half jump’ back, resulting in ‘two steps forward, one step back’ progression. Each ocular dominance pair thus spans ‘1.5 steps’ of visual space. For this reason, the center position may differ slightly depending on which eye is stimulated. We estimate this possible difference by taking the average ocular dominance column width (at 3° – 5° eccentricity where our data were recorded) and the estimated cortical magnification factor. Ocular dominance columns in Macaque monkeys (Macaca mulatta) at the regions we are recording are on average 400 μm wide (Grinvald et al., 1994; Horton and Hedley-Whyte, 1984; LeVay et al., 1975, Ramsden et al 2001, Lu and Roe 2007). We estimate cortical magnification to be approximately 0.17°/mm (Fig. 7: 0.25° spans 1.5 mm of cortex) to 0.20°/mm (Fig. 5: 0.5° spans 2.5 mm of cortex). Thus, 0.8 mm of cortex (a pair of left/right ocular dominance columns) is estimated to represent 0.13° – 0.16° (~0.15°) of visual space. Since one pair of ocular dominance spans 1.5 steps of visual space, representation through each eye could differ by as much as about 0.05° (0.5 steps, or one-third of 0.15°). The estimated resolution in estimating ocular offset is thus 0.05°.
In this study, we have shown that we can achieve 0.1° resolution with optical imaging methods. Cortical activation locations were determined by estimating centers of monocular activation regions. Estimates of activation through each eye were obtained by using the center-of-mass method. Since optical imaging has a spatial resolution of ~50 –100 μm (1/16 – 1/8 of ocular dominance pair width), theoretically it has the capability of detecting a visual shift of ~0.01° – 0.02° (1/16 – 1/8 of 0.0.15°). Indeed, in practice, as shown in Fig. 6, very small shifts are detectable by this method. Importantly, for the purposes of studying cortical response to ocular disparity (cf. Cumming and Parker, 1999), this degree of precision permits sufficient resolution to determine whether eyes are staying within 0.1° inter-ocular offset (Figs. 6 and 11, cf. Bosking et al., 2002).
Application to disparity studies in anesthetized animals
Electrophysiological recordings have suggested a columnar organization of disparity tuning in certain visual areas such as V2 and MT (Chen et al., 2006; DeAngelis et al., 1999; DeAngelis and Newsome, 1999; Ts’o et al., 2001). Our motivation for developing these spot imaging methods was aimed at studying the topography of disparity response in anesthetized Macaque monkeys with optical imaging methods (Chen et al., 2008). To reveal such maps (which are imaged at 0.08° steps) requires a sub 0.1° of stability in eye position and imaging reliability. In addition, we wanted to establish that the degree of cyclovergence in these studies was negligible (Fig. 10). Using these methods, we find that there are consistent and reproducible near-to-far disparity maps within the thick stripes of V2 (Chen et al., 2008). It is worth mentioning that the imaged signal is a population average and thus any one location may comprise a range of disparity responses. However, on average, the population response in V2 thick stripes is disparity tuned.
Acknowledgments
We thank Lisa Chu for excellent technical assistance. Supported by NIH EY11744, DA023002.
Footnotes
Publisher's Disclaimer: This is a PDF file of an unedited manuscript that has been accepted for publication. As a service to our customers we are providing this early version of the manuscript. The manuscript will undergo copyediting, typesetting, and review of the resulting proof before it is published in its final citable form. Please note that during the production process errors may be discovered which could affect the content, and all legal disclaimers that apply to the journal pertain.
References
- Allman JM, Kaas JH. A representation of the visual field in the caudal third of the middle tempral gyrus of the owl monkey (Aotus trivirgatus) Brain Res. 1971;31:85–105. doi: 10.1016/0006-8993(71)90635-4. [DOI] [PubMed] [Google Scholar]
- Blasdel G, Campbell D. Functional retinotopy of monkey visual cortex. J Neurosci. 2001;21:8286–8301. doi: 10.1523/JNEUROSCI.21-20-08286.2001. [DOI] [PMC free article] [PubMed] [Google Scholar]
- Bosking WH, Crowley JC, Fitzpatrick D. Spatial coding of position and orientation in primary visual cortex. Nat Neurosci. 2002;5:874–882. doi: 10.1038/nn908. [DOI] [PubMed] [Google Scholar]
- Brewer AA, Press WA, Logothetis NK, Wandell BA. Visual areas in macaque cortex measured using functional magnetic resonance imaging. J Neurosci. 2002;22:10416–10426. doi: 10.1523/JNEUROSCI.22-23-10416.2002. [DOI] [PMC free article] [PubMed] [Google Scholar]
- Chen G, Lu HD, Roe A. Functional architecture of macaque cortical area V2 for depth surfaces revealed by optical imaging. Society for Neuroscience; Atlanta, GA. 2006. [Google Scholar]
- Chen LM, Friedman RM, Roe AW. Optical imaging of a tactile illusion in area 3b of the primary somatosensory cortex. Science. 2003;302:881–885. doi: 10.1126/science.1087846. [DOI] [PubMed] [Google Scholar]
- Chen LM, Friedman RM, Roe AW. Optical imaging of SI topography in anesthetized and awake squirrel monkeys. J Neurosci. 2005;25:7648–7659. doi: 10.1523/JNEUROSCI.1990-05.2005. [DOI] [PMC free article] [PubMed] [Google Scholar]
- Chen LM, Heider B, Williams GV, Healy FL, Ramsden BM, Roe AW. A chamber and artificial dura method for long-term optical imaging in the monkey. J Neurosci Methods. 2002;113:41–49. doi: 10.1016/s0165-0270(01)00475-7. [DOI] [PubMed] [Google Scholar]
- Cumming BG, Parker AJ. Binocular neurons in V1 of awake monkeys are selective for absolute, not relative, disparity. J Neurosci. 1999;19:5602–5618. doi: 10.1523/JNEUROSCI.19-13-05602.1999. [DOI] [PMC free article] [PubMed] [Google Scholar]
- Daniel PM, Whitteridge D. The representation of the visual field on the cerebral cortex in monkeys. J Physiol. 1961;159:203–221. doi: 10.1113/jphysiol.1961.sp006803. [DOI] [PMC free article] [PubMed] [Google Scholar]
- DeAngelis GC, Ghose GM, Ohzawa I, Freeman RD. Functional micro-organization of primary visual cortex: receptive field analysis of nearby neurons. J Neurosci. 1999;19:4046–4064. doi: 10.1523/JNEUROSCI.19-10-04046.1999. [DOI] [PMC free article] [PubMed] [Google Scholar]
- DeAngelis GC, Newsome WT. Organization of disparity-selective neurons in macaque area MT. J Neurosci. 1999;19:1398–1415. doi: 10.1523/JNEUROSCI.19-04-01398.1999. [DOI] [PMC free article] [PubMed] [Google Scholar]
- DeYoe EA, Carman GJ, Bandettini P, Glickman S, Wieser J, Cox R, Miller D, Neitz J. Mapping striate and extrastriate visual areas in human cerebral cortex. Proc Natl Acad Sci U S A. 1996;93:2382–2386. doi: 10.1073/pnas.93.6.2382. [DOI] [PMC free article] [PubMed] [Google Scholar]
- Dow BM, Snyder AZ, Vautin RG, Bauer R. Magnification factor and receptive field size in foveal striate cortex of the monkey. Exp Brain Res. 1981;44:213–228. doi: 10.1007/BF00237343. [DOI] [PubMed] [Google Scholar]
- Engel SA, Glover GH, Wandell BA. Retinotopic organization in human visual cortex and the spatial precision of functional MRI. Cerebral Cortex. 1997;7:181–192. doi: 10.1093/cercor/7.2.181. [DOI] [PubMed] [Google Scholar]
- Fize D, Vanduffel W, Nelissen K, Denys K, Chef d’Hotel C, Faugeras O, Orban GA. The retinotopic organization of primate dorsal V4 and surrounding areas: A functional magnetic resonance imaging study in awake monkeys. J Neurosci. 2003;23:7395–7406. doi: 10.1523/JNEUROSCI.23-19-07395.2003. [DOI] [PMC free article] [PubMed] [Google Scholar]
- Gattass R, Sousa AP, Rosa MG. Visual topography of V1 in the Cebus monkey. J Comp Neurol. 1987;259:529–548. doi: 10.1002/cne.902590404. [DOI] [PubMed] [Google Scholar]
- Grinvald A, Lieke EE, Frostig RD, Hildesheim R. Cortical point-spread function and long-range lateral interactions revealed by real-time optical imaging of macaque monkey primary visual cortex. J Neurosci. 1994;14:2545–2568. doi: 10.1523/JNEUROSCI.14-05-02545.1994. [DOI] [PMC free article] [PubMed] [Google Scholar]
- Horton JC, Hedley-Whyte ET. Mapping of cytochrome oxidase patches and ocular dominance columns in human visual cortex. Philos Trans R Soc Lond B Biol Sci. 1984;304:255–272. doi: 10.1098/rstb.1984.0022. [DOI] [PubMed] [Google Scholar]
- Hubel DH, Livingstone MS. Segregation of form, color, and stereopsis in primate area 18. J Neurosci. 1987;7:3378–3415. doi: 10.1523/JNEUROSCI.07-11-03378.1987. [DOI] [PMC free article] [PubMed] [Google Scholar]
- Hubel DH, Wiesel TN. Uniformity of monkey striate cortex: a parallel relationship between field size, scatter, and magnification factor. J Comp Neurol. 1974;158:295–305. doi: 10.1002/cne.901580305. [DOI] [PubMed] [Google Scholar]
- Hung CP, Ramsden BM, Chen LM, Roe AW. Building surfaces from borders in Areas 17 and 18 of the cat. Vision Res. 2001;41:1389–1407. doi: 10.1016/s0042-6989(01)00075-x. [DOI] [PubMed] [Google Scholar]
- Kalatsky VA, Polley DB, Merzenich MM, Schreiner CE, Stryker MP. Fine functional organization of auditory cortex revealed by Fourier optical imaging. Proc Natl Acad Sci U S A. 2005;102:13325–13330. doi: 10.1073/pnas.0505592102. [DOI] [PMC free article] [PubMed] [Google Scholar]
- Kalatsky VA, Stryker MP. New paradigm for optical imaging: temporally encoded maps of intrinsic signal. Neuron. 2003;38:529–545. doi: 10.1016/s0896-6273(03)00286-1. [DOI] [PubMed] [Google Scholar]
- LeVay S, Hubel DH, Wiesel TN. The pattern of ocular dominance columns in macaque visual cortex revealed by a reduced silver stain. J Comp Neurol. 1975;159:559–576. doi: 10.1002/cne.901590408. [DOI] [PubMed] [Google Scholar]
- Lu HD, Roe AW. Functional Organization of Color Domains in V1 and V2 of Macaque Monkey Revealed by Optical Imaging. Cereb Cortex. 2007a doi: 10.1093/cercor/bhm081. [DOI] [PMC free article] [PubMed] [Google Scholar]
- Lu HD, Roe AW. Optical Imaging of contrast response in macaque monkey v1 and v2. Cerebral Cortex. 2007b;17:2675–2695. doi: 10.1093/cercor/bhl177. [DOI] [PubMed] [Google Scholar]
- Lu HD, Roe AW. Response to motion and motion boundary in monkey V2. Vision Sciences Society; Sarasota, FL: 2007c. [Google Scholar]
- Lyon DC, Xu X, Casagrande VA, Stefansic JD, Shima D, Kaas JH. Optical imaging reveals retinotopic organization of dorsal V3 in New World owl monkeys. Proc Natl Acad Sci U S A. 2002;99:15735–15742. doi: 10.1073/pnas.242600699. [DOI] [PMC free article] [PubMed] [Google Scholar]
- Malach R, Amir Y, Harel M, Grinvald A. Relationship between intrinsic connections and functional architecture revealed by optical imaging and in vivo targeted biocytin injections in primate striate cortex. Proc Natl Acad Sci U S A. 1993;90:10469–10473. doi: 10.1073/pnas.90.22.10469. [DOI] [PMC free article] [PubMed] [Google Scholar]
- Roe AW. Long-term optical imaging of intrinsic signals in anesthetized and awake monkeys. Appl Opt. 2007;46:1872–1880. doi: 10.1364/ao.46.001872. [DOI] [PubMed] [Google Scholar]
- Roe AW, Lu HD, Hung CP. Cortical processing of a brightness illusion. Proc Natl Acad Sci U S A. 2005;102:3869–3874. doi: 10.1073/pnas.0500097102. [DOI] [PMC free article] [PubMed] [Google Scholar]
- Roe AW, Ts’o DY. Visual topography in primate V2: multiple representation across functional stripes. J Neurosci. 1995;15:3689–3715. doi: 10.1523/JNEUROSCI.15-05-03689.1995. [DOI] [PMC free article] [PubMed] [Google Scholar]
- Sereno MI, Dale AM, Reppas JB, Kwong KK, Belliveau JW, Brady TJ, Rosen BR, Tootell RB. Borders of multiple visual areas in humans revealed by functional magnetic resonance imaging. Science. 1995;268:889–893. doi: 10.1126/science.7754376. [DOI] [PubMed] [Google Scholar]
- Shmuel A, Korman M, Sterkin A, Harel M, Ullman S, Malach R, Grinvald A. Retinotopic axis specificity and selective clustering of feedback projections from V2 to V1 in the owl monkey. J Neurosci. 2005;25:2117–2131. doi: 10.1523/JNEUROSCI.4137-04.2005. [DOI] [PMC free article] [PubMed] [Google Scholar]
- Sincich LC, Blasdel GG. Oriented axon projections in primary visual cortex of the monkey. J Neurosci. 2001;21:4416–4426. doi: 10.1523/JNEUROSCI.21-12-04416.2001. [DOI] [PMC free article] [PubMed] [Google Scholar]
- Tanigawa H, Lu HD, Chen G, Roe AW. Functional subdivisions in macaque V4 revealed by optical imaging in the behaving Macaque monkey. Vision Sciences Society; Naples FL. 2008. [Google Scholar]
- Tootell RB, Silverman MS, Hamilton SL, Switkes E, De Valois RL. Functional anatomy of macaque striate cortex. V. Spatial frequency. J Neurosci. 1988;8:1610–1624. doi: 10.1523/JNEUROSCI.08-05-01610.1988. [DOI] [PMC free article] [PubMed] [Google Scholar]
- Tootell RB, Silverman MS, Switkes E, De Valois RL. Deoxyglucose analysis of retinotopic organization in primate striate cortex. Science. 1982;218:902–904. doi: 10.1126/science.7134981. [DOI] [PubMed] [Google Scholar]
- Ts’o DY, Frostig RD, Lieke EE, Grinvald A. Functional organization of primate visual cortex revealed by high resolution optical imaging. Science. 1990;249:417–420. doi: 10.1126/science.2165630. [DOI] [PubMed] [Google Scholar]
- Ts’o DY, Roe AW, Gilbert CD. A hierarchy of the functional organization for color, form and disparity in primate visual area V2. Vision Res. 2001;41:1333–1349. doi: 10.1016/s0042-6989(01)00076-1. [DOI] [PubMed] [Google Scholar]
- Van Essen DC, Newsome WT, Maunsell JH. The visual field representation in striate cortex of the macaque monkey: asymmetries, anisotropies, and individual variability. Vision Res. 1984;24:429–448. doi: 10.1016/0042-6989(84)90041-5. [DOI] [PubMed] [Google Scholar]
- Van Essen DC, Zeki SM. The topographic organization of rhesus monkey prestriate cortex. J Physiol. 1978;277:193–226. doi: 10.1113/jphysiol.1978.sp012269. [DOI] [PMC free article] [PubMed] [Google Scholar]
- Wandell BA, Dumoulin SO, Brewer AA. Visual field maps in human cortex. Neuron. 2007;56:366–383. doi: 10.1016/j.neuron.2007.10.012. [DOI] [PubMed] [Google Scholar]
- Weller RE, Kaas JH. Retinotopic patterns of connections of area 17 with visual areas V-II and MT in macaque monkeys. J Comp Neurol. 1983;220:253–279. doi: 10.1002/cne.902200302. [DOI] [PubMed] [Google Scholar]
- Weller RE, Kaas JH, Wetzel AB. Evidence for the loss of X-cells of the retina after long-term ablation of visual cortex in monkeys. Brain Res. 1979;160:134–138. doi: 10.1016/0006-8993(79)90607-3. [DOI] [PubMed] [Google Scholar]
- Xu X, Bosking W, Sary G, Stefansic J, Shima D, Casagrande V. Functional organization of visual cortex in the owl monkey. J Neurosci. 2004;24:6237–6247. doi: 10.1523/JNEUROSCI.1144-04.2004. [DOI] [PMC free article] [PubMed] [Google Scholar]
- Xu X, Bosking WH, White LE, Fitzpatrick D, Casagrande VA. Functional organization of visual cortex in the prosimian bush baby revealed by optical imaging of intrinsic signals. J Neurophysiol. 2005;94:2748–2762. doi: 10.1152/jn.00354.2005. [DOI] [PubMed] [Google Scholar]
- Yang Z, Heeger DJ, Seidemann E. Rapid and precise retinotopic mapping of the visual cortex obtained by voltage-sensitive dye imaging in the behaving monkey. J Neurophysiol. 2007;98:1002–1014. doi: 10.1152/jn.00417.2007.. [DOI] [PMC free article] [PubMed] [Google Scholar]
- Yoshioka T, Levitt JB, Lund JS. Intrinsic lattice connections of macaque monkey visual cortical area V4. J Neurosci. 1992;12:2785–2802. doi: 10.1523/JNEUROSCI.12-07-02785.1992. [DOI] [PMC free article] [PubMed] [Google Scholar]


