Abstract
Excitation of fluorescent probes for flow cytometry has traditionally been limited to a few discrete laser lines, an inherent limitation in our ability to excite the vast array of fluorescent probes available for cellular analysis. In this report, we have used a supercontinuum (SC) white light laser as an excitation source for flow cytometry. By selectively filtering the wavelength of interest, almost any laser wavelength in the visible spectrum can be separated and used for flow cytometric analysis. The white light lasers used in this study were integrated into a commercial flow cytometry platform, and a series of high-transmission bandpass filters used to select wavelength ranges from the blue (~480 nm) to the long red (>700 nm). Cells labeled with a variety of fluorescent probes or expressing fluorescent proteins were then analyzed, in comparison with traditional lasers emitting at wavelengths similar to the filtered SC source. Based on a standard sensitivity metric, the white light laser bandwidths produced similar excitation levels to traditional lasers for a wide variety of fluorescent probes and expressible proteins. Sensitivity assessment using fluorescent bead arrays confirmed that the SC laser and traditional sources resulted in similar levels of detection sensitivity. Supercontinuum white light laser sources therefore have the potential to remove a significant barrier in flow cytometric analysis, namely the limitation of excitation wavelengths. Almost any visible wavelength range can be made available for excitation, allowing access to virtually any fluorescent probe, and permitting “fine-tuning” of excitation wavelength to particular probes.
Keywords: Flow cytometry, supercontinuum, white light laser, immunophenotyping, fluorescent protein, DsRed, mCherry, Katushka
Introduction
Flow cytometry relies almost exclusively on lasers as a source of excitation for fluorescent probes. While the coherence and power level makes them ideal sources for illuminating individual cells, their discrete wavelengths limits the range of excitation bandwidths that are available for fluorescent probe excitation. Even the most modern multi-laser flow cytometers typically provide no more than six laser wavelengths, allowing excitation of only a fraction of the vast range of fluorescent probes available for biomedical analysis. Single wavelength lasers in formats suitable for flow cytometry have traditionally been limited; for many years, instrumentation was typically limited to 488 nm and red laser sources, with other wavelengths being less common and available only on instrumentation that could accommodate large-frame ion lasers (1). More recent laser diode technology has provided UV and violet sources applicable for cytometry, and diode pumped solid state (DPSS) laser technology has provided blue, green, and more recently yellow and orange lasers that can be integrated into cytometric instrumentation (2,3,4,5,6). These new laser sources have greatly expanded our access to many fluorescent probes that saw little previous use in flow cytometry, as well as providing more optimal excitation for traditional fluorophores.
Nevertheless, increasing the excitation capabilities of our flow cytometers by a single wavelength requires the addition of an entire laser; if many excitation wavelengths are needed, this requirement becomes prohibitive both from an engineering standpoint and in cost. In addition, fixed wavelength lasers are often not well-matched to the excitation spectra of our fluorochromes of interest. For example, even more advanced cytometers typically use violet laser light (400–410 nm) to excite Cyan Fluorescent Protein (CFP), which actually has an excitation maxima of 437 nm. An ideal light source for flow cytometry would function the way a white light xenon lamp and monochromator functions for spectrofluorimetry, namely providing any wavelength and bandwidth of visible light on demand. Such a system would enable the use of virtually any fluorescent probe for biomedical analysis, and would allow fine-tuning of excitation light to probe excitation maxima.
One potential answer to this problem is the supercontinuum white light laser, a recently developed fiber laser technology that emits continuously over a wide bandwidth ranging from the near-ultraviolet to the infrared. The supercontinuum laser phenomenon was observed empirically more than thirty years ago, and has since been the subject of intense study and technological development (7). Supercontinuum light is generated by invoking high optical nonlinearity in a material. Typically, pulsed laser sources are used in the near infrared (1064nm) in the nanosecond, picosecond or femtosecond range, ensuring high peak powers to drive the nonlinear effect in a material, which “breaks” the pulse out into a supercontinuum spectrum Early supercontinuum lasers emitted primarily in the infrared, due to the limitation of using Ti-sapphire femtosecond lasers and bulk nonlinear materials; more recent developments in picosecond fibre sources and the use of microstructured optical crystal fiber has extended the supercontinuum range from violet (~400 nm) to the infrared (> 2000 nm) (8). Such modern supercontinuum sources using optical fiber make them much smaller in size (9, 10) and also very reliable. Due to their enormous visible and infrared bandwidth, these lasers emit at relatively high power levels (several watts is typical), with a light mixture that appears white to the human eye. Since they rely on high-powered pulse infrared lasers as pump sources, supercontinuum lasers are themselves pulsed, but at sufficiently high frequencies (>50 MHz) to function as quasi-CW sources. While much of the power distribution in supercontinuum sources remains in the infrared range, a significant portion of the spectrum does lie in the visible portion of the spectrum. Modifications to the non-linear crystal fibre can modify the spectral distribution and concentrate more power in the visible range (8).
Since supercontinuum lasers emit simultaneously over a wide range, interposing an acousto-optical filter or a coated bandpass filter in front of the beam allows isolation of particular wavelength ranges, permitting the user to select bandwidths of interest from the supercontinuum. This technology therefore has tremendous potential as an excitation source for flow cytometry; the instrument designer and final user can potentially select any excitation wavelength and bandwidth they require simply by using a filter with the desired color transmission requirements. Late-generation supercontinuum lasers have visible light power levels ranging from approximately 1 – 3 mW per nanometer. If, for example, a 530/30 nm bandpass filter (with a transmission peak of 530 nm and a 30 nm window) were used, a filtered beam with a theoretical power level of greater than 30 mW would be expected, a power level entirely applicable for flow cytometry.
In a previous study, we evaluated a early-generation supercontinuum white light fiber laser source for flow cytometry, and found it to work well in a cuvette-based cytometry (albeit at a relatively low milliwatt per nanometer level)(11). In this study, we evaluated two distinct recent-generation supercontinuum sources, both with higher power levels. We also used a more optimal infrared radiation reduction system, and bandpass filters with better transmission characteristics. Using more powerful white laser sources with better post-laser beam processing, we found the excitation properties of these supercontinuum sources to be comparable to those of single wavelength lasers. Supercontinuum white light lasers have therefore reached a point where they can be readily integrated into flow cytometers, eliminating the limitation of excitation wavelengths and permitting the analysis of virtually any fluorescent probe by flow.
Materials and Methods
Cells and immunophenotyping
EL4 cells were obtained from the ATCC (Manassas, VA) and maintained in RPMI containing 10% FBS. Cells were labeled with biotin-conjugated anti-mouse CD44 or CD95 primary antibody, and secondary labeled with streptavidin conjugated to phycoerythrin (PE), Alexa Fluor 532, Alexa Fluor 555, Alexa Fluor 568, Alexa Fluor 594, Alexa Fluor 647, allophycocyanin (APC), APC-Cy7, Alexa Fluor 680, Alexa Fluor 700 or Alexa Fluor 750. All immunolabeling reagents were obtained from Invitrogen Corporation (Carlsbad, CA).
Fluorescent protein expression in mammalian cells and bacteria
pDsRed1-1 and ptdTomato plasmids were inserted into a murine stem cell virus (MSCV) Neor vector backbone and transduced into SP2/0 cells followed by G418 selection (12). The genes encoding DsRed2, mStrawberry, mCherry, HcRed, mPlum or Katushka were inserted into pBAD/His-B vector (Invitrogen) using BglII and EcoRI restriction sites. The resulting plasmids were transformed into electrocompetent E.coli bacterial strain LMG194 (Invitrogen) (13-16). The protein expression was then induced with 0.02% (wt/vol) L-arabinose at 37°C. For flow cytometry, bacterial cells expressing the proteins were washed with phosphate based saline (PBS), fixed with 4% paraformaldehyde and resuspended in PBS with OD=0.01 measured at 650 nm.
Lasers and flow cytometry
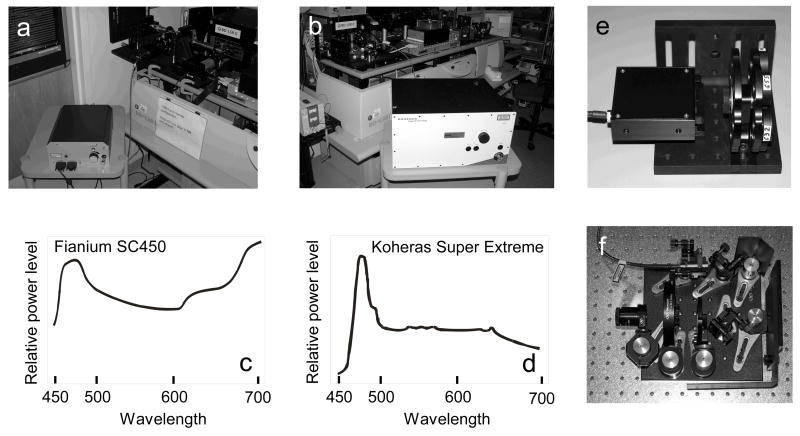
The following supercontinuum white light laser sources were mounted on a BD LSR II flow cytometer: (1) a Fianium SC450 source with 5 W total laser output, (Fianium Ltd., Southampton, UK, http://www.fianium.com), shown in Figure 1a, and (2) a Koheras SuperK Extreme source with 5 W total laser output (Koheras A/S, Denmark, http://www.koheras.com), shown in Figure 1b. Both lasers had a significant emission range from approximately 450 to 2000 nm; the proportion of laser power relative to wavelength plotted against the 400 to 700 nm range is shown in Figures 1c and d. Within the visible range, the power level was approximately 1 to 3 milliwatts per nanometer. The beam diameters of both units was approximately 0.6 mm, with good coherence and minimal beam divergence within 2 meters of the beam output. To block the unwanted infrared portion of the laser emission, the Fianium SC450 beam was reflected off an integrated and enclosed pair of dielectric mirrors with high infrared transmission characteristics (Figure 1e). The Koheras Extreme unit was similarly reflected off two breadboard-mounted dielectric mirrors and subsequently passed through an infrared absorption filter (Figure 1f). As a result, both lasers produced no detectable short-wavelength infrared emission following this filter scheme, as measured by the lack of laser noise in the 800/60 nm bandpass detector of the cytometer (data not shown). Both laser systems had RMS noise levels of less than 1% in the 1–10 MHz range for the entire emission range (data not shown). Noise levels for wavelength-specific bandwidths were not defined; however, good microsphere C.V.s throughout the visible range suggest that noise levels are below the maximum acceptable threshold (Figure 2).
Figure 1.
a, Fianium SC450 SC fiber laser; b, Koheras Super Extreme SC fiber laser; c, Fianium SC450 laser emission power for the 450 to 700 nm spectral range; d, Koheras Super Extreme laser emission power for the 450 to 700 nm spectral range; e, infrared attenuation package for the Fianium SC450, containing two dielectric mirrors in the enclosed portion, and a bandpass filter wheel visible on the right; f, infrared attenuation setup for the Koheras Super Extreme, consisting of two dielectric mirrors, an infrared blocking filter, single bandpass filter holder and 3X beam expander.
Figure 2.
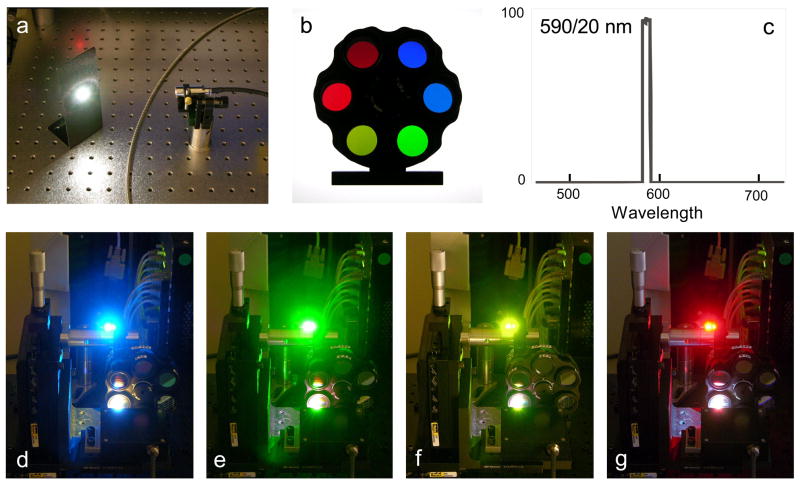
a, total emission of the Fianium SC450 unit; b, filter wheel containing six bandpass filters (blue to red); c, transmission curve of typical Semrock bandpass filter (590/20 nm); d–g, filtered laser emission at 485/22 nm, 529/24 nm, 575/25 nm and 632/22 nm.
The unfiltered beam appeared white in color (Figure 2a); narrow bandpass filters were then mounted in the laser path to isolate the bandwidth of interest (Figure 2b). The following filters were used for excitation: 529/24 nm, 575/25 nm, 590/20 nm, 632/22 nm, 655/15 nm (all from Semrock, Rochester, NY), 550/30 nm (Chroma, Brattleboro, VT) and 610/20 nm (Omega Optical, Brattleboro, VT). The Semrock filters in particular had greater than 95% percent transmission characteristics at the peak wavelength, with steep cutoffs and O.D. values of greater than 6.0 outside the transmission window (data obtained from Semrock, Inc.). A typical Semrock transmission curve is shown in Figure 2c. Downstream of the bandpass filters, the laser beam shape was modified using a 3x beam expander (Melles Griot, Carlsbad, CA), and beam profiles measured using a DataRay CCD camera (DataRay, Boulder Creek, CA). The resulting beam profiles for all evaluated lasers were normalized to a Gaussian distribution with a 50% beam waist diameter of approximately 0.8 millimeters at a position immediately prior to the LSR II laser focusing lens as previously described (17). All laser power levels were monitored using a power meter with semiconductor detector head (Thorlabs, Newton, NJ).
For approximate comparison purposes, single wavelength DPSS 532 nm (50 mW max, Laser-Export, Moscow, Russia), DPSS 561 nm (50 mW max, Oxxius, France), DPSS 580 nm (200 mW max, MPB Communications, Montreal, Canada) or HeNe 633 nm (20 mW, JDSU) lasers were mounted in the same laser position as the supercontinuum sources, and used to analyze the same samples. The power level of the 532 nm laser was adjustable to 30 mW. Power levels of the 561 and 580 nm lasers were attenuated to 20 mW using neutral density filters. Instrument alignment for both SC and single wavelength lasers was optimized using Spherotech Ultra Rainbow Fluorescent Particles single intensity microspheres (catalog number URFP-38-2), and sensitivity for each of the laser sources was assessed using premixed Spherotech Rainbow Calibration Particles 8-population microsphere mixtures (catalog number RCP-30-5A) (Spherotech, Lake Forest, IL) using the filters indicated in Figure 2, as previously described (17). PE, Alexa Fluor 532 and Alexa Fluor 555 were detected through a 585/42 nm filter; Alexa Fluor 568, DsRed2, mStrawberry and mCherry through a 610/20 nm bandpass filter; Alexa Fluor 594 through a 630/22 nm filter; Alexa Fluor 647, APC and HcRed and Katushka through a 660/20 nm; Alexa Fluor 680 and Alexa Fluor 700 through a 710/50 nm filter; and APC-Cy7 and Alexa Fluor 750 through an 800/60 nm filter. Different PMT voltages were used for mammalian cell or bacterial analyses; however, PMT voltages were fixed and unchanged for all analyses within cell types regardless of wavelength. Maximum PMT sensitivity and linearity ranges were established according to the procedure of Joseph Trotter at BD Biosciences (http://www.bdbiosciences.com/pdfs/whitePapers/23-8389-00.pdf) using 488 and 633 nm lasers. These PMT voltages were used for measurement at all laser wavelengths, and were not modified for specific wavelength ranges.
Data were acquired using the DiVa acquisition software system (BD Biosciences), exported as FCS 3.0 files and analyzed using FlowJo for PC ver. 7.2.4 on a five log scale (TreeStar Software, Ashland, OR). Data was initially expressed as median log fluorescence intensity (MFI) values for both the labeled and unlabeled cell populations (henceforth designated Signal and Background, respectively). The following sensitivity metric was then used to estimate signal detection over background (13, 14): [Signal median − Background median]/[(84%ile of the background median minus the background median)/0.995] (17, 18, 19). This sensitivity index accounted for error and peak spreading in the background fluorescence distribution, and is the value indicated on all data histograms.
Laser safety
Supercontinuum lasers are extremely powerful (up to 5 watts total power output), and emit considerable infrared light in the unfiltered state. Due to their high power level, they are classified as Class IV laser sources and pose a considerable skin and eye exposure hazard. Laser shielding (tinted plastic shielding and aluminum plates) were used in the construction of post-beam optics, and eye protection was worn at all times during setup and operation (i.e. 804–1755 nm block laser eyewear, Glendale, Smithfield, RI). Infrared absorption detector cards were used to monitor stray infrared light, and temperature measurements were made at each optical step to ensure that optics did not receive damaging heat levels.
Results
Two supercontinuum white light laser sources (a Fianium SC450 and a Koheras SuperK Extreme) were evaluated for their ability to excite a variety of phenotyping fluorochromes and representative fluorescent proteins by flow cytometry (shown in Figure 1a and b). Both lasers were mounted on BD LSR II flow cytometer, and the supercontinuum light filtered using one of a series of narrow bandpass excitation filters. The appearance of the filtered SC laser light is shown in Figures 2d through 2g for 485/22 nm, 529/24 nm, 575/25 nm and 632/22 nm bandpass filters. The power level of the filtered SC laser emission was routinely measured using a wavelength-specific semiconductor detector, and is indicated on each histogram below. An appropriate emission bandpass filter was then inserted into the downstream PMT detector, and the instrument aligned using fluorescent microspheres.
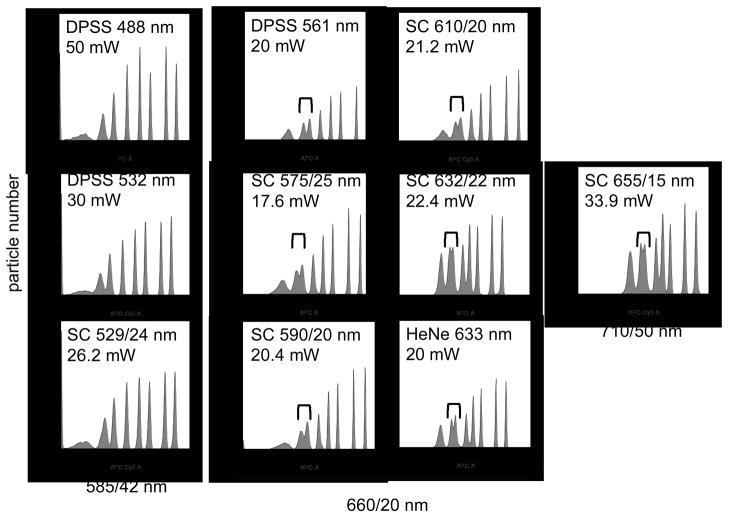
Typical alignments and sensitivity assessments are shown in Figure 3, where premixed Spherotech Rainbow eight-population microspheres were analyzed at varying wavelengths. The laser source and measured power level for each laser is indicated on each histogram. Several single wavelength lasers were also mounted on the cytometer in the same position, and their detection sensitivity assessed for comparison. For example, a single wavelength DPSS 532 nm laser and a SC laser equipped with a 529/24 nm bandpass filter were both able to resolve all eight Rainbow bead populations when detected through a 585/42 nm emission bandpass filter, with comparable mean fluorescence intensity levels for all peaks (Figure 3, left-most histograms). Both single wavelength DPSS 561 nm and HeNe 633 nm lasers were able to barely resolve the second- and third dimmest peaks in a Spherotech series detected through a 660/20 nm emission filter. SC laser excitation using 529/24 nm, 575/25 nm, 590/20 nm, 610/20 nm and 632/22 nm filter gave similar resolution of these two populations (Figure 3 center histograms). This level of resolution was also achieved using SC 655/15 nm laser light detected through a 710/20 nm emission bandpass filter (Figure 3 right histogram). Collectively, wavelength filtered SC laser light gave similar sensitivity levels to traditional single wavelength lasers operating at similar power levels and wavelengths.
Figure 3.
Spherotech Rainbow premixed eight peak microspheres were analyzed on the BD Biosciences LSR II using either indicated laser sources, or a SC source (Fianium) equipped with the indicated filters. The DPSS 488, DPSS 532 and SC 529/24 nm samples were analyzed through a 585/42 nm emission filter (left-most column), the DPSS 561, SC 575/25 nm, SC 590/20 nm, SC 610/20 nm, SC 632/22 nm and HeNe 633 nm were analyzed through a 660/20 nm emission filter (middle columns), and the SC 655/15 nm through a 710/50 nm emission filter (right column). Brackets show the resolution between the two dimmest non-blank microsphere populations.
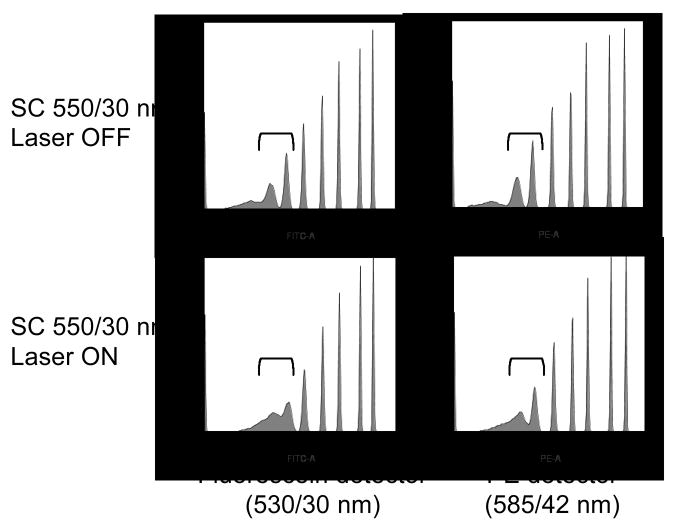
One issue encountered with supercontinuum sources and narrow bandpass filters is that a relatively wide bandwidth of light is generated for excitation (10 to 30 nm) with steeply sloped but not completely discrete edges, rather than the comparatively narrow emission of a single wavelength laser (typically 1 to 2 nm in width). This relatively wide bandwidth may require changes to the emission filters to avoid laser light contamination in the PMT detectors. However, even with standard bandpass filters this overlap could be minimal with the appropriate SC filter. In Figure 4, Spherotech 8-population beads analyzed in the standard fluorescein and PE channels using standard 530/30 and 585/42 nm filters, with spatially separated SC 550/30 nm bandwidth light both absent and present (top and bottom histograms, respectively). The presence of 550/30 nm laser light reduced the resolution of the three dimmest bead populations slightly but not significantly. This suggests that the selected bandpass excitation filters were well-blocked for laser light outside their transmission window, and the overlap into the detection channels was minimal, even with a relatively wide bandpass. However, this did highlight the need for careful selection of excitation filters to prevent overlap into detection filters.
Figure 4.
Spherotech Rainbow premixed eight peak microspheres were analyzed on the LSR II using 488 nm excitation and detection in the fluorescein (530/30 nm) and PE (575/26 nm) detectors, with the SC laser (Fianium) with 550/30 nm filter aligned to an adjacent pinhole and either OFF (top row) or ON (bottom row). Brackets show the resolution between the two dimmest non-blank microsphere populations. The dimmest bead populations are off-scale for all histograms.
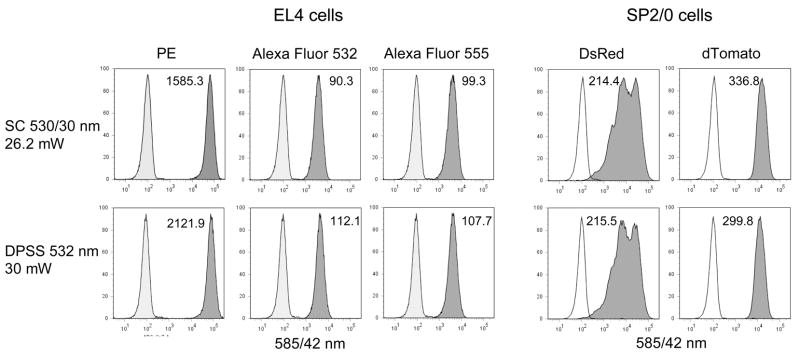
SC laser sources were then evaluated for their ability to excite analytically relevant fluorochromes and fluorescent proteins on actual biological samples, at a series of bandwidths ranging from the green to the long red. In Figure 5, SC laser light filtered with a 529/24 nm (green) bandpass filter was used to excite EL4 cells labeled for CD44 expression using PE, Alexa Fluor 532 and Alexa Fluor 555. This SC bandwidth was also used to excite SP/20 cells expressing the fluorescent proteins DsRed and dTomato. As with the Rainbow beads in Figure 3, the SC source was compared to a traditional single wavelength DPSS 532 nm laser emitting at 30 mW (lower histograms). The sensitivity metric defined in the Materials and Methods (indicated on the Figure 5 histograms) was used to assess the difference between signal and background, taking background error and peak spreading into account. On this basis, the SC 529/24 nm, with a measured power level of 26.2 mW, was found to give detection sensitivity approaching that of the 532 nm source for the immunophenotyping fluorochromes. Detection sensitivity for DsRed and dTomato was comparable between both laser sources.
Figure 5. Left three columns.
EL4 mouse thymoma cells were labeled with biotin-anti-CD44 antibody followed by streptavidin conjugated to PE, Alexa Fluor 532 or Alexa Fluor 555, and analyzed on the LSR II using either the SC laser (Koheras) with 529/24 nm excitation filter (top row), or a DPSS 532 nm laser emitting at 30 mW (bottom row). Fluorescence was detected through a 585/42 nm bandpass filter. The sensitivity index is indicated on each histogram. Right two columns, SP2/0 cells expressing DsRed or tdTomato were analyzed on the LSR II as above. PMT voltages were kept the same within cell types for all laser sources.
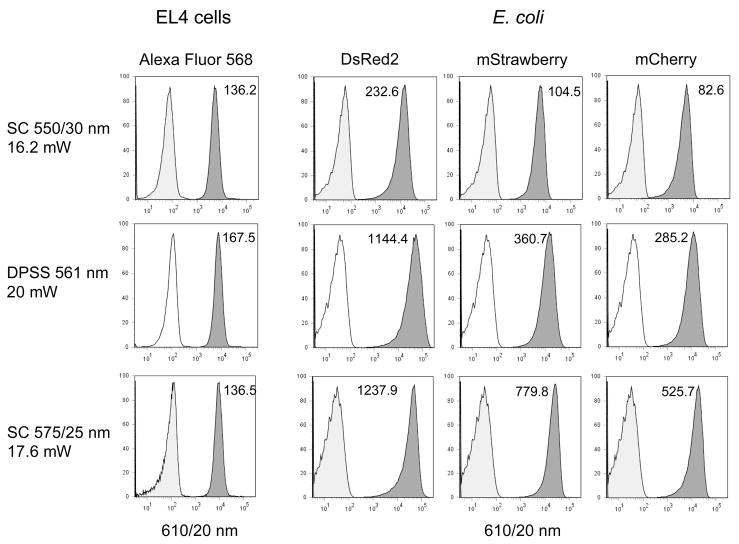
Similar results were observed using a SC equipped with either a 550/30 nm (green-yellow) or 575/25 nm (yellow) filter (Figure 6). This laser configuration was used to excite EL4 cells labeled with Alexa Fluor 568, and E. coli expressing the fluorescent proteins DsRed2, mStrawberry and mCherry. A traditional DPSS 561 nm laser attenuated to 20 mW was used for comparison. Alexa Fluor 568 was comparably excited by all laser sources. DsRed2, with a λEX = 558 nm, was less optimally excited using the SC 550/30 nm, but well-excited by both the DPSS 561 nm source and the SC 575/25 nm. mStrawberry and mCherry, with λEX = 574 nm and 587 nm respectively, were optimally excited using the SC 575/25 nm bandwidth, in both cases better than the 561 nm source at a similar power level.
Figure 6. Left columns.
EL4 mouse thymoma cells were labeled with biotin-anti-CD44 antibody followed by streptavidin conjugated to Alexa Fluor 568, and analyzed on the LSR II using either the SC laser (Fianium) with 550/30 nm excitation filter (top row), a DPSS 561 nm laser emitting at 20 mW (middle row), or the SC laser with 575/25 nm excitation filter (bottom row). Fluorescence was detected through a 610/20 nm bandpass filter. The sensitivity index is indicated on each histogram. Right three columns, E. coli expressing DsRed2, mStrawberry or mCherry were analyzed on the LSR II as above. PMT voltages were kept the same within cell types for all laser sources.
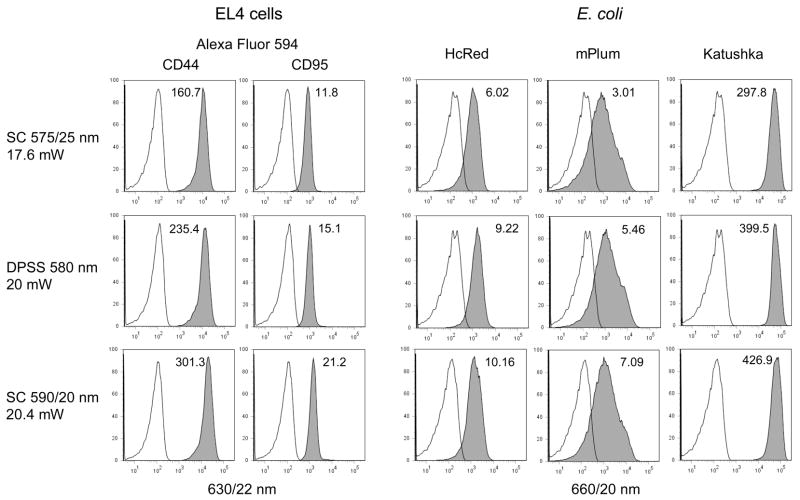
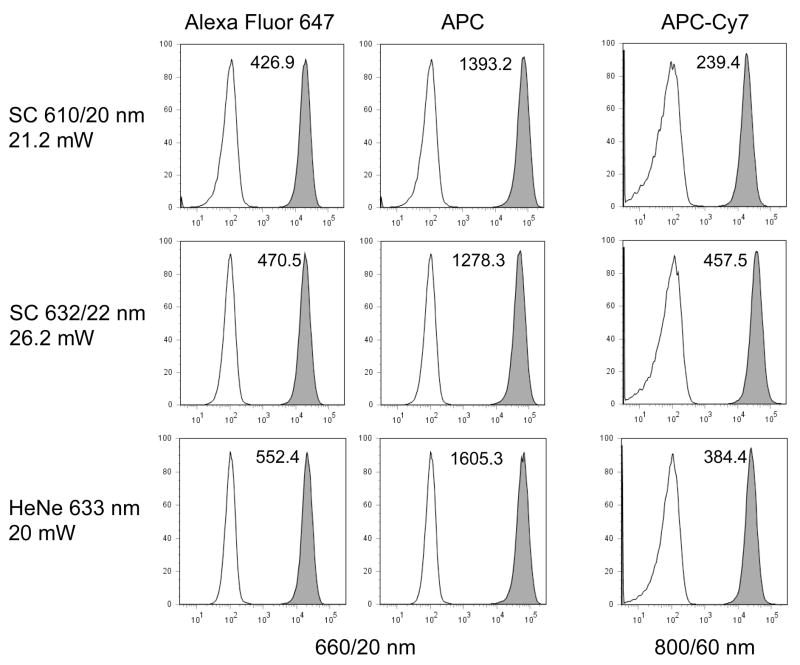
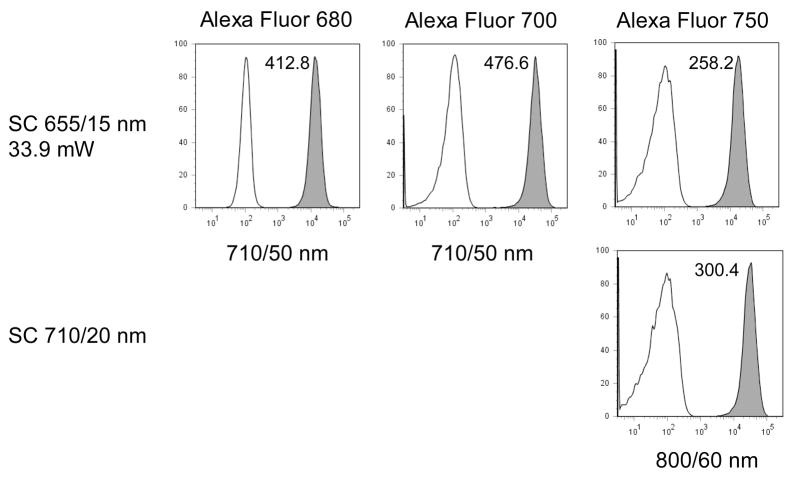
Changing the supercontinuum bandpass filters to longer yellow bandwidths allowed excitation of Alexa Fluor 594, and the longer red fluorescent proteins HcRed, mPlum and Katushka (λEX = 592, 590 and 588 nm respectively). The SC 590/20 nm bandwidth gave better excitation of Alexa Fluor 594 and these three fluorescent proteins than either the SC 575/25 nm line or a DPSS 580 nm laser emitting at a similar power level (Figure 7). Shifting the filters to even longer red wavelengths (610/20 nm and 632/22 nm) allowed excitation of the red-excited probes Alexa Fluor 647, APC and APC-Cy7. The SC 610/20 and 632/22 nm bandwidths excited Alexa Fluor 647 and APC at levels approaching a HeNe 633 nm laser; the SC 632/22 nm even excited APC-Cy7 at a somewhat higher level than the HeNe (Figure 8). The supercontinuum sources also provided higher power levels good excitation into the near-infrared range. The SC 655/15 nm bandwidth gave good excitation of EL4 cells labeled with Alexa Fluor 680, 700 and 750 nm, with the SC 710/20 nm bandwidth giving somewhat improved Alexa Fluor 750 nm excitation (Figure 9).
Figure 7. Left two columns.
EL4 mouse thymoma cells were labeled with either biotin-anti-CD44 or biotin-anti-CD95 antibody followed by streptavidin conjugated to Alexa Fluor 594, and analyzed on the LSR II using either the SC laser (Koheras) with 575/25 nm excitation filter (top row), a DPSS 580 nm laser emitting at 20 mW (middle row), or the SC laser with 590/20 nm excitation filter (bottom row). Fluorescence was detected through a 630/22 nm bandpass filter. The sensitivity index is indicated on each histogram. Right three columns, E. coli expressing HcRed, mPlum or Katushka were analyzed on the LSR II as above. PMT voltages were kept the same within cell types for all laser sources.
Figure 8.
EL4 mouse thymoma cells were labeled with biotin-anti-CD44 followed by streptavidin conjugated to Alexa Fluor 647, APC or APC-Cy7, and analyzed on the LSR II using either the SC laser (Fianium) with 610/20 nm excitation filter (top row), SC laser with 632/22 nm excitation filter (middle row), or a HeNe 633 nm laser emitting at 20 mW (bottom row). Fluorescence was detected through a 660/20 nm bandpass filter for Alexa Fluor 647 and APC, and a 800/60 nm filter for APC-Cy7. The sensitivity index is indicated on each histogram.
Figure 9.
EL4 mouse thymoma cells were labeled with biotin-anti-CD44 followed by streptavidin conjugated to Alexa Fluor 680, Alexa Fluor 700 or Alexa Fluor 750, and analyzed on the LSR II using the SC laser (Fianium) with 655/15 nm (top row) or 710/20 nm (bottom row) excitation filters. Fluorescence was detected through a 710/50 nm bandpass filter for Alexa Fluor 680 and 700, and an 800/60 nm filter for Alexa Fluor 750. The sensitivity index is indicated on each histogram.
Discussion
Two supercontinuum white light laser sources were tested for their ability to excite commonly used fluorescent probes and proteins on a flow cytometry platform, using narrow bandpass filters to select the desired wavelength. Supercontinuum lasers have recently been used in other biomedical fluorescence techniques, including Raman scattering spectroscopy, confocal and two-photon microscopy (20, 21, 22, 23). However, the application of this laser technology to flow cytometry has been limited. An earlier generation supercontinuum laser was previously tested for flow cytometry and found to work well for exciting several fluorescent probes, albeit at lower power levels (11). In this study, the combination of two late-generation supercontinuum systems and bandpass excitation filters with better transmission characteristics resulted in bandwidth power levels approximating those found in single wavelength lasers used for cytometry (15 to 40 mW). At these power levels, supercontinuum laser light was found comparable to conventional lasers for exciting a wide variety of fluorescent probes and proteins. The beam characteristics, noise level and long-term stability of supercontinuum lasers are well within the specifications necessary for flow cytometry.
Supercontinuum sources have several obvious advantages as the excitation source for a flow cytometry. While advances in solid state technology have contributed significantly to the number of laser wavelengths available for flow cytometry, spectral coverage is by no means complete, and gaps still exist. For example, the yellow-orange range (570–620 nm) still has relatively few options for laser excitation that can be easily adapted to smaller cytometers. Supercontinuum lasers allow easy access to any visible wavelength, allowing far better accommodation of a wide variety of fluorescent probes. Supercontinuum lasers also obviate the need for many single wavelength sources on a single cytometer; in theory, a single SC source could be split into multiple component wavelengths and replace numerous traditional lasers with a single unit. The wavelength range of current SC sources extends well into the blue (~450 nm), and developers in the field expect this range to extend below 400 nm, encompassing the entire range of visible lasers currently available for flow. Finally, supercontinuum sources should allow us to fine-tune our excitation conditions to particular fluorochromes; this will be particularly useful in applications such as FRET, where the excitation/emission conditions are very precise, single wavelength sources are often not optimal for donor/acceptor excitation. Supercontinuum laser light should give us complete control in choosing our excitation conditions.
Since the per nanometer power output of supercontinuum sources in the visible range still remains relatively low (1–3 nanometers per milliwatt on average), there is a requirement for relatively wide wavelength bandwidths, necessitating some changes in the downstream detection optics. The cost of these units (50,000 to 100,000 USD) is also very high, although this is likely to decrease as the applications and number or manufactured units increases. Nevertheless, the benefits of precise wavelength tuning, the potential to extract multiple wavelengths from a single sources, and the ability to provide any visible wavelength necessary for fluorochrome excitation are enormous benefits. This technology has the potential to eliminate excitation wavelength as a limitation for cytometric analysis.
Acknowledgments
We are very grateful to Vladimir Kozlov and Anatoly Grudinin from Fianium Ltd. (http://www.fianium.com) and Husain Imam and Carsten Thomsen from Koheras A/S (http://www.koheras.com) for providing the supercontinuum white light laser sources used in this study, as well as assistance in their use. We are also grateful to Robert Hawley and Teresa Hawley at The George Washington University School of Medicine for providing the SP2/0 cells expressing DsRed and tdTomato. This work was supported by intramural funds from the Center for Cancer Research, NCI/NIH to W. Telford, and GM070358 and GM073913 grants from NIGMS/NIH to V. Verkhusha.
References
- 1.Telford WG. Methods in Molecular Biology. Vol. 263. London, UK: Humana Press; 2004. Small lasers in flow cytometry; pp. 399–418. [DOI] [PubMed] [Google Scholar]
- 2.Telford WG, Huber C. Novel solid-state lasers in flow cytometry. Biophotonics International. 2006;13:50–53. [Google Scholar]
- 3.Shapiro HM, Perlmutter NG. Violet laser diodes as light sources for cytometry. Cytometry. 2001;44:133–136. doi: 10.1002/1097-0320(20010601)44:2<133::aid-cyto1092>3.0.co;2-s. [DOI] [PubMed] [Google Scholar]
- 4.Telford WG. Analysis of UV-excited fluorochromes by flow cytometry using a near-UV laser diode. Cytometry A. 2004;61A:9–17. doi: 10.1002/cyto.a.20032. [DOI] [PubMed] [Google Scholar]
- 5.Perfetto SP, Roederer M. Increased immunofluorescence sensitivity using 532 nm excitation. Cytometry A. 2007;71A:73–79. doi: 10.1002/cyto.a.20358. [DOI] [PubMed] [Google Scholar]
- 6.Telford WG, Murga M, Hawley T, Hawley RG, Packard BZ, Komoriya A, Haas F, Hubert C. DPSS yellow-green 561 nm lasers for improved fluorochrome detection by flow cytometry. Cytometry A. 2005;68A:36–44. doi: 10.1002/cyto.a.20182. [DOI] [PubMed] [Google Scholar]
- 7.Gmachl C, Sivco DL, Colombelli R, Capasso F, Cho AY. Ultra-broadband semiconductor laser. Nature. 2002;415:883–887. doi: 10.1038/415883a. [DOI] [PubMed] [Google Scholar]
- 8.Sun JH, Gale BJ, Reid DT. Composite frequency comb spanning 0.4–2.4 micron from a phase-controlled femtosecond Ti:sapphire laser and synchronously pumped optical parametric oscillator. Opt Lett. 2007 Jun 1;32(11):1414–6. doi: 10.1364/ol.32.001414. [DOI] [PubMed] [Google Scholar]
- 9.Birks TA, Wadsworth WJ, Russell PS. Supercontinuum generation in tapered fibers. Opt Lett. 2000;25:1415–1417. doi: 10.1364/ol.25.001415. [DOI] [PubMed] [Google Scholar]
- 10.Nowak GA, Kim J, Islam MN. Stable supercontinuum generation in short lengths of conventional dispersion-shifted fiber. Appl Opt. 1999;38:7364–7369. doi: 10.1364/ao.38.007364. [DOI] [PubMed] [Google Scholar]
- 11.Kapoor V, Subach FV, Kozlov VG, Grudinin A, Verkhusha VV, Telford WG. New lasers for flow cytometry: filling the gaps. Nature Methods. 2007;4:678–679. doi: 10.1038/nmeth0907-678. [DOI] [PubMed] [Google Scholar]
- 12.Hawley RG, Lieu FHL, Fong AZC, Hawley TS. Versatile retroviral vectors for potential use in gene therapy. Gene Ther. 1994;1:136–138. [PubMed] [Google Scholar]
- 13.Verkhusha VV, Lukyanov KA. The molecular properties and applications of Anthozoa fluorescent proteins and chromoproteins. Nature Biotechnol. 2004;22:289–296. doi: 10.1038/nbt943. [DOI] [PubMed] [Google Scholar]
- 14.Shaner NC, Campbell RE, Steinbach PA, Giepmans BNG, Palmer AE, Tsien RY. Improved monomeric red, orange and yellow fluorescent proteins derived from Discosoma sp. red fluorescent proteins. Nature Biotechnol. 2004;22:1567–1572. doi: 10.1038/nbt1037. [DOI] [PubMed] [Google Scholar]
- 15.Chudakov DM, Lukyanov S, Lukyanov KA. Fluorescent proteins as a toolkit for in vivo imaging. Trends Biotech. 2005;23:605–613. doi: 10.1016/j.tibtech.2005.10.005. [DOI] [PubMed] [Google Scholar]
- 16.Shcherbo D, Merzlyak EM, Chepurnykh TV, Fradkov AF, Ermakova GV, Solovieva EA, Lukyanov KA, Bogdanova EA, Zaraisky AG, Lukyanov S, Chudakov DM. Bright far-red fluorescent protein for whole-body imaging. Nature Methods. 2007;4:741–746. doi: 10.1038/nmeth1083. [DOI] [PubMed] [Google Scholar]
- 17.Kapoor V, Karpov V, Linton C, Subach FV, Verkhusha VV, Telford WG. Solid state yellow and orange lasers for flow cytometry. Cytometry A. doi: 10.1002/cyto.a.20563. In press. [DOI] [PMC free article] [PubMed] [Google Scholar]
- 18.Chase ES, Hoffman RA. Resolution of dimly labeled particles: a practical measure of fluorescent sensitivity. Cytometry. 1998;33:267–279. [PubMed] [Google Scholar]
- 19.Bigos M. Separation index: An easy-to-use metric for evaluation of different configurations on the same flow cytometer. In: Robinson JP, et al., editors. Current Protocols in Cytometry. New York, NY: John Wiley and Sons; 2007. pp. 1.21.1–1.21-6. [DOI] [PubMed] [Google Scholar]
- 20.Kano H, Hamaguchi HO. Supercontinuum dynamically visualizes a dividing single cell. Anal Chem. 2007;79:8967–8973. doi: 10.1021/ac071416z. [DOI] [PubMed] [Google Scholar]
- 21.Frank JH, Elder AD, Swartling J, Venkitaraman AR, Jeyasekharan AD, Kaminski CF. A white light confocal microscope for spectrally resolved multidimensional imaging. J Microsc. 2007;227:203–215. doi: 10.1111/j.1365-2818.2007.01803.x. [DOI] [PubMed] [Google Scholar]
- 22.Grant DM, Elson DS, Schimpf D, Dunsby C, Requejo-Isidro J, Auksorius E, Munro I, Neil MA, French PM, Nye E, Stamp G, Courtney P. Optically sectioned fluorescence lifetime imaging using a Nipkow disk microscope and a tunable ultrafast continuum excitation source. Opt Lett. 2005;30:3353–3355. doi: 10.1364/ol.30.003353. [DOI] [PubMed] [Google Scholar]
- 23.Tada J, Kono T, Suda A, Mizuno H, Miyawaki A, Midorikawa K, Kannari F. Adaptively controlled supercontinuum pulse from a microstructure fiber for two-photon excited fluorescence microscopy. Appl Opt. 2007;46:3023–3030. doi: 10.1364/ao.46.003023. [DOI] [PubMed] [Google Scholar]


