Abstract
Aminoglycosides enter inner ear hair cells across their apical membranes via endocytosis, or through the mechanoelectrical transduction channels in vitro, suggesting that these drugs enter cochlear hair cells from endolymph to exert their cytotoxic effect. We used zebrafish to determine if fluorescently tagged gentamicin (GTTR) also enters hair cells via apically located calcium-sensitive cation channels and the cytotoxicity of GTTR to hair cells. We then examined the serum kinetics of GTTR following systemic injection in mice and which murine cochlear sites preferentially loaded with systemically administered GTTR over time by confocal microscopy. GTTR is taken up by, and is toxic to, wild-type zebrafish neuromast hair cells. Neuromast hair cell uptake of GTTR is attenuated by high concentrations of extracellular calcium or unconjugated gentamicin and is blocked in mariner mutant zebrafish, suggestive of entry via the apical mechanotransduction channel. In murine cochleae, GTTR is preferentially taken up by the stria vascularis compared to the spiral ligament, peaking 3 h after intra-peritoneal injection, following GTTR kinetics in serum. Strial marginal cells display greater intensity of GTTR fluorescence compared to intermediate and basal cells. Immunofluorescent detection of gentamicin in the cochlea also revealed widespread cellular labeling throughout the cochlea, with preferential labeling of marginal cells. Only GTTR fluorescence displayed increasing cytoplasmic intensity with increasing concentration, unlike the cytoplasmic intensity of fluorescence from immunolabeled gentamicin. These data suggest that systemically administered aminoglycosides are trafficked from strial capillaries into marginal cells and clear into endolymph. If so, this will facilitate electrophoretically driven aminoglycoside entry into hair cells from endolymph. Trans-strial trafficking of aminoglycosides from strial capillaries to marginal cells will be dependent on as-yet-unidentified mechanisms that convey these drugs across the intra-strial electrical barrier and into marginal cells.
Keywords: blood–labyrinth barrier, ototoxicity, aminoglycosides, cochlea, hair cells, marginal cells
Introduction
The mechanisms by which systemically administered aminoglycosides enter the cochlear fluids and tissues remain poorly understood, although their ototoxic effects—including deafness and vestibular dysfunction—are well-known. Pharmacokinetic studies show greater loading of perilymph and the organ of Corti with systemically administered aminoglycosides, compared to endolymph (Tran Ba Huy et al. 1986; Tran Ba Huy et al. 1981; Tran Ba Huy et al. 1983) suggesting that hair cells take up aminoglycosides across their basolateral membranes and perilymph. Recent studies show that aminoglycosides can enter inner ear sensory hair cells by (1) permeating the mechanoelectrical transduction (MET) channels at the tips of stereocilia in vitro (Marcotti et al. 2005) or (2) apical endocytosis (Hashino and Shero 1995). If aminoglycosides enter hair cells across their apical membrane in vivo, this implies that these drugs penetrate into the endolymphatic scala media of the inner ear, as hypothesized from cochlear perfusion experiments (Aran et al. 1999; Takada et al. 1985), prior to entering hair cells to exert their cytotoxic effect. Yamane et al. (1988) demonstrated kanamycin immunolabeling in the lumenal cells facing the scala media within 30 min following systemic injection. Recently, Dai and Steyger (2008) reported competitive inhibition of systemically administered fluorescently conjugated gentamicin (GTTR) uptake by the unconjugated drug into marginal cells. These data suggest that, in vivo, aminoglycosides traverse the strial blood–labyrinth barrier (BLB) to load endolymph and enter hair cells across their apical membrane by permeating cation channels and/or by endocytosis.
In the cochlea, systemically administered aminoglycosides are localized in the organ of Corti including hair cells (Hiel et al. 1993; Tachibana et al. 1985; Yamane et al. 1988) and the spiral ganglion neurons (Bareggi et al. 1986; Kitahara et al. 2005), with only brief descriptions in the stria vascularis (Balogh et al. 1970; Bareggi et al. 1986; Imamura and Adams 2003; Yamane et al. 1988). Each of these locations are also labeled by fluorescently conjugated gentamicin administered systemically as a fractional tracer of native drug trafficking. However, the unconjugated drug competes with GTTR for binding sites and regulatable trafficking routes (Dai and Steyger 2008; Myrdal et al. 2005), potentially affecting its distribution.
We used zebrafish to verify whether purified GTTR permeates apical cation channels into neuromast hair cells and the cytotoxicity of GTTR. We then used mice to determine the serum kinetics of GTTR and gentamicin individually and to compare the cochlear distribution of purified GTTR (i.e., in the absence of the unconjugated drug) with immunolabeled gentamicin. Finally, dose-fluorescence intensity curves were determined for both GTTR and immunolabeled gentamicin. The results show that purified GTTR (1) enters neuromast hair cells via apical cation channels, (2) is toxic to hair cells, (3) preferentially loads the stria vascularis in the cochlea. In addition, (4) systemically administered GTTR rapidly reaches murine hair cells, (5) the distribution of purified GTTR in the cochlea was similar to the distribution of immunolabeled gentamicin, and (6) increasing doses of GTTR, but not gentamicin, correspond to increased cytoplasmic fluorescence.
Methods
Conjugation and purification of GTTR An excess of gentamicin (in K2CO3, pH 10) was mixed with Texas Red (TR) succinimidyl esters (Invitrogen, CA) to minimize the possibility of over-labeling individual gentamicin (GT) molecules with more than one TR molecule and to ensure the polycationic nature of the conjugate (GTTR), as previously described (Sandoval et al. 1998). After conjugation, the reaction mixture was separated by reversed phase chromatography using C-18 columns (Burdick and Jackson, Muskegon, MI) to purify the conjugate from unconjugated gentamicin and potential contamination by unreacted TR (Myrdal et al. 2005). The isolated GTTR conjugate was aliquoted, lyophilized, and stored desiccated, in the dark at -20°C until required.
Zebrafish Wild-type and mariner zebrafish larvae, 5 days after fertilization, were treated with a dose range of gentamicin, GTTR, or unconjugated Texas Red (up to 100 mg/ml in standard E3 medium (Mullins et al. 1994; Westerfield 1993) for 1 h and allowed to recover for 4 h prior to fixation in 4% formaldehyde containing 0.5% Triton X-100 (Myrdal et al. 2005). Larvae were then labeled with Alexa-488-conjugated phalloidin to determine the number of surviving hair cell bundles by confocal microscopy, similar to that described previously by Harris et al (2003). For time course studies, wild-type and mariner zebrafish larvae were treated with 1.6 mg/ml GTTR or unconjugated Texas Red for up to 20 min prior to washing, fixation, and phalloidin labeling as described above. For competition studies, wild-type zebrafish larvae were treated with 1.6 mg/ml GTTR with or without 10 mM Ca++ or 1.6 mg GT for 10 min, prior to fixation and phalloidin labeling.
Mice Mice (C57/BL6; 21–28 days old) received one intra-peritoneal (i.p.) injection of 2 mg/kg GTTR (in phosphate-buffered saline (PBS), pH 7.4) and at various time points (10, 20, and 30 min and 3, 6, 9, and 24 h) were anesthetized and serum collected prior to cardiac perfusion with PBS, then 4% formaldehyde. Cochleae and kidneys were excised and post-fixed in 4% formaldehyde containing 0.5% Triton X-100 for 45 min, washed, labeled with Alexa-488-conjugated phalloidin, rinsed, and post-fixed with 4% formaldehyde (Myrdal et al. 2005). Alternatively mice received 0.2, 2, 20, or 200 mg GT, prior to the above procedures. Serum levels of GTTR and gentamicin were determined using standard diagnostic particle-enhanced turbidimetric inhibition immunoassay methods (Newman et al. 1992) on a Beckman Synchron Drug Calibrator 3 Plus, with a sensitivity of 0.5 mg/ml.
For cryostat sections, cochleae were decalcified in 10% ethylenediaminetetraacetic acid (EDTA) containing 2% formaldehyde for 1 week at 4°C (EDTA plus fixative solution replaced daily), infiltrated with OCT, cryostat sectioned at 8 mm, and mounted on gelatin-coated glass slides. For high resolution confocal microscopy of wholemounted tissues, cochleae were rinsed, the bone covering the basal coil of the cochlea removed and the lateral wall (spiral ligament and stria vascularis) excised. Kidneys were vibrotome-sectioned at 100 mm. All GTTR-treated specimens were then labeled with Alexa-488-conjugated phalloidin to localize filamentous actin. In some cases, the fixed and excised lateral wall was cut into thin slices using a fresh scalpel blade for each cut and positioned between thin agar strips, with the cut surfaces parallel to the slide, to present a “cross-sectioned” lateral wall for image acquisition as high resolution xy optical sections.
Immunocytochemistry For immunolocalization of GT, specimens were immunoblocked in 10% goat serum in PBS for 30 min and then incubated with 50 mg/ml rabbit polyclonal anti-GT antisera (American Qualex, San Clemente, CA) for 1 h. After washing with 1% goat serum in PBS, specimens were further incubated with 20 mg/ml Alexa-488-conjugated goat-anti-rabbit antisera (Molecular Probes, Eugene, OR) for 45 min, washed, counter-labeled with Alexa-568-conjugated phalloidin, post-fixed with 4% formaldehyde for 15 min, and washed again. For immunocytochemical controls, primary antiserum was omitted or replaced with GT-adsorbed antiserum and immunoprocessed as above.
Cell culture Madin-Darby canine kidney distal tubule (MDCK) cells were cultured in antibiotic and phenol red-free Dulbecco’s minimal essential medium (MEMa, Invitrogen, Ca) with 10% fetal bovine serum at 37°C with 5% CO2, 95% air. For experiments, cells were seeded into eight-well coverglass chambers (ISC BioExpress) at 3,000 cells/well and grown for 5 days, when they had become confluent, cuboidal, and had time to develop tight junctions. Cells were washed three times with phosphate-buffered saline (containing 1.25 mM calcium) and treated with a dose range of GTTR for 30 s at 20°C (precluding endocytosis). Following treatment, cells were rinsed three times with buffer then fixed and delipidated with 4% formaldehyde plus 0.5% Triton X-100 (FATX) for 45 min. Following fixation, cells were thoroughly rinsed with phosphate buffered saline (Invitrogen, CA) prior to imaging. Live cells were also incubated with a dose range of GT for 30 s, prior to rinsing, fixation as above, and then subsequent immunolabeling procedures as described above.
Imaging All specimens were mounted on slides, immersed in VectaShield (Vector Labs, CA), coverslipped and examined using a Bio-Rad MRC 1024 ES laser scanning confocal system attached to a Nikon Eclipse TE300 inverted microscope. Alexa-488 and Texas Red images were collected sequentially using 1,024 × 1,024-pixel box size using a 60× lens (n.a. 1.4) with an xy resolution = 230 nm and xz resolution = 440 nm (Steyger et al., 2003). All specimens were imaged at the same laser intensity and gain settings, including control tissues. Each time point or dose group (n ≥ 3) was conducted simultaneously with the standard time point (30 min) group, against which ratiometric image analysis was conducted (see below). Representative images from each experiment were identically prepared for publication using Adobe Photoshop.
Image analysis For image analysis, optical sections from each experimental set were identified and regions of interest (marginal cells [minus nuclei], intra-strial tissues [putatively intermediate cells], basal cells, and fibrocytes) were manually segmented for pixel intensity determination (ImageJ, NIH). To normalize data between experimental sets, the mean intensity was ratioed against the standard (intensity of marginal cells 30 min after GTTR only injection) and plotted. Student’s t test was used to determine any significant difference between time points, dosing groups or for regions of interest in the same specimens.
Results
GTTR enters zebrafish neuromast hair cells and is toxic
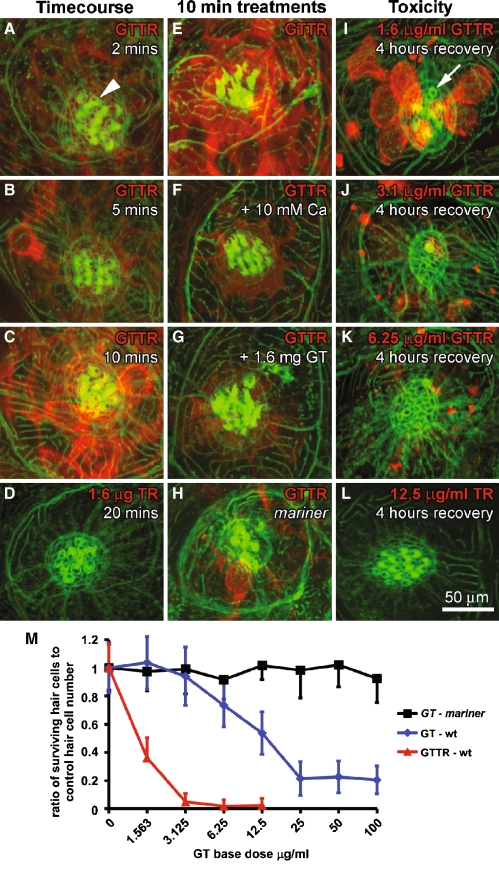
GTTR uptake by zebrafish neuromast hair cells is cumulative over time (1.6 mg/ml, 2–20 min), and is preferentially localized within the hair cell cytoplasm (Fig. 1A–C, E, G). Alexa-488-conjugated phalloidin labeling of filamentous actin present in the hair bundle and cuticular plate enabled visualization of these apical structures (Fig. 1). Fish treated with the same dose of unconjugated fluorophore (1.6 mg/ml, 20 min) did not reveal any Texas Red fluorescence (Fig. 1D). The addition of 10 mM Ca++ to extracellular medium significantly reduced GTTR fluorescence intensity in hair cells (57.3 ± 19.8 standard deviation [SD], n = 7 neuromasts, p < 0.0005; Fig. 1F) compared to control hair cells (144.9 ± 13.8 SD, n = 7 neuromasts, Fig. 1E). The addition of 1.6 mg/ml GT to extracellular medium also significantly reduced GTTR fluorescence in hair cells (60.9 ± 10.5 SD, n = 7 neuromasts, p < 0.0001; Fig. 1G) compared to control hair cells (123.9 ± 18.3, n = 7; similar to Fig. 1E).
FIG. 1.
GTTR enters zebrafish neuromast hair cells and is cytotoxic. A–C Neuromast hair cells can be identified by phalloidin-labeled (green) cuticular plates (arrowhead). GTTR uptake (red) by hair cells is cumulative over time (2–10 min), and is preferentially localized within the cytoplasm. D Neuromast hair cells treated with the same dose of unconjugated Texas Red for 20 min display negligible Texas Red fluorescence. E Neuromast hair cells incubated with GTTR for 10 min display robust GTTR fluorescence. F Neuromasts treated with GTTR plus 10 mM Ca++ for 10 min display reduced GTTR fluorescence in hair cell somata compared to (E). G Neuromast treated with GTTR plus 1.6 mg GT for 10 min also display reduced GTTR fluorescence in hair cell somata compared to (E). H Mariner mutant zebrafish treated with GTTR for 10 min show reduced GTTR uptake in neuromast hair cells compared to (E). I After 1 h of treatment with GTTR (1.6 mg/ml) and 4 h recovery, GTTR fluorescence is present the cytoplasm of many surviving, but not all (arrow), hair cells. Increasing doses of GTTR decreased the number of surviving hair cells after 4 h of recovery (I–K). L Unconjugated Texas Red at the highest dose (12.6 mg/ml) is not detected in hair cells and all hair cells survived treatment. M Increasing doses of GT and GTTR decreased the number (or ratio) of surviving hair cells in wild-type zebrafish neuromasts in a dose-dependent manner (n ≥ 15 neuromasts/dose; untreated age-matched fish provided the control hair cell number in each neuromast, 14 ± 2.7 SD; n = 82). Increasing doses of GT did not decrease the number of hair cells in neuromasts (n ≥ 11/dose) of mariner mutant zebrafish.
Mariner zebrafish has defective myosin VIIa that is critical for mechanotransduction by hair cells (Ernest et al. 2000). To determine the contribution of the MET channel to GTTR entry into hair cells, we compared the intensity of GTTR fluorescence in wild-type neuromast hair cells to those in mariner mutant zebrafish after 10 min exposure. In mariner zebrafish, GTTR fluorescence in most neuromast hair cells was significantly reduced (41.6 ± 8 SD, n = 11, p < 0.005; Fig. 1H) compared to neuromast hair cells in wild-type zebrafish (similar to Fig. 1E), although occasionally a single hair cell within a mariner neuromast may exhibit bright GTTR fluorescence (Fig. 1H).
To verify that GTTR retained the cytotoxic properties of native gentamicin, neuromast hair cell survival was determined following gentamicin or GTTR administration to zebrafish larvae. Alexa-488-conjugated phalloidin labeling of the hair bundle and cuticular plate enabled determination of the number of surviving hair cells. Although hair cell bodies can survive ototoxic treatment without their hair bundles (Gale et al. 2002), cleavage of the hair bundle is a cytotoxic event and the surviving cell body would be indicated by GTTR fluorescence. After exposure to GTTR for 1 h, followed by 4 h of recovery, the number of surviving neuromast hair cells decreased (Fig. 1I–K). Similar treatment with unconjugated Texas Red at the highest dose (12.6 mg/ml) revealed no Texas Red fluorescence within the neuromast and no loss of hair cell apices (Fig. 1L). To quantify this decrease, untreated controls provided a baseline for hair cell number in zebrafish neuromasts (14 ± 2.7 SD; n = 82). Both native gentamicin and GTTR decreased hair cell numbers in a dose-dependent manner (Fig. 1M). Mariner neuromast hair cells did not show susceptibility to gentamicin treatment (Fig. 1M). Treatment with hydrolyzed Texas Red did not decrease hair cell numbers (data not shown).
GTTR entry into the cochlea: cryostat sections
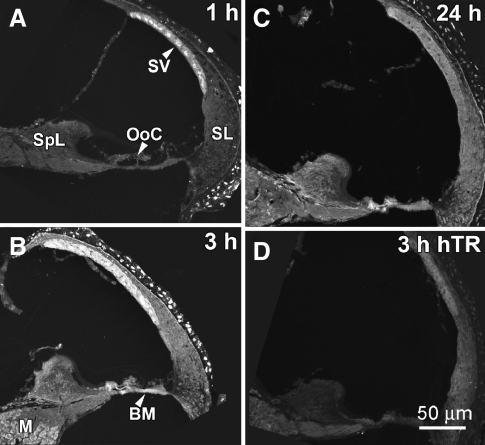
Following injection of 2 mg/kg GTTR into mice, weak GTTR fluorescence could be observed in the stria vascularis within 10 minutes. After 1 hour, intra-cochlear GTTR fluorescence was largely associated with the stria vascularis (Fig. 2A), as well as in the bony cochlear shell (not shown). Less intense fluorescence was observed in the spiral ligament, spiral limbus, and organ of Corti (Fig. 2A). After 3 h, the intensity of fluorescence was increased in each of these intra-cochlear locations, yet remained most prominent in the stria vascularis (Fig. 2B). Modest GTTR fluorescence was observed in the modiolus, organ of Corti, spiral ligament, and spiral limbus and more intensely in the basilar membrane. After 24 h, cryostat sections revealed loss of GTTR fluorescence in each of these intra-cochlear locations compared to that observed at 3 h, particularly in the stria vascularis. Three hours after injection of hydrolyzed TR (hTR), only weak fluorescence could be observed in tissue areas of cryostat sections (Fig. 2D) compared to sections from mice injected with GTTR (Fig. 2A–C).
FIG. 2.
Cochlear uptake of GTTR in cryostat sections. A One hour after i.p. injection, intra-cochlear GTTR fluorescence was largely associated with the stria vascularis (SV). Less intense fluorescence could be observed in the spiral ligament (SL), spiral limbus (SpL), and organ of Corti (OoC). B After 3 h, increased fluorescence occurred in each of these locations, and also in the modiolus (M) and at the basilar membrane (BM). C After 24 h, GTTR fluorescence was diminished at all locations. D Three hours after i.p. injection of hydrolyzed Texas Red (hTR), only weak tissue fluorescence could be observed. All images are from upper basal coil. Images acquired and post-processed identically.
Cellular distribution of GTTR in the whole-mounted lateral wall
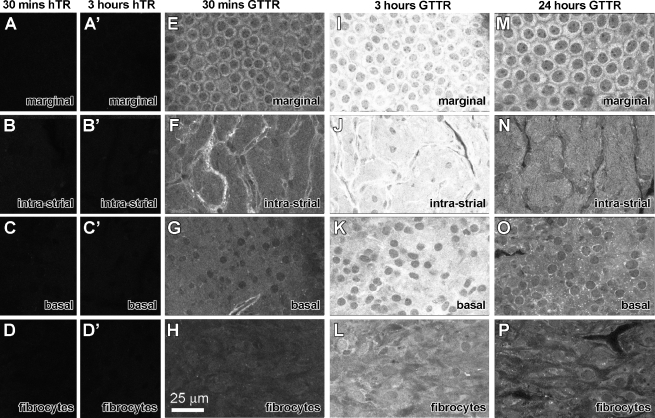
Cryostat-sectioned tissues are inadequate for high resolution imaging due to (1) cellular disruption, particularly in the organ of Corti and lateral wall that contain a variety of heterogeneous cell types and (2) loss of 3-dimensional stacks of optical sections that assist accurate cellular identification. Therefore, high resolution imaging and quantitative analysis of GTTR fluorescence (pixel intensity) was conducted on whole-mounted lateral wall from the basal region of the cochlea that exhibited the most rapid increase in GTTR fluorescence. As in cryosections, there was negligible autofluorescence associated with the whole-mounted lateral wall, including the stria vascularis, from the basal region of the cochlea (data not shown). The focal planes for control images were identified by phalloidin labeling of actiniferous strial structures (e.g., junctional complexes of marginal cells, basal cells) in the green channel (data not shown). Mice injected with hydrolyzed Texas Red (hTR) displayed negligible TR fluorescence in whole-mounted lateral wall 30 min or 3 h after injection (Fig. 3A–D, A′–D′). Control hTR images were acquired using the same laser intensity and confocal settings as tissues from mice dosed with GTTR. Lateral wall whole-mounts from mice injected with 2 mg/kg GTTR and allowed to recover for the same time periods displayed substantial GTTR fluorescence (Fig. 3E–L) compared to control tissues (Fig. 3A–D, A′-D′).
FIG. 3.
Strial uptake and clearance of GTTR. A–D Thirty minutes after i.p. injection of hTR, negligible fluorescence is observed in the different focal planes of a whole-mounted lateral wall (Focal planes determined by corresponding Alexa-488-conjugated phalloidin-labeled image obtained during sequential imaging). A′–D′ Three hours after i.p. injection of hTR, negligible fluorescence is observed in the different focal planes of a whole-mounted lateral wall. E–H GTTR fluorescence in the cytoplasm of marginal cells delineating their nuclei (E), intra-strial tissues (F), basal cells (G), and very weakly in type I fibrocytes (H) 30 min after injection. Note the increased fluorescence in tissues surrounding the strial capillaries in F. I–L Three hours after injection, increased GTTR fluorescence in the cytoplasm of marginal cells, with less intense GTTR fluorescence in intra-strial tissues, basal cells, and fibrocytes in the same focal series. M–P Twenty-four hours after injection, decreased GTTR fluorescence in marginal cells (M), intra-strial tissues (N), basal cells (O) and in spiral ligament type 1 fibrocytes (P) compared to the 3-h time point. All tissues from basal coil of cochlea. Images acquired and post-processed identically.
In the stria vascularis, weak GTTR fluorescence was first detected in the marginal cells at the earliest time point after injection (10 min), but not in the intra-strial tissues (putatively the intermediate cells and intra-strial space, between the strial capillaries, basal cells of the stria vascularis, and the fibrocytes of the spiral ligament (data not shown). After 30 min, significantly more GTTR fluorescence occurred in marginal cells, intra-strial tissues, intra-strial capillaries, basal cells, and in fibrocytes of the spiral ligament (Fig. 3E–H). At 30 min, GTTR fluorescence in the cytoplasm of marginal cells was diffuse, delineating their nuclei (Fig. 3E). GTTR fluorescence in the intra-strial tissues, basal cells, and fibrocytes of the same focal series was less intense (Fig. 3F–H). The tissues associated with the strial capillaries displayed more intense GTTR fluorescence than the surrounding intra-strial tissues and basal cells (Fig. 3F, G). The fibrocytes radially adjacent to the stria vascularis were less intensely labeled than any of the cell types comprising the stria vascularis (Figs. 3H and 4).
FIG. 4.
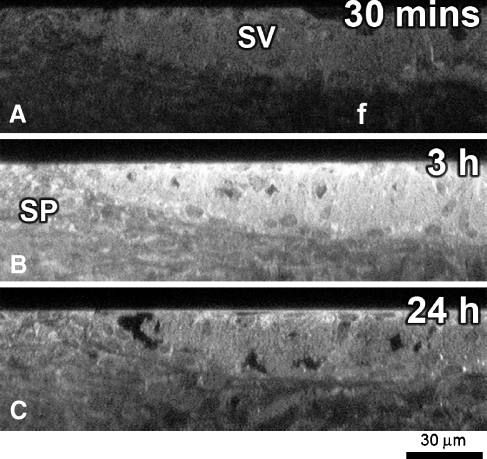
GTTR fluorescence is more intense in strial cells. A Thirty minutes after injection, GTTR fluorescence is preferentially localized in the stria vascularis, compared to type I fibrocytes (f) in the spiral ligament. B Three hours after injection, increased GTTR fluorescence in the stria vascularis and spiral ligament. Note the increased fluorescence in the spiral prominence (SP) compared to type I fibrocytes radial to the stria vascularis (apparent at all time points). C Decreased GTTR fluorescence in lateral wall tissues 24 h after injection, compared to (B). Note the similarity of fluorescence between spiral prominence and stria vascularis and the comparatively reduced fluorescence in the region of type I fibrocytes. All tissues from basal coil. Images acquired and post-processed identically.
Three hours after injection, intense GTTR fluorescence was observed in the cytoplasm of marginal cells, with some fluorescence visible within their nuclei (Fig. 3I). The intra-strial tissues, basal cells, and fibrocytes were also more intensely labeled than at earlier time points, though not as intensely as marginal cells (Fig. 3J–L). Basal cells were relatively more fluorescent 3 h after injection (almost as intense as intra-strial tissues; Fig. 3K) compared to earlier time points. Fibrocytes in the adjacent spiral ligament also displayed more fluorescence than earlier time points, but still less than strial cells (Figs. 3L and 4). The highest GTTR intensities were observed in tissues associated with strial capillaries; however, these structures could not be accurately segmented for image analysis (see below).
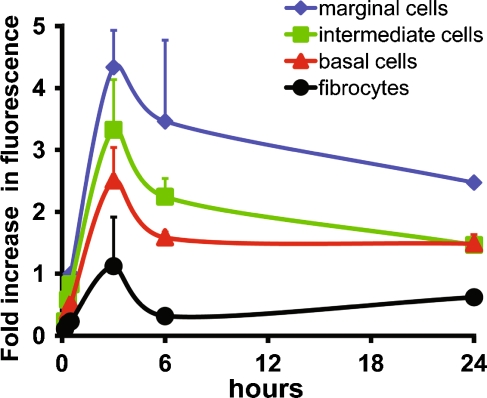
At 6 and 24 h after injection, progressively less fluorescence is seen at each of the strial locations compared to their peak at 3 h (Fig. 3M–P). However, the spiral ligament showed a heterogeneous uptake pattern. The spiral prominence region between the basilar membrane and stria vascularis appeared to display greater GTTR uptake and retention compared to type 1 fibrocytes immediately radial to the stria vascularis (Fig. 4). Both regions show increasing GTTR until the 3-h time point, with substantial clearance at the 6-h time point (Fig. 5). However, 24 h after administration, GTTR fluorescence in basal cells and type I fibrocytes appeared similar to that at 6 h (Figs. 4 and 5).
FIG. 5.
GTTR fluorescence is more intense in marginal cells. The fluorescent intensity of marginal cells (cytoplasm only), intra-strial tissues, basal cells, and type I fibrocytes at any given time point in xy optical sections ratioed against that of marginal cells at 30 min. Marginal cells were consistently more intensely labeled with GTTR than other cells. Intra-strial tissues and basal cells are also consistently more intense than type I fibrocytes. GTTR fluorescence generally decreased in intensity in all lateral wall tissues following the peak in fluorescence at 3 h. Note the similar intensity of GTTR fluorescence in basal cells and type 1 fibrocytes at 24 h compared to 6-h time point. All cells from basal coil images acquired and post-processed identically. Some error bars obscured by data symbols.
Image analysis of strial GTTR uptake
Pixel intensity analysis of each cell type from high resolution xy optical sections at each time point corroborated our confocal microscopy observations. All strial cells consistently displayed more GTTR fluorescence than type I fibrocytes (Fig. 5). Marginal cells were consistently brighter than the other strial cell types at each time point. GTTR fluorescence peaked in all cell types after 3 h and generally declined thereafter (Fig. 5). However, GTTR fluorescence in basal cells appeared relatively stable and to increase in type 1 fibrocytes, between 6 and 24 h.
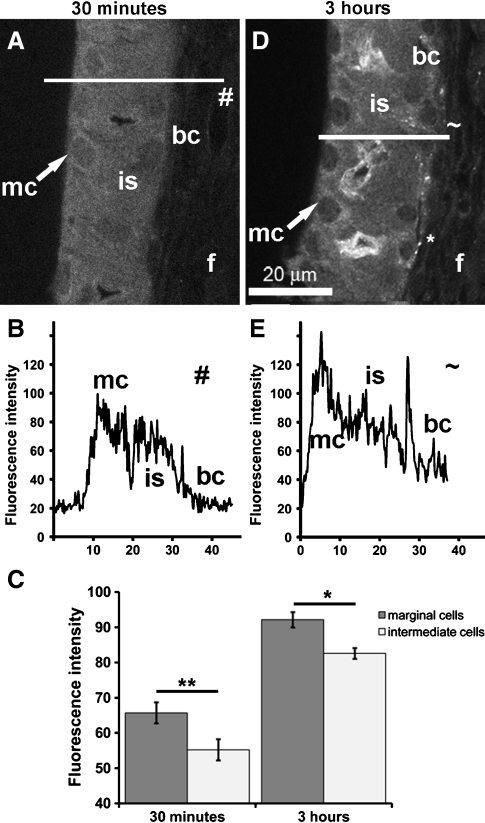
The focal depth of intra-strial tissues is greater than for marginal cells lying closest to the coverslip in whole-mounted tissues. This orientation could potentially reduce GTTR fluorescence in intra-strial tissues due to optical dispersion of emitted light by the overlying marginal cells (Egner and Hell 2006). To determine if intermediate cells had less cytoplasmic GTTR fluorescence (compared to marginal cells), thin slices of lateral wall tissues mounted end-on between thin agar strips to present a “cross-sectioned” lateral wall for high resolution xy imaging (Fig. 6A, B). In these images, line intensity plots (Fig. 6B, E) show a reduction in GTTR fluorescence in intra-strial tissues and basal cells compared to marginal cells. Segmentation of cytoplasmic regions from marginal cells and intra-strial tissues (excluding the strial capillary tissues) from both 30 min (Fig. 6C; p < 0.001, n = 8) and 3 h (Fig. 6C; p < 0.05, n = 8) tissues revealed that GTTR fluorescence in the cytoplasm of marginal cells was statistically greater than in intra-strial tissues.
FIG. 6.
Marginal cells are brighter than intra-strial tissues. High resolution xy optical sections of strial cells and the spiral ligament whole-mounted end-on to give a “cross-sectioned” image. A GTTR fluorescence in marginal cells (mc) and intra-strial tissues (is), with markedly reduced fluorescence in basal cells (bc) and type 1 fibrocytes (f) 30 min after injection. B Plot profile of line # delineated in (A) showing different levels of GTTR in different strial layers. C Segmentation of cytoplasmic fluorescence in marginal and intra-strial tissues only (no capillary-associated fluorescence) reveals statistically greater GTTR fluorescence in marginal cells 30 min (data from two mice, four samples each; **p < 0.005) and 3 h (excluding strial capillary tissues; data from two mice, four samples each; *p < 0.05) after injection. D GTTR fluorescence in marginal cells (mc), and intra-strial tissues (is), with markedly increased fluorescence in basal cells (bc) and type 1 fibrocytes (f) 3 h after injection. E Plot profile of line ~delineated in (D) showing different levels of GTTR in different strial layers. All tissues from basal coil. Images acquired and post-processed identically.
Gentamicin immunofluorescence in the cochlea
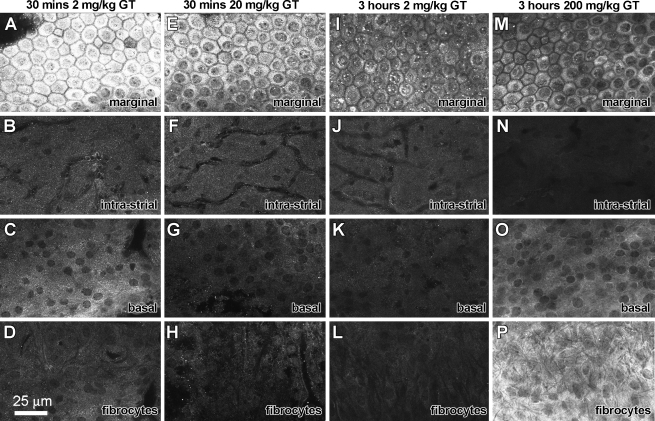
To verify that the distribution of GTTR in the murine cochlea correlated with that of the native drug, mice were injected with unconjugated gentamicin (0.2, 2, 20, and 200 mg/kg) that was then localized using immunofluorescence. Gentamicin immunolabeling occurred throughout the cochlea. In the stria vascularis, GT was intensely localized in marginal cells, regardless of dose given, or time following injection (Fig. 7). The nucleoplasm of marginal cells displayed weak labeling revealing unlabeled, nucleoli-like structures present within the nucleus (Fig. 7A, E, I, M) as previously described for gentamicin-immunolabeled kidney cells (Myrdal et al. 2005). Less intense fluorescence was present in intermediate cells and fibrocytes of the spiral ligament. Strial capillaries were not distinctly labeled at 30 min (Fig. 7B, F) in contrast to GTTR-labeled strial capillaries at the same time point (Fig. 3F). Only at high doses of GT administration (200 mg/kg) 3 h after i.p. injection were fibrocytes more intensely labeled than marginal, intermediate or basal cells (Fig. 7M–P). Immunocytochemical controls (omission of primary antisera or GT-adsorbed primary antisera) had negligible fluorescence (data not shown).
FIG. 7.
GT immunofluorescence in the stria vascularis. A, E GT is intensely localized in marginal cells 30 min after a 2 mg/kg i.p. injection. The nucleoplasm of marginal cell nuclei displayed weak labeling, revealing unlabeled, nucleoli-like structures (A, E, I). Weak GT immunofluorescence occurred in intermediate cells (B, F, J, N), basal cells (C, G, K, O) and fibrocytes of the spiral ligament (D, H, L). Strial capillaries were not distinctly labeled in intra-strial tissues (B, F, J, N). P At high doses of GT administration (200 mg/kg) 3 h after i.p. injection, fibrocytes are more intensely labeled than marginal, intermediate or basal cells (M–P). All tissues from basal coil. Images acquired and post-processed identically.
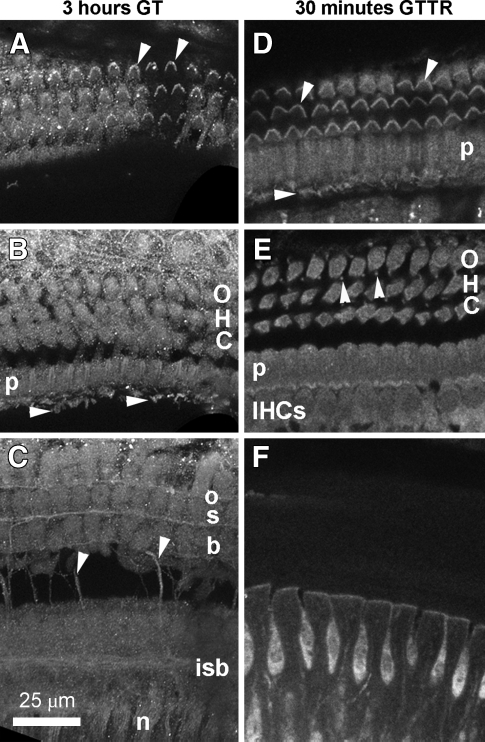
In the organ of Corti, GT immunolabeling was similar at 30 min and 3 h after i.p. injection. GT was immunolocalized in the majority of cells, including the apical mechanosensory bundles of hair cells (Fig. 8A, B). The soma of hair cells, pillar cells, the remaining supporting cells, and spiral ganglion cells were labeled with approximately equal fluorescent intensity, as were nerve fibers proximal to the habenula (Fig. 8B, C). The cellular distribution of purified GTTR (2 mg/kg) in the organ of Corti after 30 min (Fig. 8E–F) was similar to that for immunolabeled GT (Fig. 8A–C) at the same time points and as described previously (Dai and Steyger 2008; Dai et al. 2006). Both GTTR (Fig. 8F) and immunolabeled GT (data not shown) were present in the interdental cells of the spiral limbus within 30 min. In addition, cells lining the surface of the basilar membrane, facing the scala tympani, exhibited fluorescence for immunolabeled GT after 30 min, and for GTTR after 3 h (data not shown).
FIG. 8.
GT immunolabeling and GTTR in the organ of Corti. A Three hours after 2 mg/kg GT injection i.p., GT was immunolocalized in stereociliary bundles (arrowheads) and apices of outer hair cells (OHCs), and in the apices of adjacent pillar and Deiters’ cells. B The cell bodies of OHCs, pillar cells (p), the remaining supporting cells are labeled with approximately equal fluorescent intensity. IHC stereocilia (arrowheads) can also be visualized in this focal plane. C as are nerve fibers (n) proximal to the habenula, transverse (arrowheads), inner spiral bundle fibers (isb), and three rows of outer spiral bundles (osb). D Thirty minutes after GTTR injection i.p., GTTR fluorescence was localized in the hair bundles of both OHCs and IHCs (arrowheads and in the apices of pillar cells (p). E The cell bodies of OHCs, IHCs, pillar cells (p), the remaining supporting cells, including the Deiters’ cell phalangeal processes (arrowheads) are labeled with approximately equal fluorescent intensity. F The interdental cells of the spiral limbus also show GTTR fluorescence at this time point. All tissues from basal coil. Images acquired and post-processed identically.
GTTR fluorescence intensity corresponds to dose
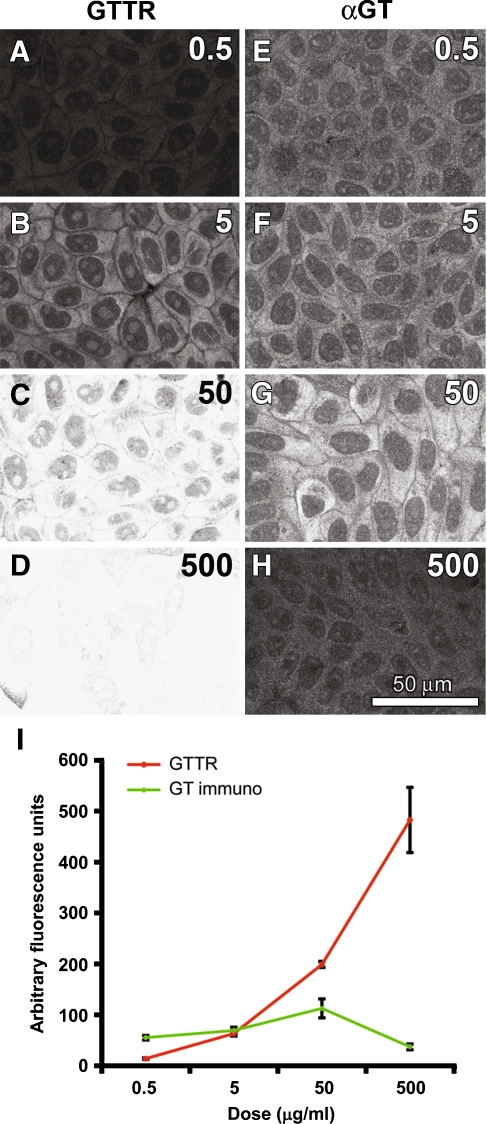
To determine whether an increasing dose resulted in increased cytoplasmic fluorescence, MDCK cells were incubated with a dose range of the fluorophore-conjugated or unconjugated drug (GTTR or GT, respectively) for 30 s, washed and fixed prior to confocal microscopy. As the GTTR dose increased, the intensity of GTTR fluorescence consistently increased (Fig. 9A–D, I). The highest dose of GTTR (500 mg/ml; Fig. 9D) saturated the majority of pixels when using the same confocal acquisition settings as at lower doses (Fig. 9A–C). Therefore, to plot the potential fluorescence intensity at this dose (Fig. 9I), we determined the ratio of fluorescence between the 50 and 500 mg/ml doses of GTTR at a lower laser power to estimate the intensity of cytoplasmic fluorescence in Figure 9D. The cellular distribution of GTTR fluorescence was consistent at different doses, with diffuse fluorescence in the cytoplasm, and discrete intra-nuclear structures visible (Fig. 9B, C) as previously described (Myrdal et al. 2005).
FIG. 9.
GTTR fluorescence, but not GT immunofluorescence, increases in intensity with increasing dose. A–D Increasing doses of GTTR increased the intensity of cytoplasmic GTTR fluorescence in MDCK cells. Diffuse GTTR fluorescence is localized in the cytoplasm, with discrete fluorescent intra-nuclear structures and trans-nuclear tubules also visible. E–H Increasing doses of GT did not increase the intensity of GT immunofluorescence. At the highest concentration of GT, reduced GT immunofluorescence is observed (H). I The intensity of GTTR fluorescence is dose-dependent, but not GT immunofluorescence. (The ratio of fluorescence intensity between 50 and 500 mg/ml GTTR doses obtained at a lower laser power provided an estimate of the pixel intensity of saturated cytoplasmic regions at the 500 mg/ml GTTR dose for this data series.) Images acquired and post-processed identically.
With increasing GT dose, there was a slight corresponding increase in the cytoplasmic intensity of GT immunofluorescence (Fig. 9E–I). At the highest GT dose, little GT immunofluorescence was observed. The distribution of GT immunolabeling was also cytoplasmic and diffuse, with some nucleoplasmic labeling as previously described (Myrdal et al. 2005).
GTTR has longer serum kinetics than gentamicin
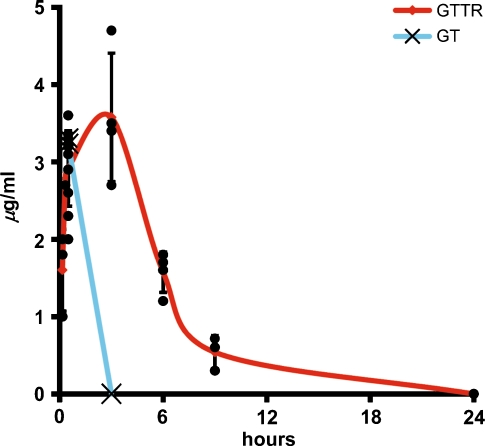
The serum levels of GT and GTTR were detected by particle-enhanced turbidimetric inhibition immunoassay (Newman et al. 1992). Within 10 min after i.p. injection, GTTR serum levels were ~1.5 mg/ml and reached 2.9 (± 0.48) mg/ml after 30 min. Serum levels of GTTR peaked at 3.58 ± 0.83 mg/ml at 3 h before falling (Fig. 10), with a half life of 130 min. Thirty minutes after injecting 2 mg/kg GT, serum levels were 3.2 ± 0.05 mg/ml; however, the presence of GT in serum was undetectable after 3 hours, giving GT a half life of less than 56 min, similar to guinea pigs (53 min) (Brummett et al. 1978). At higher doses of GT administration, correspondingly higher serum levels of GT were observed at 30 min and 3-h time points. However, no correspondence was found between serum levels of GT and intensity of gentamicin immunolabeling in cochlear tissues.
FIG. 10.
GTTR serum kinetics are slower than for GT. Following i.p. injection, GTTR reached serum levels of 2.9 ± 0.48 mg/ml within 30 min. Serum levels of GTTR peaked at 3 h (3.5 ± 0.48 mg/ml), before falling with a half-life of 130 min. For GT, serum concentrations were 3.2 ± 0.05 mg/ml after 30 min and were undetectable after 3 h (half-life ~ 56 min).
Discussion
Here, we report that purified GTTR enters zebrafish neuromast hair cells by permeating cation channels on the apical membrane and is cytotoxic. In mice, systemically administered GTTR rapidly enters marginal cells and hair cells, suggestive of a trans-strial and endolymphatic trafficking route, extending a previously proposed hypothesis (Aran et al. 1999; Takada et al. 1985).
GTTR entry into hair cells and its cytotoxicity
Neuromast hair cell uptake of GTTR was reduced by high calcium and unconjugated GT levels and in zebrafish with mutant myosin VIIa, conditions that reduce transduction current kinetics and FM1-43 uptake (Ernest et al. 2000; Gale et al. 2001; Marcotti et al. 2005; Richardson et al. 1997; Seiler and Nicolson 1999). This suggests that GTTR also enters hair cells by permeating the MET channel. The permeation of ion channels by a variety of fluorescent or organic compounds has been widely reported (Gale et al. 2001; Huang et al. 2000; Khakh et al. 1999; Meyers et al. 2003; Virginio et al. 1999), including GTTR permeation of the TRPV4 channel (Karasawa et al., 2008b). The diffuse somatic distribution of GTTR fluorescence also implies ion channel permeation, compared to fluorescent puncta characteristic of endocytotic uptake (Meyers et al. 2003; Myrdal et al. 2005).
Rodents require daily dosing with 100–700 mg/kg aminoglycosides for 10 days to induce ototoxicity (Forge 1985; Wu et al. 2001). Therefore, to efficaciously verify that GTTR is cytotoxic to hair cells, we determined the survival of zebrafish neuromast hair cells following drug treatment. Both GT and GTTR decreased surviving hair cell numbers in a dose-dependent manner. The micromolar GT toxicity curve shown here is similar to that reported previously (Ton and Parng 2005). Unconjugated Texas Red was not detected within zebrafish neuromast hair cells and did not reduce hair cell numbers. This suggests that the ‘forced’ uptake of Texas Red, via conjugation to GT, is responsible for the enhanced toxicity of GTTR compared to GT. Thus, GTTR is cytotoxic to hair cells and its uptake by hair cells can be attenuated by modulating the MET channel.
GTTR entry into the cochlea
After systemic administration, GTTR fluorescence was preferentially associated with the stria vascularis compared to the spiral ligament, organ of Corti and modiolus, confirming an earlier study (Yamane et al. 1988). Detection of aminoglycosides in the stria vascularis has been reported infrequently (Balogh et al. 1970; Bareggi et al. 1986; Imamura and Adams 2003). Biochemical detection of aminoglycosides in the lateral wall precludes determination of aminoglycoside content in the stria vascularis and spiral ligament (Fox 1989; Tran Ba Huy et al. 1986). Other studies show aminoglycoside toxicity in the stria vascularis, with concomitant loss of cochlear function, implying strial uptake of aminoglycosides (Chu et al. 2006; Conlee et al. 1989; Conlee et al. 1991; Forge and Fradis 1985; Forge et al. 1987; Kusunoki et al. 2004).
Perilymphatic perfusion of GT in vivo degrades the cochlear microphonic (CM; i.e., hair cell electrical activity), but not the endolymphatic potential, EP (Takada et al. 1985). Inhibition of strial function by furosemide or anoxia prior to GT perfusion reduced GT-induced degradation of the CM. One interpretation hypothesized carrier-mediated trafficking of GT, presumably through the stria vascularis, into endolymph to reduce the CM by blocking the transduction channel (Kroese et al. 1989; Takada et al. 1985). More recently, perilymph perfusion of physiological GT concentrations also degraded the compound action potential (CAP), but with temporal delay (Aran et al. 1999). These authors concluded that trafficking of GT into endolymph was required, since the CAP was not affected by high GT concentrations during acute perilymphatic perfusion. Systemic administration of aminoglycosides also results in a temporal delay in detectable levels of the drug in endolymph compared to organ of Corti tissues and perilymph (Tran Ba Huy et al. 1986), most likely due to electrophoretic loading of hair cells with the cationic aminoglycosides through the transduction channel from endolymph (Marcotti et al. 2005). Our imaging data here, and previously (Dai and Steyger 2008), provide evidence for trans-strial trafficking of aminoglycosides from strial capillaries to marginal cells, with the potential for clearance into endolymph. The molecular mechanisms for trans-strial trafficking of aminoglycosides remain to be determined.
The intra-cochlear distribution of purified GTTR replicate earlier studies using GTTR as a tracer administered simultaneously with GT (Dai and Steyger 2008; Dai et al. 2006). In this study, however, GTTR fluorescence was observed in hair cells more rapidly and more extensively in the stria vascularis, in the absence of competition from unconjugated GT. Although FM1-43 (molecular mass, 560) can assess the mechanotransduction properties of sensory hair cells (Gale et al. 2001; Goodyear et al. 2008), it crosses the BLB poorly (Meyers et al. 2003; Taylor et al. 2008). Despite a larger molecular mass (~1,000), GTTR crosses an intact BLB and enters hair cells within 30 min, suggestive of an active process facilitating GTTR trafficking between the vasculature and hair cells (Dai and Steyger 2008; Takada et al. 1985). However, our confocal fluorescence imaging parameters for GTTR (e.g., excitation maxima, 595 nm) are likely very different to those for FM1-43 (excitation maxima, 510 nm) and may account for the temporal difference in observing the fluorescence emission from these fluorophores. In addition, the GTTR (and immunolabeled GT) fluorescence described here are localized in the murine cochlea more rapidly (<30 min) than previous immunohistochemical or radiolabeling studies using other species and cumulative doses, often several 100-fold (Hiel et al. 1992a; Hiel et al. 1992b; Imamura and Adams 2003), greater than in this study (2 mg/kg), indicating the greater sensitivity of (immuno)fluorescence imaging, as well as cellular uptake prior to onset of toxicity (Hiel et al. 1993).
Qualitatively, strial capillaries and surrounding structures, including the anionic basement membrane surrounding the endothelial cells, were intensely labeled with GTTR, perhaps due to electrostatic binding between cationic GTTR and anionic binding sites associated with basement membrane structures (Suzuki and Kaga 1996; Yamasoba et al. 1996). However, strial capillaries did not lend themselves to segmentation and quantification of intensity values. Quantitatively, GTTR fluorescence was most intense in marginal cells, with decreasing intensities in intra-strial tissues, basal cells and fibrocytes. This also suggests GTTR trafficking against the intra-strial electrical gradient into marginal cells to produce higher fluorescence intensities (Dai and Steyger 2008). Alternatively, higher GTTR fluorescence in marginal cells could be due to poor GTTR efflux into endolymph or cell-specific gentamicin-binding proteins, e.g., calreticulin (Horibe et al. 2004; Karasawa et al. 2008a), enabling GTTR buffering and greater fluorescence in these cells. Finally, marginal cells could sequester GTTR from endolymph, though how GTTR first enters endolymph remains unspecified (Tauris et al. 2008).
GTTR labeling of the basilar membrane in cryostat sections was resolved to originate from the cells on the scala tympanic side of the basilar membrane. The presence of both purified GTTR and immunolabeled GT within cells in the scala tympani after systemic injection indicates drug penetration into perilymph, likely following serum kinetics as described previously (Tran Ba Huy et al. 1986; Tran Ba Huy et al. 1983). Thus, a perilymph trafficking pathway of aminoglycosides (and GTTR) to the organ of Corti is possible, although this is unlikely to be the cytotoxic route (Aran et al. 1999; Takada et al. 1985).
GTTR clearance from the cochlea
Between 3 and 24 h after systemic administration, GTTR fluorescence in the lateral wall decreased; although, after 6 h, clearance continued more slowly. This biphasic clearance rate and the extended cellular presence of GTTR could reflect the presence of gentamicin-binding proteins sequestering GTTR. The prolonged presence of aminoglycosides in fibrocytes and the lateral wall has been reported previously (Imamura and Adams 2003; Tran Ba Huy et al. 1986).
Gentamicin immunofluorescence
Immunolabeled GT occurred most intensely in marginal cells with substantially less fluorescence in intra-strial tissues, fibrocytes of the spiral ligament, organ of Corti, hair cells, and non-sensory supporting cells (regardless of dose administered), and mostly overlapped the distribution of purified GTTR. GT immunolabeling was more intense in spiral ligament fibrocytes after 3 h, as was GTTR. The presence of immunolabeled GT (and GTTR) in the stereociliary bundles of both outer hair cells (OHCs) and inner hair cells (IHCs), is suggestive of drug penetration into endolymph. The intensity of GT immunofluorescence (and GTTR) in the cell bodies of both IHCs and OHCs were similar, in contrast to the greater susceptibility of OHCs to aminoglycosides in general compared to IHCs. This is suggestive of IHC possessing greater resistance to aminoglycoside toxicity than OHCs, as hypothesized by Taylor et al. (2008) using FM1-43.
The only marked variation in immunofluorescence intensity occurred between marginal cells and other strial cell types, likely due to one or more causes. Firstly, antibody penetration into the lateral wall would be primarily through marginal cells, and thus would be preferentially immunolabeled unless an excess of antibody is present compared to the antigen. Secondly, various cell types may contain different gentamicin-binding proteins, each with binding sites that differ in their steric hindrance properties to GT antibodies (Myrdal et al. 2005). Thirdly, negligible GT immunofluorescence in the strial vasculature may represent faster clearance of GT compared to GTTR during cardiac-perfusion fixation. Finally, and critically, high levels of antigen (GT) may quench the immunofluorescence signal (as in Fig. 7E compared to Fig. 7A, Fig. 7N compared to Fig. 7J, and Fig. 9H compared to Fig. 9G), unlike GTTR. Despite this localized discrepancy, the distribution of GTTR and immunolabeled GT mimic one another, both spatially and temporally.
Increasing doses of GTTR produced increased cytoplasmic fluorescence in MDCK cells and in the cochlea (Dai and Steyger 2008). In contrast, increasing GT doses did not produce linear increases in the intensity of GT immunofluorescence in MDCK cells or in cochlear tissues. At very high GT doses, reduced GT immunofluorescence was observed, suggestive of self-quenching. Numerous fluorophores in close proximity are known to self-quench (Randolph and Waggoner 1997). Although the intensity of GT immunolabeling is not dose-dependent, its distribution closely matches the distribution of GTTR, which does exhibit a concentration–fluorescence intensity relationship.
Serum kinetics of GTTR and GT
Conjugation of Texas Red and GT will increase its molecular topology and mass to ~1,000 that is likely responsible for GTTR’s prolonged serum kinetics. However, additional molecular characteristics, including charge, hydrophobicity, and physical dimension also determine a molecule’s serum kinetics, ability to traffic through tissues, and permeation through ion channels. Following i.p. injection, GT had a serum half-life of less than 56 min. GTTR serum levels peaked at 3 h, with a half-life of 130 min. Consequently, cochlear vascular structures are exposed to systemic GTTR for longer periods than for GT at equivalent doses that may be partially responsible for the general correspondence in GTTR and immunolabeled GT distributions in the cochlea.
At higher GT doses (>20 mg/kg), serum GT levels at 30 min are correspondingly much higher (>100 mg/ml) and serum kinetics more rapid (half-life, 38 min, unpublished data). These higher doses indicate that GT still competes with GTTR for trafficking and binding sites after 3 h (Dai and Steyger 2008).
We conclude that: (1) GTTR enters zebrafish neuromast hair cells through calcium-sensitive cation channels (e.g., MET channels) and is cytotoxic, (2) systemically administered aminoglycosides rapidly and preferentially enter the stria vascularis of the cochlea, (3) systemically administered GTTR reaches murine hair cells more rapidly than FM1-43, (4) the cochlear distribution of purified GTTR was similar to that for immunolabeled GT, and (5) increasing doses of GTTR, but not gentamicin, correspond to increased cytoplasmic fluorescence. Finally, (6) the preferential localization of aminoglycosides in marginal cells is indicative of two possible mechanisms, either sequestration from endolymph, and/or trans-strial trafficking of aminoglycosides from strial capillaries to marginal cells, with potential clearance into endolymph and hair cells by flowing down the electrophysiological gradient (Takada et al. 1985). This trafficking route will be tested using cochlear perfusion studies.
Acknowledgments
Funded by DC 04555 and P30 DC 05983 grants from the National Institute of Deafness and other Communication Disorders, NIH. We thank Dr. Teresa Nicolson for making zebrafish available and to Drs. Takatoshi Karasawa and Edwin Rubel for helpful discussions on the manuscript.
References
- Aran JM, Erre JP, Lima da Costa D, Debbarh I, Dulon D. Acute and chronic effects of aminoglycosides on cochlear hair cells. Ann N Y Acad Sci 884:60–8, 1999. [DOI] [PubMed]
- Balogh K, Jr, Hiraide F, Ishii D. Distribution of radioactive dihydrostreptomycin in the cochlea. An autoradiographic study. Ann. Otol. Rhinol. Laryngol 79:641–52, 1970. [DOI] [PubMed]
- Bareggi R, Narducci P, Grill V, Mallardi F, Zweyer M, Fusaroli P. Localization of an aminoglycoside (streptomycin) in the inner ear after its systemic administration. A histochemical study using fluorescence microscopy. Histochemistry 84:237–40, 1986. [DOI] [PubMed]
- Brummett RE, Fox KE, Bendrick TW, Himes DL. Ototoxicity of tobramycin, gentamicin, amikacin and sisomicin in the guinea pig. J. Antimicrob. Chemother 4(Suppl A):73–83, 1978. [DOI] [PubMed]
- Chu HQ, Xiong H, Zhou XQ, Han F, Wu ZG, Zhang P, Huang XW, Cui YH. Aminoglycoside ototoxicity in three murine strains and effects on NKCC1 of stria vascularis. Chin. Med. J. (Engl) 119:980–5, 2006. [PubMed]
- Conlee JW, Gill SS, McCandless PT, Creel DJ. Differential susceptibility to gentamicin ototoxicity between albino and pigmented guinea pigs. Hear Res 41:43–51, 1989. [DOI] [PubMed]
- Conlee JW, Jensen RP, Parks TN, Creel DJ. Turn-specific and pigment-dependent differences in the stria vascularis of normal and gentamicin-treated albino and pigmented guinea pigs. Hear Res 55:57–69, 1991. [DOI] [PubMed]
- Dai CF, Steyger PS. A systemic gentamicin pathway across the stria vascularis. Hear Res 235:114–24, 2008. [DOI] [PMC free article] [PubMed]
- Dai CF, Mangiardi D, Cotanche DA, Steyger PS. Uptake of fluorescent gentamicin by vertebrate sensory cells in vivo. Hear Res 213:64–78, 2006. [DOI] [PMC free article] [PubMed]
- Egner, A., Hell, S.W. 2006. Aberrations in confocal and multi-photon fluorescence microscopy induced by refractive index mismatch. In: Pawley, J.B., (Ed.), Handbook of Biological Confocal Microscopy. Springer, New York. pp. 404–412.
- Ernest S, Rauch GJ, Haffter P, Geisler R, Petit C, Nicolson T. Mariner is defective in myosin VIIA: a zebrafish model for human hereditary deafness. Hum. Mol. Genet 9:2189–96, 2000. [DOI] [PubMed]
- Forge A. Outer hair cell loss and supporting cell expansion following chronic gentamicin treatment. Hear Res 19:171–82, 1985. [DOI] [PubMed]
- Forge A, Fradis M. Structural abnormalities in the stria vascularis following chronic gentamicin treatment. Hear Res 20:233–44, 1985. [DOI] [PubMed]
- Forge A, Wright A, Davies SJ. Analysis of structural changes in the stria vascularis following chronic gentamicin treatment. Hear Res 31:253–65, 1987. [DOI] [PubMed]
- Fox KE. Total extraction of aminoglycosides from guinea pig and bullfrog tissues with sodium hydroxide or trichloroacetic acid. Antimicrob. Agents Chemother 33:448–51, 1989. [DOI] [PMC free article] [PubMed]
- Gale JE, Marcotti W, Kennedy HJ, Kros CJ, Richardson GP. FM1–43 dye behaves as a permeant blocker of the hair-cell mechanotransducer channel. J. Neurosci 21:7013–25, 2001. [DOI] [PMC free article] [PubMed]
- Gale, J.E., Meyers, J.R., Periasamy, A., Corwin, J.T. 2002. Survival of bundleless hair cells and subsequent bundle replacement in the bullfrog’s saccule. J Neurobiol 50, 81–92. [DOI] [PubMed]
- Goodyear RJ, Gale JE, Ranatunga KM, Kros CJ, Richardson GP. Aminoglycoside-induced phosphatidylserine externalization in sensory hair cells is regionally restricted, rapid, and reversible. J. Neurosci 28:9939–52, 2008. [DOI] [PMC free article] [PubMed]
- Harris JA, Cheng AG, Cunningham LL, MacDonald G, Raible DW, Rubel EW. Neomycin-induced hair cell death and rapid regeneration in the lateral line of zebrafish (Danio rerio). J. Assoc. Res. Otolaryngol 4:219–34, 2003. [DOI] [PMC free article] [PubMed]
- Hashino E, Shero M. Endocytosis of aminoglycoside antibiotics in sensory hair cells. Brain Res 704:135–40, 1995. [DOI] [PubMed]
- Hiel H, Bennani H, Erre JP, Aurousseau C, Aran JM. Kinetics of gentamicin in cochlear hair cells after chronic treatment. Acta. Otolaryngol 112:272–7, 1992a. [DOI] [PubMed]
- Hiel H, Schamel A, Erre JP, Hayashida T, Dulon D, Aran JM. Cellular and subcellular localization of tritiated gentamicin in the guinea pig cochlea following combined treatment with ethacrynic acid. Hear Res 57:157–65, 1992b. [DOI] [PubMed]
- Hiel H, Erre JP, Aurousseau C, Bouali R, Dulon D, Aran JM. Gentamicin uptake by cochlear hair cells precedes hearing impairment during chronic treatment. Audiology 32:78–87, 1993. [DOI] [PubMed]
- Horibe T, Matsui H, Tanaka M, Nagai H, Yamaguchi Y, Kato K, Kikuchi M. Gentamicin binds to the lectin site of calreticulin and inhibits its chaperone activity. Biochem. Biophys. Res. Commun 323:281–7, 2004. [DOI] [PubMed]
- Huang CJ, Favre I, Moczydlowski E. Permeation of large tetra-alkylammonium cations through mutant and wild-type voltage-gated sodium channels as revealed by relief of block at high voltage. J. Gen. Physiol 115:435–54, 2000. [DOI] [PMC free article] [PubMed]
- Imamura S, Adams JC. Distribution of gentamicin in the guinea pig inner ear after local or systemic application. J. Assoc. Res. Otolaryngol 4:176–95, 2003. [DOI] [PMC free article] [PubMed]
- Karasawa T, Wang Q, David L, Steyger PS. Identification of gentamicin-binding proteins in the inner ear. ARO Midwinter Meeting Abstracts 31:725, 2008a.
- Karasawa T, Wang Q, Fu Y, Cohen DM, Steyger PS. TRPV4 enhances the cellular uptake of aminoglycoside antibiotics. J. Cell. Sci 121:2871–2879, 2008b. [DOI] [PMC free article] [PubMed]
- Khakh BS, Bao XR, Labarca C, Lester HA. Neuronal P2X transmitter-gated cation channels change their ion selectivity in seconds. Nat. Neurosci 2:322–30, 1999. [DOI] [PubMed]
- Kitahara T, Li HS, Balaban CD. Changes in transient receptor potential cation channel superfamily V (TRPV) mRNA expression in the mouse inner ear ganglia after kanamycin challenge. Hear Res 201:132–44, 2005. [DOI] [PubMed]
- Kroese AB, Das A, Hudspeth AJ. Blockage of the transduction channels of hair cells in the bullfrog's sacculus by aminoglycoside antibiotics. Hear Res 37:203–17, 1989. [DOI] [PubMed]
- Kusunoki T, Cureoglu S, Schachern PA, Baba K, Kariya S, Sampaio A, Paparella MM. Effects of gentamicin on sensorineural elements of the cochlea in human temporal bones. Am. J. Otolaryngol 25:313–7, 2004. [DOI] [PubMed]
- Marcotti W, van Netten SM, Kros CJ. The aminoglycoside antibiotic dihydrostreptomycin rapidly enters mouse outer hair cells through the mechano-electrical transducer channels. J. Physiol 567:505–21, 2005. [DOI] [PMC free article] [PubMed]
- Meyers JR, MacDonald RB, Duggan A, Lenzi D, Standaert DG, Corwin JT, Corey DP. Lighting up the senses: FM1–43 loading of sensory cells through nonselective ion channels. J. Neurosci 23:4054–65, 2003. [DOI] [PMC free article] [PubMed]
- Mullins MC, Hammerschmidt M, Haffter P, Nusslein-Volhard C. Large-scale mutagenesis in the zebrafish: in search of genes controlling development in a vertebrate. Curr. Biol 4:189–202, 1994. [DOI] [PubMed]
- Myrdal SE, Johnson KC, Steyger PS. Cytoplasmic and intra-nuclear binding of gentamicin does not require endocytosis. Hear Res 204:156–69, 2005. [DOI] [PMC free article] [PubMed]
- Newman DJ, Henneberry H, Price CP. Particle enhanced light scattering immunoassay. Ann. Clin. Biochem 29(Pt 1):22–42, 1992. [DOI] [PubMed]
- Randolph JB, Waggoner AS. Stability, specificity and fluorescence brightness of multiply-labeled fluorescent DNA probes. Nucleic Acids Res 25:2923–9, 1997. [DOI] [PMC free article] [PubMed]
- Richardson GP, Forge A, Kros CJ, Fleming J, Brown SD, Steel KP. Myosin VIIA is required for aminoglycoside accumulation in cochlear hair cells. J. Neurosci 17:9506–19, 1997. [DOI] [PMC free article] [PubMed]
- Sandoval R, Leiser J, Molitoris BA. Aminoglycoside antibiotics traffic to the Golgi complex in LLC-PK1 cells. J. Am. Soc. Nephrol 9:167–74, 1998. [DOI] [PubMed]
- Seiler C, Nicolson T. Defective calmodulin-dependent rapid apical endocytosis in zebrafish sensory hair cell mutants. J. Neurobiol 41:424–34, 1999. [DOI] [PubMed]
- Steyger PS, Peters SL, Rehling J, Hordichok A, Dai CF. Uptake of gentamicin by bullfrog saccular hair cells in vitro. J. Assoc. Res. Otolaryngol 4:565–78, 2003. [DOI] [PMC free article] [PubMed]
- Suzuki M, Kaga K. Effect of cisplatin on the negative charge barrier in strial vessels of the guinea pig. A transmission electron microscopic study using polyethyleneimine molecules. Eur. Arch. Otorhinolaryngol 253:351–5, 1996. [DOI] [PubMed]
- Tachibana M, Morioka H, Machino M, Mizukoshi O. Binding sites of an aminoglycoside in the cochlea examined by immunocytochemistry. Histochemistry 83:237–40, 1985. [DOI] [PubMed]
- Takada A, Bledsoe S, Jr, Schacht J. An energy-dependent step in aminoglycoside ototoxicity: prevention of gentamicin ototoxicity during reduced endolymphatic potential. Hear Res 19:245–51, 1985. [DOI] [PubMed]
- Tauris J, Christensen EI, Nykjaer A, Jacobsen C, Petersen MC, Ovesen T. Cubilin and megalin co-localize in the neonatal inner ear. Audiol Neurotol 14:267–278, 2008. [DOI] [PubMed]
- Taylor RR, Nevill G, Forge A. Rapid hair cell loss: a mouse model for cochlear lesions. J. Assoc. Res. Otolaryngol 9:44–64, 2008. [DOI] [PMC free article] [PubMed]
- Ton C, Parng C. The use of zebrafish for assessing ototoxic and otoprotective agents. Hear Res 208:79–88, 2005. [DOI] [PubMed]
- Tran Ba Huy P, Manuel C, Meulemans A, Sterkers O, Amiel C. Pharmacokinetics of gentamicin in perilymph and endolymph of the rat as determined by radioimmunoassay. J. Infect. Dis 143:476–86, 1981. [DOI] [PubMed]
- Tran Ba Huy P, Meulemans A, Wassef M, Manuel C, Sterkers O, Amiel C. Gentamicin persistence in rat endolymph and perilymph after a two-day constant infusion. Antimicrob. Agents Chemother 23:344–6, 1983. [DOI] [PMC free article] [PubMed]
- Tran Ba Huy P, Bernard P, Schacht J. Kinetics of gentamicin uptake and release in the rat. Comparison of inner ear tissues and fluids with other organs. J. Clin. Invest 77:1492–500, 1986. [DOI] [PMC free article] [PubMed]
- Virginio C, MacKenzie A, Rassendren FA, North RA, Surprenant A. Pore dilation of neuronal P2X receptor channels. Nat. Neurosci 2:315–21, 1999. [DOI] [PubMed]
- Westerfield M. The Zebrafish book: a guide for the laboratory use of zebrafish (Brachydanio rerio). Eugene, University of Oregon Press, 1993.
- Wu WJ, Sha SH, McLaren JD, Kawamoto K, Raphael Y, Schacht J. Aminoglycoside ototoxicity in adult CBA, C57BL and BALB mice and the Sprague-Dawley rat. Hear Res 158:165–78, 2001. [DOI] [PubMed]
- Yamane H, Nakai Y, Konishi K. Furosemide-induced alteration of drug pathway to cochlea. Acta. Otolaryngol. Suppl 447:28–35, 1988. [DOI] [PubMed]
- Yamasoba T, Suzuki M, Kaga K. Influence of chronic kanamycin administration on basement membrane anionic sites in the labyrinth. Hear Res 102:116–24, 1996. [DOI] [PubMed]


