

Abstract
Human PNP is a homotrimer, containing three non-conserved tryptophan residues at positions 16, 94 and 178, all remote from the catalytic site. The catalytic sites of PNP are located near the subunit-subunit interfaces where residue F159 is a catalytic site residue donated from an adjacent subunit. F159 covers the top (β) surface of the ribosyl group at the catalytic site. QM/MM calculations of human PNP have shown that F159 is the center of the most mobile region of the protein providing access to the substrate in the active site. F159 is also the key residue in a cluster of hydrophobic residues that shield catalytic site ligands from bulk solvent. Trp-free human PNP (Leuko-PNP) was previously engineered by replacing the three Trp residues of native PNP with Tyr. From this active construct, a single Trp residue was placed in the catalytic site loop (F159W-Leuko-PNP) as a reporter group for the ribosyl region of the catalytic site. The F159W-Leuko-PNP fluorescence is red shifted compared to native PNP suggesting a solvent-exposed Trp residue. Upon ligand binding (hypoxanthine), the 3-fold fluorescence quench confirms conformational packing of the catalytic site pocket hydrophobic-cluster. F159W-Leuko-PNP has an on-enzyme thermodynamic equilibrium constant (Keq) near unity in the temperature range between 20 and 30 °C and non-zero enthalpic components, making it suitable for laser induced T-jump analyses. T-jump relaxation kinetics of F159W-Leuko-PNP in equilibrium with substrates and/or products indicate the conformational equilibria of at least two ternary complex intermediates in the nano- to milli-second time scale (1000 to 10,000 s−1) that equilibrate prior to the slower chemical step (∼200 s−1). F159W-Leuko-PNP provides a novel protein platform to investigate the protein conformational dynamics occurring prior to transition state formation.
Human purine nucleoside phosphorylase (PNP)1 is a homotrimer that catalyzes the reversible phosphorolysis of 6-oxopurine nucleosides and deoxynucleosides to the corresponding purine bases and α-D-(deoxy)-ribose 1-phosphate (1-6) (Scheme 1). The genetic deficiency of PNP leads to a specific T-cell immune deficiency (1). Transition-state analogue inhibitors of PNP provide potential therapies for T-cell cancers and autoimmune diseases including rheumatoid arthritis, psoriasis, tissue transplant rejection and multiple sclerosis (7-9). Crystal structures of PNP complexed with substrate, substrate analogues or transition-state analogues have defined the active site residues in contact with the purine nucleoside and the phosphate nucleophile (Figure 1) (10-13). Human PNP is a homotrimer, containing three tryptophan residues at positions 16, 94 and 178 which are all remote from the catalytic site (Figure 1). The catalytic sites of PNP are located near the subunit subunit-interfaces where residue F159 is a catalytic site residue donated from an adjacent subunit (Figure 1). It is the only residue from the neighboring subunit which participates in catalytic site contacts by covering the top surface of the ribosyl group of bound purine nucleoside (Figure 1). QM/MM calculations of human PNP have shown that F159 is the center of the most mobile region of the protein (4, 14). Calculations also reveal correlated motions between residues 57−65 of subunit-A (a phosphate-binding loop) and residues 155−160 of subunit-C (the F159-loop) (14). These loops interact through the subunit interface. Interestingly, F159 is the key residue among a cluster of residues (F159, H257, F200 and Y88) that shield ligands in the catalytic pocket from bulk solvent (Figure 1) (14).
Scheme 1.

FIGURE 1.

(A) Trimeric crystal structure of human PNP in complex with Immucillin-H (Imm-H) and phosphate, with highlighted remote tryptophan residues (PDB 1RR6). (B) A close up space filling view of the catalytic site contact residues at the subunit-subunit interface.
Atomic motion on the femtosecond to millisecond time scale is important for enzymatic catalysis (15, 16) (Table 1). For example, the steady state turnover for PNP is ∼40 s−1 (25 ms), the chemical step is ∼200 s−1, reaction coordinate motion is ∼100 fs and the lifetime of the transition state is ∼10 fs (17) (Table 1). Therefore, the catalytic cycle takes 2,500,000,000,000 times longer than the transition state lifetime (18). Computationally, specific, fast protein dynamic motions can be correlated with transition state formation. However, proteins also undergo conformational changes in the nanosecond to millisecond time scale to bind reactants and arrange into a form suitable for transition state formation. A major problem has been experimental access to the broad and often uncoupled time scales to validate the dynamic modes at all stages of the reaction coordinate. During the last decade, efforts on dynamic contributions to enzymatic catalysis have focused on computational and experimental validation of protein conformational changes in the ns to ms time scale with approaches including: (1) NMR (19-26); (2) infrared laser-induced T-jump perturbation (27-33); (3) and more recently, TPS (transition path sampling) approaches (17, 34-37).
Table 1.
Time Constants of Molecular Dynamics, Protein Motion and Catalysisa
| Time | sec | ||||
| s | 1 | common kcat range | |||
| ms | 10−1 | ||||
| 10−2 | kcat PNP | ||||
| 10−3 | flap opening TIM | kchem PNP | |||
| μs | 10−4 | rate O2 Hb to deoxy Hb | loop motion PNP | ||
| 10−5 | flap closing OPRTase and PTPase | domain motion in protein | |||
| 10−6 | |||||
| ns | 10−7 | substrate/ligand binding PNPb | |||
| 10−8 | rotation/translation for NACs catalytic site capture limita | ||||
| 10−9 | |||||
| ps | 10−10 | H2O diffuses two diameters | |||
| 10−11 | collisionless H+ ion transfer | ||||
| 10−12 | light travels 0.3 mm | ||||
| fs | 10−13 | bond vibration; TS lifetime | |||
| 10−14 | TS PNPc | ||||
| 10−15 | |||||
Laser induced temperature-jump spectroscopy was employed to characterize the conformational dynamics of selective regions of the PNP catalytic site that lead to a catalytically competent ternary complex. A single-Trp mutant of PNP provides a reporter group to probe the motions of the catalytic site F159 loop near the ribosyl region of bound reactants. Trp-free PNP (Leuko-PNP) previously allowed collection of T-jump data on guanine fluorescence spectra, free of native PNP chromogenic effects (38). From this construct, the single Trp residue (F159W-Leuko-PNP) described here was used to investigate kinetic, fluorescent and dynamic properties associated with catalysis for this region of the catalytic site.
Materials and Methods
Site-Directed Mutagenesis
A QuikChange Site-Directed Mutagenesis kit (Stratagene) was used to prepare the loop-tryptophan PNP (F159W-Leuko-PNP), in which the phenyl alanine residue (F159) was replaced with tryptophan. The method was used according to the manufacturer's instructions, with the Leuko-PNP gene inserted into pCRT7/NT-TOPO (38) as a template and F159Wf 5'-GGTTTGGAGATCGTTGGCCTGCCATGTCTGATGC-3', F159Wr 5'-GGCATCAGACATGGCAGGCCAACGATCTCCAAACCTTTC-3' oligonucleotides as forward (f) and reverse (r) primers, respectively (underlined letters indicate mismatches). The DNA sequence of the mutant enzyme was confirmed and the plasmid was transformed into E. coli strain BL21(DE3)pLysS competent cells (Invitrogen).
Expression and Purification of F159W-Leuko-PNP
F159W-Leuko-PNP was expressed and purified to homogeneity as judged by SDS-PAGE using the same procedure used previously for the purification of the native- and Leuko-PNP (38, 39).
Preparation of Hypoxanthine-free F159W-Leuko-PNP
Similar to native- and Leuko-PNP, F159W-Leuko-PNP as purified in 20 mM Tris-Cl, pH 7.4, contained tightly bound hypoxanthine in a stoichiometry of ∼0.7 to 1 per enzyme monomer, indicating that at least two out of the three active sites of the enzyme trimer are occupied with hypoxanthine (38). Incubation of the enzymes in 100 mM (NH4)2SO4 in the presence of 10% charcoal (w/v) for 5 min followed by centrifugation and filtration of the enzyme resulted in the preparation of phosphate and hypoxanthine-free F159W-Leuko-PNP as indicated by reverse phase HPLC and UV spectral analysis.
Enzyme Assays
Activity assay for F159W-Leuko-PNP with inosine as a substrate was carried out by monitoring the conversion of hypoxanthine to uric acid (ε293 = 12.9 mM−1 cm−1) (40) in a coupled assay containing 60 milliunits of xanthine oxidase and variable concentrations of inosine, in 50 mM KH2PO4, pH 7.4 at 25 °C (41). The slow onset of inhibition was measured following the addition of enzyme to complete assay mixtures at ∼8 mM inosine and various inhibitor concentrations (42, 43). Inhibitor concentrations were determined spectrophotometrically using the published millimolar extinction coefficient of 9.54 at 261 nm at pH 7, for 9-deazainosine (ImmH based inhibitors) (43-45). Enzyme (0.2 to 0.5 nM final concentration) was added to assay mixtures followed by monitoring of product formation. Rates were monitored for 1−2 h to determine both the initial reaction rate and to determine if slow-onset inhibition occurred.
Fluorometric Titration of F159W-Leuko-PNP
The fluorescence emission spectra (λexc = 295 nm, 2.5 nm slit width, and 10 mm path length) of free or ligand bound F159W-Leuko-PNP were acquired using a FluroMax-3 spectrofluorometer thermostated at 25 °C. The dissociation constants for different ligands were obtained from the fluorometric titrations of the hypoxanthine-free PNPs (3 μM) with different ligands (hypoxanthine in the presence and the absence of 50 mM phosphate and inosine in the presence and the absence of sulfate and/or phosphate) at pH 7.4. Typically, during titrations, the dilution does not exceed 10%, and all the fluorescence emissions spectra were corrected for dilution. Inosine and hypoxanthine stock solutions were prepared fresh prior to each titration and their concentrations were determined spectrophotometrically using the published millimolar extinction coefficients of 12.3 mM−1 cm−1 at 249 nm and 10.7 mM−1 cm−1 at 250 nm at pH 7 for inosine and hypoxanthine, respectively (46).
Stopped-Flow Fluorescence and Quench-Flow Kinetics
The temperature dependence for the forward and the reverse single turnover catalysis of F159W-Leuko-PNP with inosine and native PNP with guanosine as substrates were determined using an KinTek SF-MiniMixer stopped-flow attached to FluoroMax-3 spectrofluorometer equipped with a thermostated water bath, by following the quenching (forward reaction for F159W-Leuko-PNP with inosine or reverse reaction for native PNP with guanine and ribose 1-phosphate) or increase (reverse reaction for F159W-Leuko-PNP with hypoxanthine and ribose 1-phosphate or forward reaction for native PNP with guanosine) of fluorescence intensity above 300 nm upon excitation at 295 nm (10−20 nm slit widths, 10 mm path length). The forward single turnover reactions involved mixing equal volumes of ∼5−6 μM enzyme in 100 mM KH2PO4, pH 7.4, against saturated substrate solutions (∼2−3 mM of inosine for F159W-Leuko-PNP or guanosine for native PNP) in the same buffer, in the temperature range between 1 and 20 °C. The reverse single turnover reactions involved mixing equal volumes of ∼5−6 μM enzyme containing ∼2 mM of hypoxanthine for F159W-Leuko-PNP or guanine for native PNP in 20 mM Tris-Cl, pH 7.4, against 2 mM ribose 1-phosphate in the same buffer, in the temperature range between 1 and 20 °C. Data points (20 to100) were recorded over the course of each reaction (0.02 to 0.1 s), and at least 3 runs were averaged for each temperature. The forward and reverse single turnover rates at different temperatures were determined by fitting the stopped-flow traces into single exponential equation using the software provided by the manufacturer. The reverse single turnover catalysis of F159W-Leuko-PNP with hypoxanthine and ribose 1-phosphate was also independently determined using KinTek RQF-3 Rapid Quench-Flow at room temperature. The reverse single turnover reaction involved rapid mixing (0.002 to 3 s) of equal volumes of 150 μM of F159W-Leuko-PNP containing ∼1 mM of hypoxanthine in 20 mM Tris-Cl, pH 7.4, against 5 mM ribose 1-phosphate in the same buffer, followed by automatic acid quenching (0.6 N HCl) and collection of the quenched reactions. The ratio of hypoxanthine to inosine was then quantified using reverse phase HPLC. The reverse single turnover rate for F159W-Leuko-PNP was determined by plotting the inosine formed as a function of mixing time and fitting the data into single exponential equation (eq 2). The temperature dependence for the rates of hypoxanthine binding to F159W-Leuko-PNP was also determined using stopped-flow fluorometry as described above. The quench of fluorescence intensity above 300 nm upon excitation at 295 nm (20 nm slit widths, 10 mm path length) was followed. The reactions involved mixing equal volumes of ∼6 μM enzyme in 100 mM KH2PO4, pH 7.4, against saturated ligand solutions (51 or 70μM for hypoxanthine) in the same buffer, in the temperature range between 1 and 25 °C. Data points (20 to100) were recorded over the course of each reaction (0.02− 0.1 s), and at least 3 runs were averaged for each temperature. The rates hypoxanthine binding to F159W-Leuko-PNP at different temperatures were determined by fitting the kinetic data to a single exponential equation using the software provided by the manufacturer.
T-Jump Relaxation Kinetics of F159W-Leuko-PNP
The laser induced T-jump relaxation kinetics for equilibrated systems with the single Trp-reporter-PNP, inosine, phosphate, hypoxanthine, and ribose 1-phosphate or for the ternary complex of PNP, hypoxanthine and phosphate were determined by methods described previously (28, 29, 31, 33, 38). Temperature jumps were induced by a pulse of infrared light (1.56 μm wavelength, 90−120 mJ energy, 1.5 mm diameter spot on the sample, 0.5 mm path length), generated by stimulated Raman shifting the fundamental emission (1.064 μm) of a Powerlite 7010 Q-switched Nd:YAG laser (Continuum, Santa Clara, CA), operating at 2 Hz, in a 1 m long cell filled with deuterium gas at 650 psi. Water absorbs the laser energy, and the temperature of the exposed volume increases in approximately 10 ns. The size of the T-jump was calibrated using the change of water IR absorption with temperature. Typical T-jump values ranged from 6.5 to 8.5 °C. Diffusion of heat out of the interaction volume proceeds with a time constant of approximately 35 ms. Hence, the apparatus generated a T-jump within 10 ns that remained constant for approximately 10 ms. The fluorescence intensity of the tryptophan fluorophore involved irradiation by emission lines near 300 nm from an Innova 200−25/5 argon ion laser (Coherent, Palo Alto, CA). To avoid photodamage, the excitation light was modulated using a shutter that allowed 19 ms exposure for every T-jump pulse. The power of the excitation beam was 3−5 mW. The incident excitation beam is focused onto a 0.3 mm diameter spot on the sample, in the center of the heated spot. Tryptophan fluorescence emission, detected at 50 to the excitation beam, was passed through a narrow band filter (340 ± 12 nm) and was monitored using a R4220P photomultiplier tube (Hamamatsu, Bridgewater, NJ). Data were digitized with a CS82G data acquisition board (Gage Applied Technologies, Montreal, Quebec, Canada) at 1 GS/s sampling rate. Overall temporal resolution of the system is about 20 ns. A background signal obtained without fluorescence excitation was measured separately and subtracted from the kinetic data. A program written in LabVIEW (National Instruments, Austin, TX) was used for instrument control and data collection. Data were normalized to the average fluorescence intensity taken before the T-jump. Typically, T-jump relaxation profiles were obtained by subjecting the sample containing ∼28 μM F159W-Leuko-PNP in 50 mM KH2PO4, pH 7.4, and variable concentration of either inosine (13 to 800 μM) or hypoxanthine (5.7 to 798 μM) to a laser-induced temperature jump (from 10 to 18, 20 to 27, and 25 to 32 °C ) every 500 ms. The relaxation is monitored using fluorescence for the first 14 ms after the T-jump; once 300 ms has elapsed, the sample has relaxed to its original temperature, allowing the T-jump to be repeated. Each relaxation curve contains data from 3600 temperature jumps on the same sample. Curve fitting was done with OriginPro (OriginLab, Northampton, MA) software. The small spurious signals that sometimes appear in the relaxation spectra between 1 and 20 μs are due to transient microbubbles formation. In those cases, curve fitting started at 20 or 30 μs. The uncertainties in the reported values of relaxation rates were determined from the fitting parameters.
Data Analysis
The dissociation constants for the binding of hypoxanthine to F159W-Leuko-PNP were determined by fitting the fluorometric titrations data to eq 1, where F0, FEL and FEL∞ are the intrinsic fluorescence of the free enzyme, ligand bound enzyme and enzyme at saturating ligand concentration, respectively, [L] is the total ligand concentration, Kd is the dissociation constant of enzyme-ligand complex. The single turnover rates (forward or reverse) at different temperatures were determined by fitting the stopped-flow traces into the equation for single exponential decay (eq 2), where kobs represents the first-order rate constant of the chemical step, t is time, Ft is the fluorescence emission intensity above 295 nm, A is the amplitude of the total change, and F∞ is the fluorescence intensity at infinite time. The temperature dependence of the single turnover rates (k) were determined by fitting the data with the Arrhenius and the Eyring equations (eqs 3 and 4, respectively), where kB and h are the Boltzmann and Planck constants, respectively, A is the preexponential factor, Ea is the energy of activation, R is the gas constant (8.31 J mol−1 K−1), and T is the temperature in Kelvin. The enthalpy of activation (ΔH‡) is calculated from the slope of the plots, whereas the entropy (ΔS‡) is calculated from y-intercept of the plots. The microscopic rate constants (k2, k−2, k3 and k−3) of the conformational changes for F159W-leuko-PNP equilibrated systems (Scheme 2) were obtained directly by fitting the T-jump relaxation times τ2−1 and τ3−1 to eqs 5 and 6 (47), respectively.
| (1) |
| (2) |
| (3) |
| (4) |
| (5) |
| (6) |
Scheme 2.

Results and Discussion
Expression and Purification of F159W-Leuko-PNP
F159W-Leuko-PNP was expressed and purified to homogeneity as judged by SDS-PAGE using the same procedure described previously for the purification of native- or Leuko-PNP (38, 39). Approximately 100 mg of pure enzyme was obtained from one liter of Luria-Bertani culture medium. Similar to native and Leuko-PNP, the incubation of F159W-Leuko-PNP in 100 mM (NH4)2SO4 (a non-reactive analogue of phosphate) in the presence of activated charcoal removes the tightly bound hypoxanthine. This confirms the role of inorganic phosphate, sulfate or arsenate in assisting hypoxanthine release from the tightly-bound PNP-hypoxanthine complex (48).
Steady State Kinetic and Slow Onset Inhibition Properties
The steady state kinetic parameters of F159W-Leuko-PNP were determined with inosine as substrate and immucillin inhibitors and compared to those for the native and Trp-free enzymes (Table 2). The single Trp mutant PNP has kcat, and Km altered by ∼2- and 7-fold, respectively (Table 2). The overall catalytic efficiency of F159W-Leuko-PNP is therefore reduced by ∼14-fold relative to native- and Leuko-PNPs (Table 2). The binding affinity of transition state analogues to F159W-Leuko-PNP is reduced by ∼20- and 10-fold for ImmH and DADMe-ImmH (the preferred transition state analogue for human PNP (39)), respectively (Table 2). Differences in Km values and the dissociation constants for transition state analogues suggest differences in transition state structure as recently established for PNPs with mutations remote from the catalytic sites (49-51). Despite the four amino acid substitutions, F159W-Leuko-PNP remains active and provides a useful spectroscopic probe to study the fluorescent and the dynamic properties of the catalytic site.
Table 2.
Comparison of Steady State Kinetic Constants and Inhibition Constants for F159W-Leuko-, native, and Leuko-PNPs with Inosine as Substrates and with Immucillin Inhibitors a
| parameter | F159W-Leuko-PNP | Leuko-PNPb | Native PNPb |
|---|---|---|---|
| Inosine as a Substrate | |||
| kcat, s−1 | 22 ± 1 | 36 ± 1 | 44 ± 2 |
| Km, μM | 422 ± 30 | 50 ± 3 | 71 ± 8 |
| kcat/Km, M−1 s−1 | (5.2 ± 0.4) × 104 | (7.2 ± 0.4) × 105 | (6.2 ± 0.7) × 105 |
| ImmH as an Inhibitorc | |||
| Ki*c, pM | 2,100 ± 60 | 134 ± 12 | 88 ± 3 |
| DADMe-ImmH as an Inhibitorc | |||
| Ki*, pM | 60 ± 2 | 12 ± 3 | 8.5 ± 0.3 |
Enzymatic assays with either substrates or inhibitors were performed in 50 mM KH2PO4, pH 7.4, at 25 °C.
From ref (38).
DADMe-ImmH, 4'-deaza-1'-aza-2'-deoxy-1'-(9-methylene)-Immucillin-H; ImmH, Immucillin-H; Ki*, slow-onset tight binding constant for inhibitors.
Fluorescence Properties of F159W-Leuko-PNP
The intrinsic fluorescence properties of F159W-Leuko-PNP were significantly different from those for native- or Leuko-PNP upon excitation at 295 nm (Figure 2). While Leuko-PNP has no fluorescence emission maxima and native PNP (three Trp residues) has emission maximum centered at 340 nm (38), F159W-Leuko-PNP showed an 10 nm shift of the emission maximum (λmax centered at 350 nm) with similar intrinsic fluorescence intensity relative to native PNP (Figure 2). Fluorometric titration of F159W-Leuko-PNP with hypoxanthine in the absence or presence of phosphate (50 mM KH2PO4) showed ∼3-fold decrease in fluorescence intensity without a significant shift of the emission maximum (Figures 2A and 2B). Titration data fitted to eq 1 gave Kd values of 3.3 ± 0.2 μM and 16 ± 2 μM for hypoxanthine in the absence and the presence of phosphate, respectively (Figures 2A and 2B). No cooperative interactions are observed as the three catalytic sites are filled. Fluorometric titration of F159W-Leuko-PNP with its substrate, inosine (up to ∼100 μM), in the absence or presence of inorganic sulfate (a non reactive analogue of phosphate, up to 3 mM) does not alter the fluorescence emission spectrum of the enzyme (Figure 2C). Upon the addition of phosphate to the enzyme inosine complex, hypoxanthine is generated and fluorescence is quenched (Figure 2C). The red-shift of the emission spectrum of the free enzyme suggests a solvent-exposed Trp residue in unliganded F159W-Leuko-PNP (52, 53). In native PNP the Trp residues are embedded in the hydrophobic core (38, 52, 53). Upon hypoxanthine binding to the enzyme active site, the 3-fold quenching in fluorescence intensity confirms F159 as a key residue in the conformational packing of the hydrophobic-cluster (F159, H257, Y88 and F200) in the catalytic pocket (Figure 1) (14). The fluorescent properties of F159W-Leuko-PNP provide a catalytic site reporter with large fluorescence changes as a function of catalysis and upon ligand binding. F159W-Leuko-PNP can also be employed to study the dynamic chemical equilibrium for hypoxanthine binding and hypoxanthine ↔ inosine equilibrium perturbation at the catalytic site of PNP by using T-jump fluorescence relaxation approach, provided that the reaction exhibits a non-zero enthalpy.
FIGURE 2.
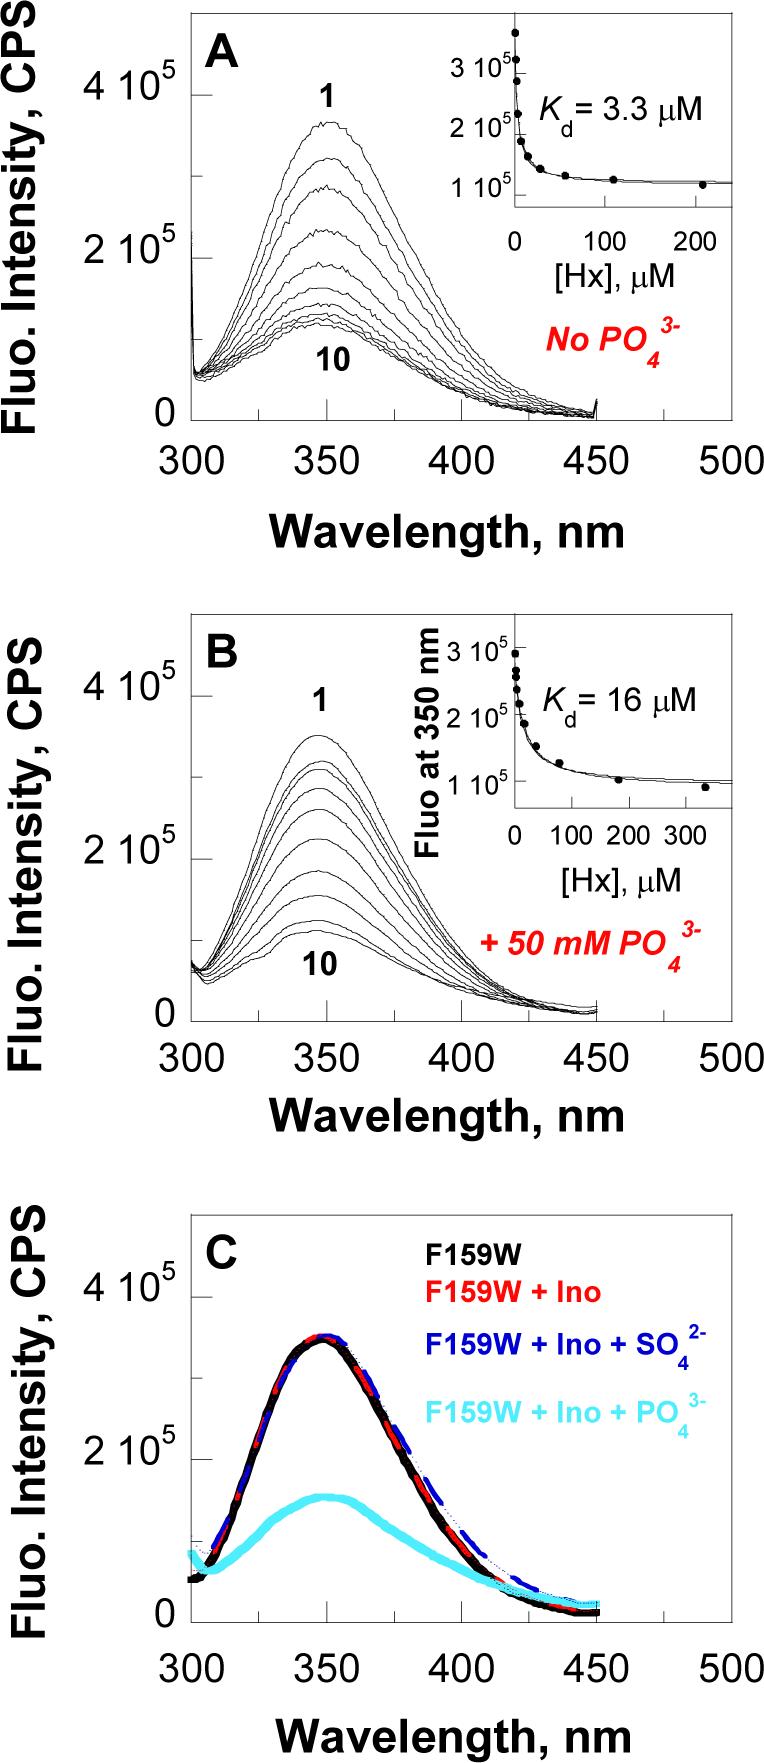
Ligand and substrate binding to F159W-Leuko-PNP. Fluorescence emission spectra (λex = 295 nm) of F159W-Leuko-PNP in the absence (panel A) and the presence (panel B) of phosphate during the fluorometric titration of hypoxanthine in a concentration range between zero (panel A and B, curves 1) and 208 μM (panel A, curve 10) or 333 μM (panel B, curve 10). Insets, fluorescence emission intensity values (•) at 350 nm as a function of hypoxanthine (panel A and B); the curves are fits of the data to eq 1. Panel C, fluorescence emission spectra (λex = = 295 nm) of F159W-Leuko-PNP before (black curve) and after the titration of ∼ 100 μM of inosine (red curve), then the titration of up to 3 mM sulfate (blue curve), and finally after the titration of up to 12 mM phosphate (light blue curve). Fluorescence emission spectra were recorded at enzyme concentrations of ∼3 μM in 20 mM Tris-Cl (panels A and C) or 50 mM KH2PO4 (panel B), pH 7.4, at 25 °C.
Pre-Steady State and On-Enzyme Equilibrium Kinetics
Stopped-flow fluorescence and/or quench-flow studies for the formation or the removal of hypoxanthine as a function of temperature and at saturated substrate concentrations, provides the forward (kchemf) and the reverse (kchemr) single turnover catalytic rates for F159W-Leuko-PNP (Figure 3 and Table 3). For comparison, the forward and reverse single turnover catalytic rates for native PNP were determined for the formation or the removal of guanine (Table 3), using the unique property that guanine bound to native PNP is fluorescent. Free guanine, and hypoxanthine, guanosine or inosine on or off enzyme are very weakly fluorescent at neutral pH (38, 49, 54). As shown in Table 3, the single turnover rates for the forward and the reverse chemical reaction for F159W-Leuko-PNP with inosine-hypoxanthine and native PNP with guanine-guanosine in the temperature range were determined (between 1 and 20 °C) or extrapolated (above 20 °C) from the Arrhenius equation. These values give the thermodynamic equilibrium constant (on-enzyme Keq) needed for interpretation of T-jump relaxation kinetic experiments. The on-enzyme Keq values determined for both native and the single-Trp PNP mutant vary by a factor of 20 in the temperature range between 1 and 37 °C (Table 3). While the on-enzyme Keq increases with increasing temperature for the native PNP catalyzed reaction of guanosine, it decreases for F159W-Leuko-PNP catalyzed reaction of inosine. Differences between F159-Leuko-PNP and native PNP are most likely attributed to altered interactions at the catalytic sites. This temperature dependence of the thermodynamic equilibrium constants is consistent with large enthalpic components for both enzymes with both substrates. The magnitude of on-enzyme Keq variation for the single Trp mutant as a function of temperature was twice as much as for native enzyme (Table 3), making F159W-Leuko-PNP a better subject for fluorescent T-jump relaxation kinetics. F159W-Leuko-PNP also has an equilibrium constant near unity in the temperature range between 20 and 30 °C, making it a favorable candidate for T-jump analyses.
FIGURE 3.

Pre-steady state kinetics. Panel A, B and C Arrhenius plots for the temperature dependences of the forward (panel A), the reverse (panel B) single turnover rates (k4 and k−4) and hypoxanthine association rates (kon) (panel C) for F159W-Leuko-PNP; data were fit to eq 3. Insets, stopped-flow traces of fluorescence decrease (panel A and C) or increase (panel B) as a function of time due to the formation/association or removal of hypoxanthine, respectively, in the temperature range from 1 to 25 °C (black, red, blue, green, orange and pink curves were recorded at 1, 5, 10, 15, 20 °C, respectively in panel A, 1, 3, 5, 7, 11 °C, respectively in panel B or 1, 6, 10, 15, 20 and 25 °C, respectively in panel C); traces were fit to eq 2. Panel D, integrated amount of inosine (•) formed during the reverse reaction of F159W-Leuko-PNP as a function of mixing time after the acid quenching of the reaction as indicated in the quench-flow kinetics section in Materials and Methods; data were fit to eq 2. Inset, a close up view for the integrated amount of inosine formed during the first 0.05 s of the reverse reaction.
Table 3.
Comparison of Pre-Steady State Kinetic Rates (forward and reverse)a and On-Enzyme Keqb for F159W-Leuko- and native PNPs
| |
F159W-Leuko-PNP (Ino-HX) |
Native PNP (Guo-Gua) |
||||
|---|---|---|---|---|---|---|
| Temp | k(chem)f s−1 | k(chem)r s−1 | Keq | k(chem)f s−1 | k(chem)r s−1 | Keq |
| 1 °C | 75 | 7 | 11.2 | 9 | 39 | 0.23 |
| 3 °C | 79 | 9 | 8.8 | 12 | 42 | 0.28 |
| 5 °C | 83 | 10 | 8 | 15 | 44 | 0.34 |
| 8 °C | 100 | 18 | 5.4 | 22 | 49 | 0.44 |
| 11 °C | 115 | 26 | 4.4 | 31 | 54 | 0.57 |
| 15 °C | 135 | 44 | 3.0 | 50 | 61 | 0.81 |
| 20 °C | 175 | 82 | 2.12 | 89 | 71 | 1.25 |
| 25 °C | 209 | 152 (108 ± 30)c | 1.4 | 154 | 80 | 1.92 |
| 30 °C | 255 | 275 | 0.93 | 262 | 93 | 2.81 |
| 37 °C | 334 | 608 | 0.55 | 536 | 111 | 4.82 |
Determined by stopped-flow fluorescent studies (in the temperature range between 1 to 20 °C or extrapolated from the Arrhenius equation above this temperature range) for F159W-Leuko-PNP with inosine/hypoxanthine and native PNP with guanosine/guanine as substrates for the forward (f)/reverse (r) reactions, respectively.
Calculated from the ratio between k(chem)f to k(chem.)r.
Determined at room temp (22 °C) by quench-flow for F159W-Leuko-PNP with hypoxanthine and ribose 1-phosphate.
Analysis of the temperature dependencies of the forward and the reverse single turnover numbers (k4 and k−4, Scheme 2) according to the Arrhenius and Eyring equations for native (49) or single Trp mutant PNPs showed linear increases of the ln(k) or ln(k/T) values with increasing temperature (Figure 3). Different activation enthalpies (ΔH‡) and activation entropies (ΔS‡) were determined for both enzymes with substrates in the forward and reverse directions of the chemical reaction (Table 4). At 25 °C, the activation enthalpy (ΔH‡), the activation entropy (TΔS‡), and the activation energy (Ea) of the reverse chemical reaction for F159W-Leuko-PNP was increased compared to those for the forward reaction (Table 4). In this case, the increase in activation entropy compensated for the high energy barrier (ΔH‡ and Ea) of the reverse reaction (55-58). In contrast, an increase of the activation enthalpy (ΔH‡), the activation entropy (TΔS‡), and the activation energy (Ea) for the forward chemical reaction compared to those for the reverse reaction were observed for native PNP (Table 4). With native PNP, the activation entropy increased to compensate for the high enthalpic barrier (ΔH‡ and Ea) of the forward reaction (55-58). Dynamic freedom of the substrate within the enzyme active site, the degree of freedom of the catalytic site residues, and solvent reorganization all contribute to the activation entropy (59, 60). The entropic contributions are most likely to result from altered system dynamics leading to transition state formation for the reverse and forward reaction catalyzed by F159W-Leuko-PNP and native PNP, respectively (59-63). Differences between F159-Leuko-PNP and native PNP are probably due to altered flexibility at the catalytic sites.
Table 4.
Comparison of the Thermodynamic Parameters of F159W-Leuko- and native PNPs at 25 °C
| |
F159W-Leuko-PNP (Ino-HX) |
Native PNP (Guo-Gua) |
||
|---|---|---|---|---|
| parametera | forward | reverse | forward | Reverse |
| k(chem), s−1 | 209 ± 2 | 152 ± 3 | 154 ± 3 | 80 ± 2 |
| ΔH‡, kJmol−1 | 28 ± 2 | 86 ± 6 | 78 ± 3 | 18 ± 1 |
| TΔS‡, kJmol−1 | −32 ± 2 | 26 ± 2 | 17 ± 1 | −44 ± 2 |
| ΔG‡, kJmol−1 | 60 ± 5 | 60 ± 6 | 60 ± 4 | 62 ± 4 |
| Ea‡, kJmol−1 | 30 ± 2 | 88 ± 6 | 80 ± 3 | 20 ± 0.5 |
Determined by fitting the stopped-flow fluorescence rates to the Arrhenius (eq 3) and the Eyring (eq 4) equations.
Association and Dissociation Binding Rates
The association and dissociation rates for hypoxanthine binding to F159W-Leuko-PNP-PO4 were determined by stopped-flow fluorometry. The rates of hypoxanthine association and the formation of F159W-Leuko-PNP-Hx-PO4 complexes increased monotonically with increasing temperature (Figure 3C). The rate of hypoxanthine association (kon) to F159W-Leuko-PNP-PO4 at 25 °C was determined to be 1.2 ± 0.1 × 10⁷ M−1s−1 and with a calculated dissociation rate (koff) of 178 ± 8 s−1 (Kd = 15 μM). The association and dissociation rates for guanine binding to Leuko-PNP-PO4 were previously determined by stopped-flow fluorometry (kon and koff values of 2.7 ± 0.1 × 10⁷ M−1s−1 and 86 ± 8 s−1, respectively) and T-jump relaxation kinetics (kon and koff values of 3.6 ± 0.2 × 10⁷ M−1s−1 and 142 ± 36 s−1, respectively) (38). The ∼2-fold differences in association or dissociation rates between F159W-Leuko-PNP with hypoxanthine and Leuko-PNP with guanine are consistent with slower association and faster dissociation rates of ligand (hypoxanthine) may be due to increased steric effects from the indol ring of W159 as compared to F159 in the parent enzyme.
T-Jump Relaxation Kinetics
Laser-induced T-jump (10 to 18, 20 to 27 and 25 to 32 °C) fluorescence relaxation profiles of equilibrated F159W-Leuko-PNP-inosine-PO4 ↔ F159W-Leuko-PNP-hypoxanthine-ribose1-phosphate and the F159W-Leuko-PNP-hypoxanthine-PO4 ternary complex showed at least 4 exponential relaxations with time constants of ∼0.1−1 μs for τ1, ∼1−100 μs for τ2, ∼100− 1,000 μs for τ3, and ∼1,000−10,000 μs for τ4 (Figures 4 and 5). It was difficult to unambiguously assign the fluorescence relaxation kinetic rates for τ1 andτ4. τ1, is most likely to represent substrate (inosine or hypoxanthine) binding to PNP, but the weak signal to noise ratio did not allow accurate experimental determination at this fast time scale (∼0.1−1 μs). Rates for guanine association (3.6 ± 0.2 × 10⁷ M−1 s−1) and dissociation (142 ± 36 s−1) from the Leuko-PNP-PO4 complex were previously determined using T-jump relaxation kinetics (38). For τ4 (k4 and k−4), the 1 to 15 ms relaxation time scale overlapped the cooling time range for this instrumentation, preventing the unequivocal experimental determination of this relaxation time. However, constants in the millisecond time scale are readily accessible using stopped-flow fluorescence techniques. The microscopic rate constants k2, k−2, k3 and k−3 for conformational changes of F159W-leuko-PNP (Scheme 2) were obtained directly by fitting the well-resolved T-jump relaxation times τ2−1 and τ3−1 to eqs 5 and 6, respectively (47, 64) (Figures 4 and 5, Table 5). The F159W-Leuko-PNP Trp reporter shows excellent signal to noise and kinetic resolution for protein conformational changes in the nanosecond to millisecond time scale (τ2 and τ3). Relaxation kinetic rates of ∼10,500, 2,200, 1,500, and 900 s−1 were determined at 25 °C for the active equilibrium of F159W-Leuko-PNP-inosine-PO4 ↔ F159W-Leuko-PNP-hypoxanthine-ribose1-phosphate based on fluorescent changes as a function of T-jump and reactant concentrations. These rates can be compared to those of 11,100, 2,700, 1,300, and 200 s−1 for the dead-end ternary complex of F159W-Leuko-PNP-hypoxanthine-PO4 (Table 6). The 900 s−1 relaxation rate is therefore related to inosine but not hypoxanthine active site interactions. The 200 s−1 relaxation rate specific to the non-chemically reactive ternary complex is likely to be a conformational change related to both Trp159 movement, giving the spectral change, and catalysis since the on-enzyme catalytic turnover rates are 209 s−1 and 152 s−1 for k4 (kchemf) and k−4 (kchemr), respectively, at 25 °C (Table 6). The experimentally determined constants (τ2−1 and τ3−1) are much faster than catalysis, and are proposed to represent binding, loop motions, domain changes, and residue alignments that are preludes to the relatively long (∼5 msec) dynamic search required to form the transition state.
FIGURE 4.

T-jump relaxation kinetics of F159W-Leuko-PNP-inosine-PO4 ↔ F159W-Leuko-PNP-hypoxanthine-ribose1-phosphate equilibrated system. Panels A1, B1 and C1, T-jump fluorescence relaxation traces at different concentrations of inosine (black, blue, green, red, pink, light blue, yellow, and orange traces were recorded at zero, 13, 32, 80, 160, 400, 560, and 800 μM inosine, respectively) as a function of time (μs). Panels A2, B2, and C2, fluorescence relaxations rates (τ2−1 [•] and τ3−1 [•]) determined from the fluorescence relaxation traces in the corresponding panels (A1, B1, and C1, respectively) as a function of free enzyme and inosine concentrations; red and blue lines are fit of the data to eqs 5 and 6, respectively. Temperature jumps were from 10 to 18 °C (panels A), 20 to 27 °C (panels B), and 25 to 32 °C (panels C). In curve fitting, the cooling process (>1 ms) was accounted for by a separate relaxation component with fixed time constant determined from temperature profiles.
FIGURE 5.

T-jump relaxation kinetics of F159W-Leuko-PNP-hypoxanthine-PO4 ternary complex equilibrated system. Panels A1, B1 and C1, T-jump fluorescence relaxation traces at different concentrations of hypoxanthine (black, blue, green, red, pink, light blue, yellow, dark red and orange traces were recorded at zero, 5.7, 12, 28, 60, 100, 200, 381 and 798 μM hypoxanthine, respectively) as a function of time (μs). Panels A2, B2, and C2, fluorescence relaxations rates (τ2−1 [•] and τ3−1 [•]) determined from the fluorescence relaxation traces in the corresponding panels (A1, B1, and C1, respectively) as a function of free enzyme and hypoxanthine concentrations; red and blue lines are fit of the data to eqs 5 and 6, respectively. Temperature jumps were from 10 to 18 °C (panels A), 20 to 27 °C (panels B), and 25 to 32 °C (panels C). ). In curve fitting, the cooling process (>1 ms) was accounted for by a separate relaxation component with fixed time constant determined from temperature profiles.
Table 5.
Comparison of T-Jump Rate Constants (ms−1) for the Two Equilibrated Systems of F159W-Leuko-PNP with (a) Inosine-PO4-Hypoxanthine-Ribose1-Phosphate and (b) Hypoxanthine-PO4
| |
|
τ2−1, ms−1 |
τ3−1, ms−1 |
||
|---|---|---|---|---|---|
| temp jump | Equilibrated system | k2a | k−2a | k3b | k−3b |
| 10 to 18 °C | a | 6.2 ± 0.6 | 1.4 ± 0.6 | 0.50 ± 0.17 | 0.4 ± 0.2 |
| b | 9.0 ±1.6 | 1.2 ± 0.1 | 1.20 ± 0.04 | 0.2 ± 0.1 | |
| 20 to 27 °C | a | 10.5 ± 0.6 | 1.5 ± 0.6 | 2.2 ± 0.5 | 0.9 ± 0.5 |
| b | 11.1 ± 2.2 | 1.3 ± 0.6 | 2.7 ± 0.1 | 0.2 ± 0.1 | |
| 25 to 32 °C | a | 10.3 ± 0.1 | 1.7 ± 0.1 | 3.1 ± 0.6 | 1.1 ± 0.7 |
| b | 11.8 ± 2.0 | 2.8 ± 0.3 | 2.4 ± 0.4 | 0.6 ± 0.3 | |
a, b Determined by fitting the relaxation rates (τ2−1 and τ3−1) to eqs 5 and 6, respectively.
Table 6.
Summary of all the Microscopic Rate Constants (Scheme 2) for the Two Equilibrated Systems of F159W-Leuko-PNP at 25 °C
| microscopic rates | F159W-Leuko-PNP-Ino-PO4-Hx-R1PO4 | F159W-Leuko-PNP-Hx-PO4 |
|---|---|---|
| k1, M−1s−1 | (1.2 ± 0.1) × 107 | |
| k−1, s−1 | 178 ± 8 | |
| k2, s−1 | 10,500 ± 600 | 11,100 ± 2,200 |
| k−2, s−1 | 1,500 ± 600 | 1,300 ± 600 |
| k3, s−1 | 2,200 ± 500 | 2,700 ± 100 |
| k−3, s−1 | 900 ± 500 | 200 ± 100 |
| k4, s−1 | 209 ± 2 | naa |
| k−4, s−1 | 152 ± 3 | naa |
Not available.
Thermodynamics of F159W-Leuko-PNP
The on-enzyme equilibrium for native and F159W-Leuko-PNP differ but both show strong temperature dependence, indicating a substantial enthalpic component to the on-enzyme chemical equilibria (Table 3). Quantitation of these differences show equivalent ΔG‡ values for native and F159W-Leuko-PNP but substantial differences in ΔH‡ values and TΔS‡ values (Table 4). Transition state analysis of human PNP mutants with amino acid changes remote from the catalytic site have indicated that the full dynamic structure of the protein can influence transition state structure (14, 51). With F159W-Leuko-PNP, at 25 °C, the conversion of bound inosine and phosphate to the transition state is almost equally distributed into enthalpic and entropic components (Figure 6). With equivalent ΔG‡ values for forward and reverse reactions the Keq is near unity at this temperature. The reverse reaction of enzyme-bound hypoxanthine and ribose 1-phosphate is dominated by the enthalpic component by 3-fold compared to the TΔS‡ value.
FIGURE 6.

T-Jump Relaxations
T-Jump experiments with increasing concentrations of enzyme, inosine, hypoxanthine and phosphate are capable of distinguishing time-resolved species and first order from higher-order reactions (Figures 4 and 5 and Scheme 2). At high concentrations of inosine and phosphate, the enzyme exists in an equilibrating mixture of fully saturated forms (Figure 6). Altered environments of W159 are seen, with increased fluorescence intensity for the inosine or free enzyme complexes and quenched fluorescence with the complexes bound with hypoxanthine (Figure 2). Over the titrations and T-jumps with equilibrated enzyme, inosine and phosphate, three relaxations are resolved (Figure 4 and Table 6). Rate constants k4 and k−4 were established with stopped flow studies and are the chemical step for enzyme bound reagents (Scheme 2 and Table 4). Three of the rate constants associated with steps k2, k−2, k3 and k−3 are faster than the chemical steps (k4 and k−4 in Scheme 2a), but the constants at 200 s−1 in both Schemes 2a and 2b are the same as the rate of chemical conversion of enzyme-bound inosine to enzyme-bound hypoxanthine. In the presence of the fully equilibrating catalytic reaction, this rate can be reasonably assigned to chemistry, and in the enzyme saturated with only hypoxanthine and phosphate, to a change in W159 linked to catalysis.
The physiological reaction of PNP involves inosine binding to the enzyme-phosphate complex (Scheme 2a) followed by two time-resolved conformational changes with forward and reverse first-order rate constants from 900 to 10,500 s−1. As these must influence W159 to give the observed fluorescent changes, two of these constants involve closing and opening of the W159 loop that covers the catalytic site, and the second pair of constants can be proposed to be the catalytic site reorganization in response to catalytic site closing. A comparison of the substrate analogue complexes with transition state analogues bound at the catalytic site of bovine PNP indicates that as many as six new H-bonds form in the tightly-bound transition state complex (65). The dynamic approach to transition state formation based on the W159 fluorescent probe can be summarized as 1) substrate binding at ∼1.2 × 10⁷ M−1s−1, 2) W159 loop closing at 900 to 10,500 s−1, 3) a conformational change that forms a reactant environment providing access to the transition state with a similar time constant, 4) a dynamic search lasting for reciprocal 210 s−1 that forms the transition state, and 5) relaxation of the system to release products at a rate of 22 s−1. Computational analysis by transition path sampling for human PNP indicates a transition state lifetime of 10 fsec (17), emphasizing that transition state lifetime is extremely short relative to the protein conformational dynamics probed by spectroscopic techniques. Only local dynamic motion (side chain atomic vibrations) are coupled to the transition state lifetime, and the conformations observed on the nsec to msec timescale are relatively static pre-equilibrated states relative to the lifetime of the transition state.
Conclusion
F159W-Leuko-PNP provides a reporter group for catalytic site geometry changes associated with on-enzyme ligand binding, conformational changes and chemistry. T-jump analysis of enzyme complexes establish a minimum of four distinct structural states for the enzyme saturated with substrates and products. Product release is rate limiting for PNPs (49, 66) (22 s−1 at 25 °C for F159W-Leuko-PNP) and the rate of chemical conversion at the catalytic site is ∼5 ms at 25 °C. In a dynamic interpretation of catalysis, this time involves a dynamic search to optimize the catalytic site geometry needed to cross the transition state barrier. Promoting vibrations exemplified by the O5’−O4’ compression mode associated with catalysis occur on the ∼30 femtosecond time scale (18), therefore ∼1.6 × 10¹¹ such excursions occur on average to cross the transition state barrier. T-jump analysis of F159W-Leuko-PNP establish multiple protein conformational changes influencing the fluorescence of W159 that occur on the nanosecond to millisecond time scale as the enzyme organizes to place catalytic site groups close to the positions from which catalysis occurs. Based on the extreme differences in time scales between the promoting vibrations (∼30 fs) linked directly to transition state formation, and the short lifetime of the transition state (10 fs), the states detected by fluorescence changes of F159W-Leuko-PNP demonstrate multiple time-resolved conformational changes in PNP that are relatively stable states on the time scale of transition state formation. These are proposed to organize catalytic site groups to provide access for the more rapid motions involved in transition state formation. Formation of the Michaelis complex is followed by conformational changes which are fast on the timescale of catalytic turnover, but slow compared to the lifetime of the transition state. The precise protein motions that occur during these conformational changes and the relevance of these motion to the pathway to the transition state remain to be determined
Acknowledgments
† Supported by NIH Research Grants GM41916 and GM068036
Footnotes
Abbreviations: PNP, native human purine nucleoside phosphorylase; Leuko-PNP, a tryptophan-free mutant PNP with all tryptophan residues (W16, W94, and W178) replaced with tyrosine residues; F159W-Leuko-PNP, Leuko PNP with tyrosine 159 replaced by tryptophan.
References
- 1.Giblett ER, Ammann AJ, Wara DW, Sandman R, Diamond LK. Nucleoside-phosphorylase deficiency in a child with severely defective T-cell immunity and normal B-cell immunity. Lancet. 1975;1:1010–1013. doi: 10.1016/s0140-6736(75)91950-9. [DOI] [PubMed] [Google Scholar]
- 2.Krenitsky TA, Tuttle JV, Koszalka GW, Chen IS, Beacham LM, 3rd, Rideout JL, Elion GB. Deoxycytidine kinase from calf thymus. Substrate and inhibitor specificity. J. Biol. Chem. 1976;251:4055–4061. [PubMed] [Google Scholar]
- 3.Mitchell BS, Mejias E, Daddona PE, Kelley WN. Purinogenic immunodeficiency diseases: selective toxicity of deoxyribonucleosides for T cells. Proc. Natl. Acad. Sci. U. S. A. 1978;75:5011–5014. doi: 10.1073/pnas.75.10.5011. [DOI] [PMC free article] [PubMed] [Google Scholar]
- 4.Núñez S, Wing C, Antoniou D, Schramm VL, Schwartz SD. Insight into catalytically relevant correlated motions in human purine nucleoside phosphorylase. J. Phys. Chem. A. 2006;110:463–472. doi: 10.1021/jp051277u. [DOI] [PubMed] [Google Scholar]
- 5.Stoeckler JD, Cambor C, Parks RE., Jr. Human erythrocytic purine nucleoside phosphorylase: reaction with sugar modified nucleoside substrates. Biochemistry. 1980;19:102–107. doi: 10.1021/bi00542a016. [DOI] [PubMed] [Google Scholar]
- 6.Ullman B, Gudas LJ, Clift SM, Martin DW., Jr. Isolation and characterization of purine-nucleoside phosphorylase-deficient T-lymphoma cells and secondary mutants with altered ribonucleotide reductase: genetic model for immunodeficiency disease. Proc. Natl. Acad. Sci. U. S. A. 1979;76:1074–1078. doi: 10.1073/pnas.76.3.1074. [DOI] [PMC free article] [PubMed] [Google Scholar]
- 7.Duvic M, Olsen EA, Omura GA, Maize JC, Vonderheid EC, Elmets CA, Shupack JL, Demierre MF, Kuzel TM, Sanders DY. A phase III, randomized, double-blind, placebo-controlled study of peldesine (BCX-34) cream as topical therapy for cutaneous T-cell lymphoma. J. Am. Acad. Dermatol. 2001;44:940–947. doi: 10.1067/mjd.2001.113478. [DOI] [PubMed] [Google Scholar]
- 8.Ealick SE, Babu YS, Bugg CE, Erion MD, Guida WC, Montgomery JA, Secrist JA., 3rd Application of crystallographic and modeling methods in the design of purine nucleoside phosphorylase inhibitors. Proc. Natl. Acad. Sci. U. S. A. 1991;88:11540–11544. doi: 10.1073/pnas.88.24.11540. [DOI] [PMC free article] [PubMed] [Google Scholar]
- 9.Schramm VL. Development of transition state analogues of purine nucleoside phosphorylase as anti-T-cell agents. Biochim. Biophys. Acta. 2002;1587:107–117. doi: 10.1016/s0925-4439(02)00073-x. [DOI] [PubMed] [Google Scholar]
- 10.De Azevedo WF, Jr., Canduri F, dos Santos DM, Silva RG, de Oliveira JS, de Carvalho LP, Basso LA, Mendes MA, Palma MS, Santos DS. Crystal structure of human purine nucleoside phosphorylase at 2.3Å resolution. Biochem. Biophys. Res. Commun. 2003;308:545–552. doi: 10.1016/s0006-291x(03)01431-1. [DOI] [PubMed] [Google Scholar]
- 11.Koellner G, Luic M, Shugar D, Saenger W, Bzowska A. Crystal structure of calf spleen purine nucleoside phosphorylase in a complex with hypoxanthine at 2.15 Å resolution. J. Mol. Biol. 1997;265:202–216. doi: 10.1006/jmbi.1996.0730. [DOI] [PubMed] [Google Scholar]
- 12.Rinaldo Matthis A, Murkin AS, Ramagopal UA, Clinch K, Mee SP, Evans GB, Tyler PC, Furneaux RH, Almo SC, Schramm VL. L Enantiomers of transition state analogue inhibitors bound to human purine nucleoside phosphorylase. J. Am. Chem. Soc. 2008;130:842–844. doi: 10.1021/ja710733g. [DOI] [PMC free article] [PubMed] [Google Scholar]
- 13.Shi W, Ting LM, Kicska GA, Lewandowicz A, Tyler PC, Evans GB, Furneaux RH, Kim K, Almo SC, Schramm VL. Plasmodium falciparum purine nucleoside phosphorylase: crystal structures, immucillin inhibitors, and dual catalytic function. J. Biol. Chem. 2004;279:18103–18106. doi: 10.1074/jbc.C400068200. [DOI] [PubMed] [Google Scholar]
- 14.Saen-Oon S, Ghanem M, Schramm VL, Schwartz SD. Remote mutations and active site dynamics correlate with catalytic properties of purine nucleoside phosphorylase. Biophys. J. 2008;94:4078–4088. doi: 10.1529/biophysj.107.121913. [DOI] [PMC free article] [PubMed] [Google Scholar]
- 15.Antoniou D, Basner J, Nunez S, Schwartz SD. Computational and theoretical methods to explore the relation between enzyme dynamics and catalysis. Chem. Rev. 2006;106:3170–3187. doi: 10.1021/cr0503052. [DOI] [PubMed] [Google Scholar]
- 16.Hammes GG. Multiple conformational changes in enzyme catalysis. Biochemistry. 2002;41:8221–8228. doi: 10.1021/bi0260839. [DOI] [PubMed] [Google Scholar]
- 17.Saen-Oon S, Quaytman-Machleder S, Schramm VL, Schwartz SD. Atomic detail of chemical transformation at the transition state of an enzymatic reaction. Proc. Natl. Acad. Sci. U. S. A. 2008;105:16543–16548. doi: 10.1073/pnas.0808413105. [DOI] [PMC free article] [PubMed] [Google Scholar]
- 18.Schramm VL. Enzymatic transition states and transition state analogues. Current Opinion in Structural Biology. 2005;15:604–613. doi: 10.1016/j.sbi.2005.10.017. [DOI] [PubMed] [Google Scholar]
- 19.Boehr DD, Dyson HJ, Wright PE. An NMR perspective on enzyme dynamics. Chem Rev. 2006;106:3055–3079. doi: 10.1021/cr050312q. [DOI] [PubMed] [Google Scholar]
- 20.Boehr DD, McElheny D, Dyson HJ, Wright PE. The dynamic energy landscape of dihydrofolate reductase catalysis. Science. 2006;313:1638–1642. doi: 10.1126/science.1130258. [DOI] [PubMed] [Google Scholar]
- 21.Eisenmesser EZ, Millet O, Labeikovsky W, Korzhnev DM, Wolf-Watz M, Bosco DA, Skalicky JJ, Kay LE, Kern D. Intrinsic dynamics of an enzyme underlies catalysis. Nature. 2005;438:117–121. doi: 10.1038/nature04105. [DOI] [PubMed] [Google Scholar]
- 22.Johnson E, Palmer AG, 3rd, Rance M. Temperature dependence of the NMR generalized order parameter. Proteins. 2007;66:796–803. doi: 10.1002/prot.21274. [DOI] [PubMed] [Google Scholar]
- 23.Kern D, Eisenmesser EZ, Wolf-Watz M. Enzyme dynamics during catalysis measured by NMR spectroscopy. Methods Enzymol. 2005;394:507–524. doi: 10.1016/S0076-6879(05)94021-4. [DOI] [PubMed] [Google Scholar]
- 24.Massi F, Palmer AG., 3rd Temperature dependence of NMR order parameters and protein dynamics. J. Am. Chem. Soc. 2003;125:11158–11159. doi: 10.1021/ja035605k. [DOI] [PubMed] [Google Scholar]
- 25.Massi F, Wang C, Palmer AG., 3rd Solution NMR and computer simulation studies of active site loop motion in triosephosphate isomerase. Biochemistry. 2006;45:10787–10794. doi: 10.1021/bi060764c. [DOI] [PubMed] [Google Scholar]
- 26.Palmer AG., 3rd NMR characterization of the dynamics of biomacromolecules. Chem. Rev. 2004;104:3623–3640. doi: 10.1021/cr030413t. [DOI] [PubMed] [Google Scholar]
- 27.Brewer SH, Song B, Raleigh DP, Dyer RB. Residue specific resolution of protein folding dynamics using isotope-edited infrared temperature jump spectroscopy. Biochemistry. 2007;46:3279–3285. doi: 10.1021/bi602372y. [DOI] [PubMed] [Google Scholar]
- 28.Desamero R, Rozovsky S, Zhadin N, McDermott A, Callender R. Active site loop motion in triosephosphate isomerase: T-jump relaxation spectroscopy of thermal activation. Biochemistry. 2003;42:2941–2951. doi: 10.1021/bi026994i. [DOI] [PubMed] [Google Scholar]
- 29.Khajehpour M, Wu L, Liu S, Zhadin N, Zhang ZY, Callender R. Loop dynamics and ligand binding kinetics in the reaction catalyzed by the Yersinia protein tyrosine phosphatase. Biochemistry. 2007;46:4370–4378. doi: 10.1021/bi602335x. [DOI] [PubMed] [Google Scholar]
- 30.McClendon S, Vu DM, Clinch K, Callender R, Dyer RB. Structural transformations in the dynamics of Michaelis complex formation in lactate dehydrogenase. Biophys. J. 2005;89:L07–09. doi: 10.1529/biophysj.105.064675. [DOI] [PMC free article] [PubMed] [Google Scholar]
- 31.McClendon S, Zhadin N, Callender R. The approach to the Michaelis complex in lactate dehydrogenase: the substrate binding pathway. Biophys. J. 2005;89:2024–2032. doi: 10.1529/biophysj.105.062604. [DOI] [PMC free article] [PubMed] [Google Scholar]
- 32.Callender R, Dyer RB. Advances in time-resolved approaches to characterize the dynamical nature of enzymatic catalysis. Chem. Rev. 2006;106:3031–3042. doi: 10.1021/cr050284b. [DOI] [PubMed] [Google Scholar]
- 33.Zhadin N, Gulotta M, Callender R. Probing the role of dynamics in hydride transfer catalyzed by lactate dehydrogenase. Biophys. J. 2008;95:1974–1984. doi: 10.1529/biophysj.108.132464. [DOI] [PMC free article] [PubMed] [Google Scholar]
- 34.Crehuet R, Field MJ. A transition path sampling study of the reaction catalyzed by the enzyme chorismate mutase. J. Phys. Chem. B. 2007;111:5708–5718. doi: 10.1021/jp067629u. [DOI] [PubMed] [Google Scholar]
- 35.Gao J, Major DT, Fan Y, Lin YL, Ma S, Wong KY. Hybrid quantum and classical methods for computing kinetic isotope effects of chemical reactions in solutions and in enzymes. Methods Mol. Biol. 2008;443:37–62. doi: 10.1007/978-1-59745-177-2_3. [DOI] [PubMed] [Google Scholar]
- 36.Quaytman SL, Schwartz SD. Reaction coordinate of an enzymatic reaction revealed by transition path sampling. Proc. Natl. Acad. Sci. U. S. A. 2007;104:12253–12258. doi: 10.1073/pnas.0704304104. [DOI] [PMC free article] [PubMed] [Google Scholar]
- 37.Jimenez A, Clapes P, Crehuet R. A dynamic view of enzyme catalysis. J. Mol. Model. 2008;14:735–746. doi: 10.1007/s00894-008-0283-2. [DOI] [PubMed] [Google Scholar]
- 38.Ghanem M, Saen-oon S, Zhadin N, Wing C, Cahill SM, Schwartz SD, Callender R, Schramm VL. Tryptophan-free human PNP reveals catalytic site interactions. Biochemistry. 2008;47:3202–3215. doi: 10.1021/bi702491d. [DOI] [PubMed] [Google Scholar]
- 39.Lewandowicz A, Schramm VL. Transition state analysis for human and Plasmodium falciparum purine nucleoside phosphorylases. Biochemistry. 2004;43:1458–1468. doi: 10.1021/bi0359123. [DOI] [PubMed] [Google Scholar]
- 40.Kim BK, Cha S, Parks RE., Jr. Purine nucleoside phosphorylase from human erythroyctes. II. Kinetic analysis and substrate-binding studies. J. Biol. Chem. 1968;243:1771–1776. [PubMed] [Google Scholar]
- 41.Lewandowicz A, Shi W, Evans GB, Tyler PC, Furneaux RH, Basso LA, Santos DS, Almo SC, Schramm VL. Over-the-barrier transition state analogues and crystal structure with Mycobacterium tuberculosis purine nucleoside phosphorylase. Biochemistry. 2003;42:6057–6066. doi: 10.1021/bi0343830. [DOI] [PubMed] [Google Scholar]
- 42.Kicska GA, Tyler PC, Evans GB, Furneaux RH, Kim K, Schramm VL. Transition State Analogue Inhibitors of Purine Nucleoside Phosphorylase from Plasmodium falciparum. J. Biol. Chem. 2002;277:3219–3225. doi: 10.1074/jbc.M105905200. [DOI] [PubMed] [Google Scholar]
- 43.Rinaldo-Matthis A, Wing C, Ghanem M, Deng H, Wu P, Gupta A, Tyler PC, Evans GB, Furneaux RH, Almo SC, Wang CC, Schramm VL. Inhibition and Structure of Trichomonas vaginalis Purine Nucleoside Phosphorylase with Picomolar Transition State Analogues. Biochemistry. 2007;46:659–668. doi: 10.1021/bi061515r. [DOI] [PMC free article] [PubMed] [Google Scholar]
- 44.Miles RW, Tyler PC, Furneaux RH, Bagdassarian CK, Schramm VL. One-third-the-sites transition-state inhibitors for purine nucleoside phosphorylase. Biochemistry. 1998;37:8615–8621. doi: 10.1021/bi980658d. [DOI] [PubMed] [Google Scholar]
- 45.Singh V, Evans GB, Lenz DH, Mason JM, Clinch K, Mee S, Painter GF, Tyler PC, Furneaux RH, Lee JE, Howell PL, Schramm VL. Femtomolar transition state analogue inhibitors of 5'-methylthioadenosine/S-adenosylhomocysteine nucleosidase from Escherichia coli. J. Biol. Chem. 2005;280:18265–18273. doi: 10.1074/jbc.M414472200. [DOI] [PubMed] [Google Scholar]
- 46.Dawson RMC, Elliott D, Elliott WH, Jones KM. Data for biochemical research. Third ed. Oxford Univ. press; New York: 1986. Spectral data and pKa values for purines, pyrimidines, nucleosides, and nucleotides; pp. 103–114. [Google Scholar]
- 47.Leffler JE, Grunwald E. Rates and Equilibria of Organic Reactions. Wiley; New York: 1963. pp. 77–86. [Google Scholar]
- 48.Kline PC, Schramm VL. Purine nucleoside phosphorylase. Inosine hydrolysis, tight binding of the hypoxanthine intermediate, and third-the-sites reactivity. Biochemistry. 1992;31:5964–5973. doi: 10.1021/bi00141a003. [DOI] [PubMed] [Google Scholar]
- 49.Ghanem M, Li L, Wing C, Schramm VL. Altered thermodynamics from remote mutations altering human toward bovine purine nucleoside phosphorylase. Biochemistry. 2008;47:2559–2564. doi: 10.1021/bi702132e. [DOI] [PubMed] [Google Scholar]
- 50.Li L, Luo M, Ghanem M, Taylor EA, Schramm VL. Second-sphere amino acids contribute to transition-state structure in bovine purine nucleoside phosphorylase. Biochemistry. 2008;47:2577–2583. doi: 10.1021/bi7021365. [DOI] [PubMed] [Google Scholar]
- 51.Luo M, Li L, Schramm VL. Remote mutations alter transition-state structure of human purine nucleoside phosphorylase. Biochemistry. 2008;47:2565–2576. doi: 10.1021/bi702133x. [DOI] [PubMed] [Google Scholar]
- 52.Lakowicz J. Principles of Fluorescence Spectroscopy. 2nd ed. Kluwer Academic publishers; 1999. [Google Scholar]
- 53.Vivian JT, Callis PR. Mechanisms of tryptophan fluorescence shifts in proteins. Biophys. J. 2001;80:2093–2109. doi: 10.1016/S0006-3495(01)76183-8. [DOI] [PMC free article] [PubMed] [Google Scholar]
- 54.Assenza SP, Brown PR. Ultraviolet and fluorescence characterization of purines and pyrimidines by post-column pH manipulation. J. Chromatogr. 1984;289:355–365. [Google Scholar]
- 55.Sharp K. Entropy-enthalpy compensation: fact or artifact? Protein Sci. 2001;10:661–667. doi: 10.1110/ps.37801. [DOI] [PMC free article] [PubMed] [Google Scholar]
- 56.Street TO, Bradley CM, Barrick D. An improved experimental system for determining small folding entropy changes resulting from proline to alanine substitutions. Protein Sci. 2005;14:2429–2435. doi: 10.1110/ps.051505705. [DOI] [PMC free article] [PubMed] [Google Scholar]
- 57.Vaz DC, Rodrigues JR, Sebald W, Dobson CM, Brito RM. Enthalpic and entropic contributions mediate the role of disulfide bonds on the conformational stability of interleukin-4. Protein Sci. 2006;15:33–44. doi: 10.1110/ps.051593306. [DOI] [PMC free article] [PubMed] [Google Scholar]
- 58.Villa J, Strajbl M, Glennon TM, Sham YY, Chu ZT, Warshel A. How important are entropic contributions to enzyme catalysis? Proc. Natl. Acad. Sci. U. S. A. 2000;97:11899–11904. doi: 10.1073/pnas.97.22.11899. [DOI] [PMC free article] [PubMed] [Google Scholar]
- 59.Ottosson J, Fransson L, Hult K. Substrate entropy in enzyme enantioselectivity: an experimental and molecular modeling study of a lipase. Protein Sci. 2002;11:1462–1471. doi: 10.1110/ps.3480102. [DOI] [PMC free article] [PubMed] [Google Scholar]
- 60.Ottosson J, Rotticci-Mulder JC, Rotticci D, Hult K. Rational design of enantioselective enzymes requires considerations of entropy. Protein Sci. 2001;10:1769–1774. doi: 10.1110/ps.13501. [DOI] [PMC free article] [PubMed] [Google Scholar]
- 61.Jonsson, Wehtje E, Adlercreutz P, Mattiasson B. Thermodynamic and kinetic aspects on water vs. organic solvent as reaction media in the enzyme-catalysed reduction of ketones. Biochim. Biophys. Acta. 1999;1430:313–322. doi: 10.1016/s0167-4838(99)00012-6. [DOI] [PubMed] [Google Scholar]
- 62.Verheyden G, Matrai J, Volckaert G, Engelborghs Y. A fluorescence stopped-flow kinetic study of the conformational activation of α-chymotrypsin and several mutants. Protein Sci. 2004;13:2533–2540. doi: 10.1110/ps.04709604. [DOI] [PMC free article] [PubMed] [Google Scholar]
- 63.Jensen MP, Payeras AM, Fiedler AT, Costas M, Kaizer J, Stubna A, Munck E, Que L., Jr. Kinetic analysis of the conversion of nonheme (alkylperoxo)iron(III) species to iron(IV) complexes. Inorg. Chem. 2007;46:2398–2408. doi: 10.1021/ic0607787. [DOI] [PMC free article] [PubMed] [Google Scholar]
- 64.Hammes GG, Schimmel PR. Rapid Reactions and Transient states. In: Boyer PD, editor. The Enzymes. Academic Press; New York: 1970. pp. 67–114. [Google Scholar]
- 65.Fedorov A, Shi W, Kicska G, Fedorov E, Tyler PC, Furneaux RH, Hanson JC, Gainsford GJ, Larese JZ, Schramm VL, Almo SC. Transition State Structure of Purine Nucleoside Phosphorylase and Principles of Atomic Motion in Enzymatic Catalysis. Biochemistry. 2001;40:853–860. doi: 10.1021/bi002499f. [DOI] [PubMed] [Google Scholar]
- 66.Schramm VL. Enzymatic transition states: thermodynamics, dynamics and analogue design. Arch. Biochem. Biophys. 2005;433:13–26. doi: 10.1016/j.abb.2004.08.035. [DOI] [PubMed] [Google Scholar]