
Fig. 4.
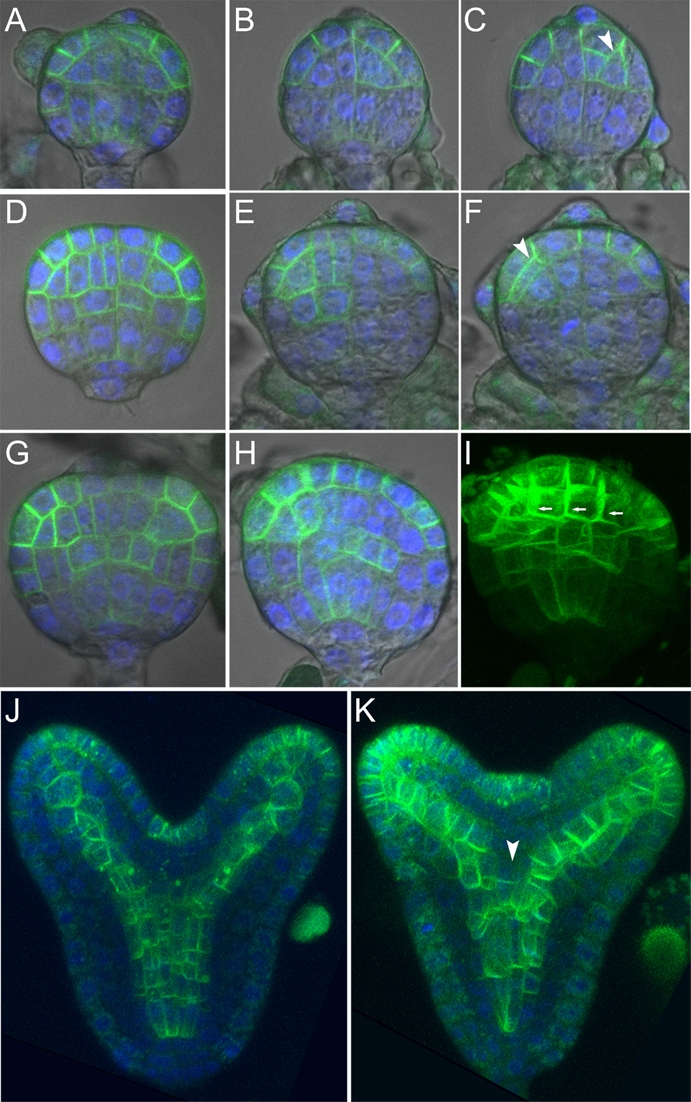
Expression of PIN1:GFP in wild-type and iaa18-1 embryos. (A-C) Wild-type (A) and iaa18-1/IAA18 (B,C) early globular stage embryos. Arrowhead in (C) indicates misaligned periclinal cell division planes in adjacent L1 cells. (D-F) Wild-type (D) and iaa18-1/IAA18 (E,F) mid-globular stage embryos. Arrowhead in F indicates an ectopic periclinal cell division. (G-I) Wild-type (G) and iaa18-1/IAA18 (H,I) transition stage embryos. Small arrows in I indicate apparent polarity of PIN1:GFP localization away from the cotyledon primordium on the right. (J,K) Wild-type (J) and iaa18-1/IAA18 (K) torpedo stage embryos. Arrowhead in K indicates a cell layer lacking fluorescence in the mutant embryo. (A-H) Optical sections (1 μm) through the central apical-basal axis of the embryo. (B,C,E,F) Adjacent sections through the same iaa18-1/IAA18 early and mid-globular embryos, respectively. (I) A z-stack projection of the same iaa18-1/IAA18 embryo as in H. (J,K) Z-stack projections of 16 1 μm sections through the central apical-basal axis of the embryo. Wild-type and mutant embryos were fixed, stained with DAPI and photographed in parallel using identical settings. (A-H) Overlays of fluorescent and DIC images. The PIN1:GFP lines used have been described previously (Heisler et al., 2005) (see Table S4 in the supplementary material).