

Abstract
Objective
Although depression has been associated with hyperactivity of the hypothalamo-pituitary-adrenal (HPA) axis, recent studies among depressed elderly have found decreased cortisol levels, which may be due to underlying physical frailty associated with HPA-axis hypoactivity. The authors examined the relationship between urinary cortisol level and late-life depressive symptoms. The authors also explored whether hypo- and hypercortisolemic depressive symptoms are qualitatively different.
Methods
Data are from 881 community-dwelling participants, average age 74.2 years, of the Aging in the Chianti Area Study. Depressive symptoms were assessed using the Center for Epidemiologic Studies Depression Scale (CES-D) scale and cortisol levels were determined in 24-hour urine samples.
Results
Mean urinary cortisol level was 98.9 μg/24 hours (SD=47.8), and 31% of the sample had significant depressive symptoms (CES-D ≥16). There was no linear association between urinary cortisol level and depressive symptoms; however, there was a nonlinear association between urinary cortisol level and depressive symptoms. Older persons in the lowest and highest urinary cortisol deciles were 2.2 and 1.9 times more likely to have significant depressive symptoms than older persons in all other deciles. Depressed persons with low cortisol presented more physical frailty than depressed persons with high cortisol.
Conclusion
Late-life depressive symptoms are associated with both hyperactivity and hypoactivity of the HPA axis, which suggests distinct mechanisms for these associations.
Keywords: Depressive symptoms, cortisol, hypothalamo-pituitary-adrenal axis, frailty, older persons
Depression has been linked to hyperactivity of the hypothalamo-pituitary-adrenal (HPA) axis. Several studies have observed increased cortisol levels among depressed persons.1-5 Otte’s meta-analysis6 indicated that aging increases the cortisol response to challenge, which may indicate that—especially in old age—the cortisol response may be a risk factor for neuropsychiatric disorders. Indeed, higher cortisol levels among older depressed patients have been consistently found,1-3 which could contribute to adverse health consequences such as cardiovascular risk factors and disease.7,8 However, the biological underpinnings of late-life depression appear to be complex: recent studies showed lower rather than higher cortisol levels among depressed older persons.9,10 It has been hypothesized that these findings may be due to underlying physical frailty causing chronic insufficiency of the HPA axis in depressed elderly.10-12
Based on previous findings, the association between late-life depression and cortisol may be hypothesized to represent a nonlinear curve with depressive symptoms being associated with hypo- as well as hypercortisolemia. These associations may represent different pathophysiological phenomena: the link between hypocortisolemia and depressive symptoms may be a result of underlying physical frailty and exhaustion, whereas hypercortisolemia may be linked to depressive symptoms when depressive symptoms occur in the context of a dys-regulated stress-response independent of physical frailty. The present study examines a large community-based older sample to determine whether depressive symptoms are associated with low and high levels of 24-hour urinary cortisol. A second goal was to explore whether hypocortisolemic and hypercortisolemic depressive symptoms are different phenomena, thus depressed persons with low versus high cortisol levels are compared in terms of depression and frailty characteristics.
METHODS
Data are from the Invecchiare in Chianti (Aging in the Chianti area [InCHIANTI]) study, a prospective population-based study of older people conducted by the Italian National Research Council of Aging (INRCA). Baseline data collection consisted of an interview and medical exam conducted between September 1998 and March 2000.13 The study protocol was approved by the INRCA ethical committee and all participants gave informed consent.
For the present study, 1,155 participants aged 65 years and over were randomly selected from residents of two towns in the Chianti area (Greve in Chianti and Bagno a Ripoli) using a multistage stratified sampling method.13 Because of missing (N=190, 16.5%) or incomplete (<20 hours) urine collection (N=58, 5.0%) or missing Center for Epidemiologic Studies Depression Scale (CES-D) data (N=26, 2.3%), the present analyses included 881 participants. Participants with missing urine samples were significantly older (79.7 ± 9.1 years versus 74.1 ± 6.6 years; t(1153)=11.0, p <0.001), more often female (63.1% versus 54.7%, χ2 (1)=6.0, p=0.01), and reported higher depressive symptoms (CES-D score 15.3 ± 8.6 versus 12.6 ± 8.7; t(1077)=4.0, p <0.001) than participants included in the present study.
24-Hour Urinary Cortisol
The assessment of urinary cortisol over a 24-hour period provides a rather stable index of the total amount of cortisol released and measures the biologically active cortisol.14 Study participants were asked to collect all urine produced during a 24-hour period starting after the first voided urine following awakening and including the first voided urine on the following day. At assessment, 10-mL aliquots of urine were prepared and stored at -80°C for later assaying. Urinary-free cortisol was measured by an immunochemiluminescence method and an ADVIA-Centaur immunoassay system (Bayer Diagnostics). Intra- and interassay coefficients of variation were below 3.0% and the normal reference range was 28.5-213 μg cortisol excreted over 24 hours. Continuous levels and decile categorization were used in the analyses.
Depressive Symptoms
Depressive symptoms were measured with the CES-D scale, a 20-item self-report measurement of depressive symptoms experienced during the previous week.15 The scale, ranging from 0 to 60, has been shown to be a valid and reliable instrument incommunity-dwelling as well as diseased older populations.16,17 Analyses were performed with continuous CES-D score as well as a dichotomous indicator for clinically relevant depressive symptoms (CES-D ≥16) with proven criterion validity for major depression.16 For comparing depression characteristics between groups, CES-D subscales were used: somatic symptoms (7 items, range: 0-28), negative affect (seven items, range: 0-28), lack of positive affect (four items, range: 0-16).
Covariates
Covariates included age, sex, urine volume (in liters), body mass index (BMI; weight in kilograms divided by height squared in meters), smoking status and comorbid conditions (diabetes, coronary heart disease [CHD], congestive heart failure [CHF], stroke, cancer) determined using an adjudication process including self-reported history, medical exam and records information. Cognitive status was measured using the Mini-Mental State Exam (MMSE). Serum and urinary creatinine were measured by a modified Jaffe method and used to calculate creatinine clearance as an indication of potential chronic kidney disease. All medications regularly taken in the previous two weeks were recorded and coded, which provided information about the use of antidepressants, benzodiazepines, and corticosteroids.
Frailty Indicators
Physical frailty indicators, as defined by Fried et al.,18 included reported lack of energy during the past month, low physical activity (≤2 hours of light exercise/week), poor walking speed, and poor muscle strength (lowest quintiles). Walking speed (m/sec) was defined as the best performance of two 4-m walks.19 Isometric knee extension muscle strength (in kilograms, averaged over two legs) was assessed by a dynamometer (Rolyan dynamometer A729-300, Germantown, WI). These four indicators are central in the physical frailty syndrome and have predictive validity for various adverse health outcomes.18
Statistical Analyses
The association between deciles of urinary cortisol and depressive symptoms was explored by creating a figure plotting average CES-D score by urinary cortisol deciles. A linear regression analysis, adjusted for covariates, was conducted to explore the association between the continuous cortisol level and CES-D score. To test for potential nonlinear relationships, a squared term for urinary cortisol level was entered in the linear regression analysis which already contained the linear term for urinary cortisol level. These two analyses were repeated for men and women separately to check consistency across sex. Logistic regression models were conducted to associate cortisol levels to the dichotomous depressive symptoms indicator. Finally, CES-D (subscale) scores and frailty indicators were compared between depressed elders with low and high cortisol levels using χ2 and Student’s t-test statistics.
RESULTS
Sample Descriptives
The mean age of the study sample was 74.1 ± 6.6 years and 54.7% were women. An average of 1.5 ± 0.6 L of urine was collected during 23.3 ± 1.2 hours. The mean 24-hour urinary cortisol level was 98.9 ± 47.8 μg. A total of 273 respondents (31.0%) were depressed (CES-D ≥16). Depressed persons were more likely to be older, women, nonsmokers, and more frail, with a history of cancer, poorer cognition, and a lower creatinine clearance (Table 1). The mean 24-hour urinary cortisol level was not significantly different between nondepressed and depressed groups (99.4 versus 97.8 μg, t(879)=0.46, p=0.63).
TABLE 1. Baseline Characteristics.
| No Significant Depressive Symptoms | Significant Depressive Symptoms | χ2(df) or F(df) | p Value | |
|---|---|---|---|---|
| N | 608 | 273 | 5.4(879) | <0.001 |
| Age, years | 73.3 ± 6.4 | 75.9 ± 6.6 | 59.4(1) | <0.001 |
| Women | 46.1 | 74.0 | 0.2(879) | 0.82 |
| Body mass index | 27.5 ± 3.7 | 27.4 ± 4.3 | 34.1(2) | <0.001 |
| Smoking | ||||
| Former | 32.9 | 16.8 | ||
| Current | 16.0 | 11.4 | ||
| Diabetes (%) | 11.0 | 10.3 | 0.11(1) | 0.74 |
| Coronary heart disease (%) | 7.6 | 8.1 | 0.06(1) | 0.80 |
| Congestive heart failure (%) | 3.1 | 5.5 | 2.8(1) | 0.09 |
| Stroke (%) | 3.9 | 5.5 | 1.1(1) | 0.30 |
| Cancer (%) | 4.8 | 8.8 | 5.4(1) | 0.02 |
| Use of antidepressants (%) | 1.3 | 9.2 | 32.1(1) | <0.001 |
| Use of benzodiazepines (%) | 12.8 | 34.1 | 54.3(1) | <0.001 |
| Use of corticosteroids (%) | 1.3 | 2.9 | 2.8(1) | 0.10 |
| MMSE score | 25.7 ± 2.9 | 24.7 ± 3.2 | 4.5(879) | <0.001 |
| 24-hour creatinine clearance (mL/min) | 79.3 ± 25.2 | 70.5 ± 24.1 | 5.8(879) | <0.001 |
| Duration of urine collection, hours | 23.3 ± 1.2 | 23.4 ± 1.1 | 1.5(879) | 0.13 |
| Amount of 24-hour urine collected, mLs | 1535.2 ± 553.7 | 1475.4 ± 589.4 | 1.5(879) | 0.15 |
| 24-hour urinary cortisol, μg | 99.4 ± 41.8 | 97.8 ± 59.0 | 0.46(879) | 0.65 |
| Frailty indicators | ||||
| Low energy in past month | 38.2 | 72.2 | 87.2(1) | <0.001 |
| Low activity (<2 hours exercise/week) | 11.7 | 30.8 | 47.4(1) | <0.001 |
| Poor walking speed (lowest quintile) | 13.2 | 33.7 | 50.6(1) | <0.001 |
| Poor strength (lowest quintile) | 13.0 | 33.7 | 51.6(1) | <0.001 |
| Number of frailty indicators | 132.5(3) | <0.001 | ||
| Zero | 48.5 | 15.8 | ||
| One | 29.6 | 30.4 | ||
| Two | 14.8 | 23.4 | ||
| Three or more | 7.1 | 30.4 | ||
Notes: Data are means ± standard deviation or percents.
MMSE: Mini-Mental State Exam.
Association Between Cortisol and Depressive Symptoms
From Figure 1, it appears that the relationship between urinary cortisol deciles and depressive symptoms is not linear. Highest mean CES-D scores were observed for both elders in the lowest and highest urinary cortisol deciles, whereas other deciles did not differ much from each other. Linear regression analyses with depressive symptoms as the outcome variable yielded a nonsignificant standardized regression coefficient per microgram of urinary cortisol increase (β=0.046, t(879)=1.4, p=0.17),which confirms that there is no significant linear association. In contrast, when a nonlinear association was explored by additionally entering the squared term of urinary cortisol level (per microgram squared increase), the standardized regression coefficient for the squared term was significant (β=0.293, t(878)=6.7, p <0.001). Also after adjustment for covariates, the squared term of urinary cortisol level remained significantly associated with depressive symptoms (Table 2), which was consistent for both older men and women. Use of antidepressants and benzodiazepines was not significantly associated with urinary cortisol level (t(878)=0.86, p=0.39 and t(878)=1.5, p=0.13, respectively).
FIGURE 1. Depressive Symptoms (mean CES-D score) by 24-Hour Urinary Cortisol Level.
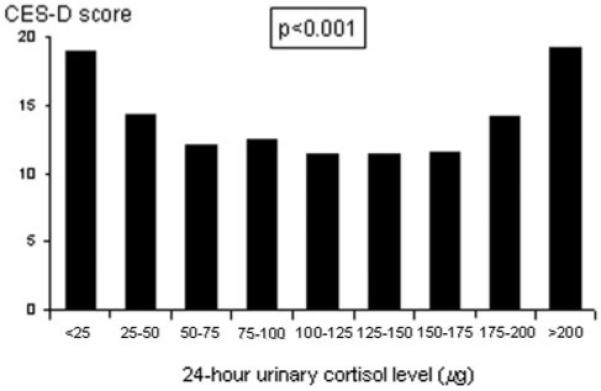
CES-D: Center for Epidemiologic Studies Depression Scale.
TABLE 2. Results of Linear Regression Analyses for the Association Between Depressive Symptoms (CES-D Score) and 24-Hour Urinary Cortisol Level.
| Adjusted CES-D Score |
|||
|---|---|---|---|
| β | t(df) | p value | |
| Total sample (N=881) | |||
| 24-hour urinary cortisol (per μg increase) | -0.013 | 0.29(863) | 0.77 |
| Squared term of 24-hour urinary cortisol (per μg2 increase) | 0.199 | 4.8(863) | <0.001 |
| Men (N=399) | |||
| 24-hour urinary cortisol (per μg increase) | -0.014 | 0.18(382) | 0.35 |
| Squared term of 24-hour urinary cortisol (per μg2 increase) | 0.138 | 1.9(382) | 0.05 |
| Women (N=482) | |||
| 24-hour urinary cortisol (per μg increase) | -0.013 | 0.22(465) | 0.83 |
| Squared term of 24-hour urinary cortisol (per μg2 increase) | 0.249 | 4.3(465) | <0.001 |
Notes: β is a standardized regression coefficient. CES-D score is adjusted for sex (in total sample only), age, smoking status, diabetes, coronary heart disease, congestive heart failure, stroke, cancer, antidepressant use, benzodiazepine use, corticosteroid use, Mini-Mental State Exam score, creatinine clearance, urine quantity. Linear and squared terms of urinary cortisol are both included in the adjusted model.
CES-D: Center for Epidemiologic Studies Depression Scale.
Subsequently, we conducted logistic regression analyses with the dichotomous indicator for clinically relevant depressive symptoms (CES-D ≥16) as the outcome. In line with results for continuous CES-D score, urinary cortisol level did not show a significant linear association with the dichotomous depressive symptoms indicator (per SD increase: odds ratio [OR]=1.15, Wald(864)=2.6, 95% confidence interval [CI]: 0.97-1.36; Table 3). However, when we additionally added the squared term for urinary cortisol, this variable was significantly associated with the odds of significant depressive symptoms (per SD increase: OR=1.22, Wald(863)=17.3, 95% CI: 1.11-1.34). When 24-hour urinary cortisol level was categorically divided into decile groups, elders in the second to ninth deciles showed similar odds of significant depressive symptoms. However, elders in the highest cortisol decile (≥158 μg) were more likely to have significant depressive symptoms (OR=1.92, Wald(863)=5.2, 95% CI: 1.13-3.28) compared to the second to ninth deciles (Table 3). Also elders in the lowest cortisol decile (<48 μg) were more likely to be depressed (OR=2.20, Wald(863)=9.5, 95% CI: 1.33-3.64).
TABLE 3. Adjusted Odds Ratios (95% CI) for Significant Depressive Symptoms (CES-D ≥16) According to 24-Hour Urinary Cortisol Levels.
| Depressed (%) | Adjusted Odds Ratio | 95% CI | Wald(df) Statistic | p Value | |
|---|---|---|---|---|---|
| 24-hour urinary cortisol (per SD increase)a | 31.0% | 1.15 | 0.97-1.36 | 2.6(864) | 0.11 |
| Squared term of 24-hour urinary cortisol (per SD increase)a | 31.0% | 1.22 | 1.11-1.34 | 17.3(863) | 0.001 |
| Urinary cortisol deciles | |||||
| First decile (<48 μg) | 52.8% | 2.20 | 1.33-3.64 | 9.5(863) | 0.002 |
| Second to ninth deciles (48-157 μg) | 27.4% | Ref | — | — | — |
| 10th decile (≥158 μg) | 37.6% | 1.92 | 1.13-3.28 | 5.2(863) | 0.01 |
Notes: Adjusted for age, sex, body mass index, smoking status, diabetes, coronary heart disease, congestive heart failure, stroke, cancer, antidepressant use, benzodiazepine use, corticosteroid use, Mini-Mental State Exam score, creatinine clearance, urine quantity. When examining the squared term of urinary cortisol, the linear term of urinary cortisol was also included in the model.
SD=47.8 μg for 24-hour urinary cortisol.
CI: confidence interval; CES-D: Center for Epidemiologic Studies Depression Scale; SD: standard deviation.
Comparing Depressed Elders With Low and High Cortisol Levels
Table 4 compares sociodemographic, depression, and physical frailty characteristics between depressed elders (CES-D ≥16) in the lowest cortisol decile (<48 μg, N=47), the second to ninth cortisol deciles (48-157 μg, N=194), and the highest cortisol decile (≥158 μg, N=32). Depressed persons in the highest cortisol decile reported significantly higher depressive symptoms than persons with lower cortisol levels. This was consistent across CES-D subscales, although only significant for somatic symptoms and negative affect. However, depressed persons in the lowest cortisol decile scored higher on frailty indicators than depressed persons in the highest cortisol decile. Depressed persons with cortisollevels in the middle deciles scored generally in between depressed persons in the extreme deciles. On the frailty measure, 42.6% of the depressed persons in the lowest cortisol decile had three or more frailty indicators, which was 25.0% of the depressed persons in the highest cortisol decile (χ2(3)=8.7, p=0.03).
TABLE 4. Depressed Persons with Lowest (<48 μg), Middle (48-157 μg), and Highest Deciles (≥158 μg) of 24-Hour Cortisol in Terms of Sociodemographics, Depressive Symptoms, and Frailty Indicators.
| Comparing All Three Groups |
Comparing Lowest Versus Highest Deciles |
||||||
|---|---|---|---|---|---|---|---|
| Lowest Decile | Second to Ninth Decile | Highest Decile | χ2(df) or t(df) | p Value | χ2(df) or t(df) | p Value | |
| N | 47 | 194 | 32 | ||||
| Age, years | 78.0 ± 7.1 | 75.2 ± 6.5 | 76.8 ± 6.2 | 3.7(270) | 0.03 | 0.75(77) | 0.46 |
| Women | 76.9% | 73.7% | 71.9% | 0.25(2) | 0.88 | 0.22(1) | 0.64 |
| CES-D overall score | 21.7 ± 6.2 | 27.2 ± 6.5 | 28.6 ± 5.0 | 7.5(270) | 0.001 | 3.6(77) | 0.001 |
| CES-D subscales | |||||||
| Somatic symptoms | 6.9 ± 3.3 | 6.7 ± 3.5 | 8.3 ± 3.6 | 2.9(270) | 0.05 | 1.8(77) | 0.08 |
| Negative affect | 7.3 ± 3.2 | 8.4 ± 3.4 | 10.6 ± 3.7 | 9.3(270) | <0.001 | 4.2(77) | <0.001 |
| Lack of positive affect | 6.9 ± 2.4 | 7.4 ± 2.7 | 7.7 ± 2.3 | 1.1(270) | 0.35 | 1.4(77) | 0.78 |
| Frailty indicators | |||||||
| Low energy in past month | 76.6% | 72.7% | 62.5% | 2.0(2) | 0.37 | 1.8(1) | 0.18 |
| Low activity (<2 hours exercise/week) | 40.4% | 28.9% | 28.1% | 2.5(2) | 0.29 | 1.3(1) | 0.26 |
| Walking speed, m/sec | 0.82 ± 0.28 | 0.97 ± 0.25 | 0.94 ± 0.29 | 5.6(259) | 0.005 | 1.8(74) | 0.08 |
| Poor walking speeda | 53.2% | 28.4% | 37.5% | 10.7(2) | 0.005 | 1.9(1) | 0.17 |
| Muscle strength, kg | 11.5 ± 3.3 | 14.1 ± 5.6 | 15.4 ± 6.1 | 5.5(248) | 0.004 | 3.5(69) | 0.001 |
| Poor strengtha | 44.7% | 32.0% | 28.1% | 3.2(2) | 0.20 | 2.2(1) | 0.14 |
| Number of frailty indicators | 16.3(6) | 0.01 | 8.7(3) | 0.03 | |||
| 0 | 6.4% | 16.5% | 28.1% | ||||
| 1 | 25.5% | 37.1% | 15.6% | ||||
| 2 | 25.5% | 22.7% | 31.5% | ||||
| 3+ | 42.6% | 23.7% | 25.0% | ||||
Notes: Data are means ± SD or percents. p values are based on χ2 tests for categorical variables and on analysis of variance (F statistics) for continuous variables.
Lowest quintile for walking speed is <0.85 m/sec, lowest quintile for muscle strength is <11.1 kg.
CES-D: Center for Epidemiologic Studies Depression Scale; SD: standard deviation.
DISCUSSION
Studies of the biological underpinnings of depression have often yielded conflicting results, likely due to the heterogeneity of depression. The association between depression and HPA axis functioning is an example since conflicting findings for this association have been described, which may be due to heterogeneity of depression. Our findings from a large cohort of older persons suggest the presence of a modest but significant nonlinear association between urinary cortisol levels and depressive symptoms. Older persons at both extremes of the cortisol spectrum reported higher depressive symptoms, suggesting that both hypoactivity as well as hyperactivity of the HPA axis may occur among depressed older persons. Hypocortisolemic depressed elders reported relatively lower depression severity but more physical frailty than depressed elders with high cortisol levels.
A nonlinear link between cortisol levels and depressive symptoms may explain conflicting evidence from previous research. Indeed, had we restricted our analyses to linear associations, no association between depressive symptoms and cortisol level would have been found. Our community-based subjects may have had less extreme cortisol levels compared to severely depressed patients, and depressed persons were less likely to participate in our study. Because of these characteristics it is possible that the association between depression and HPA axis dysregulation may be more pronounced in a more severely depressed sample.
The finding of a significant link between hyperactivity of the HPA axis and depressive symptoms is consistent with prior findings among young and old samples.1-5,20-23 Hyperactivity of the HPA axis could be caused by either a corticotrophin-releasing hormone overdrive, a strong adrenocorticotropic hormone response, or a blunted feedback control by glucocorticoid receptors among depressed persons.24 However, we cannot completely rule out that other primary illnesses, such as thyroid disease, could have partly increased cortisol levels as well as CES-D scores.
Our finding of HPA axis hypoactivity in a subgroup of older depressed participants is consistent with prior observations among small, older samples.9,10 Our study suggests that low cortisol levels are especially present among depressed persons with physical frailty. This finding may not per se point at a causal link: it could well be that depressive symptoms are just cooccurring because of their association with physical frailty. In addition, physical frailty could have chronically exhausted the HPA axis, which therefore could not sufficiently respond with a stress-related activation with resulting cortisol release. This is in line with other findings12,25 that hypocortisolemia is associated with symptoms such as chronic fatigue, physical complaints, and pain, and may occur after a prolonged period of hyperactivity of the HPA axis due to chronic (physical) stress. It should also be noted that depressed elders in our sample had poorer cognitive function than nondepressed elders, which may have contributed to depressive symptoms or frailty. Finally, other factors such as restricted activity and polypharmacy could be underlying factors that could lead to hypocortisolemia as well as depressive symptoms, and subsequently could be alternative mechanisms for the hypocortisolemia and depression link.
Our study has some weaknesses and strengths. First, from these cross-sectional data, one cannot draw causal inferences. Therefore, it remains unaddressed whether HPA axis dysregulation precedes or is a consequence of depressive symptoms. In fact, the mechanism is likely different at the two ends of the cortisol spectrum, with low cortisol (noncausally) accompanied with depression because of underlying frailty and high cortisol being a result of depression. Longitudinal data will be necessary to further explore temporality of our observed associations. Second, no psychiatric diagnosis of major depression was available in this study, so it remains unclear whether HPA axis dysregulation is more prominent among older persons with more severe depression. Finally, depressive symptom level was rather high in this Italian older cohort, which is not uncommon in Southern European countries and could be due to cultural but not clinical differences across nations. The major strength of our study is the use of a large, randomly selected cohort of older community-dwelling persons encompassing the full range of physical health.
Overall, our study is one of the first to clearly indicate that late-life depressive symptoms appear to be associated with both hypoactivity as well as hyperactivity of the HPA axis. A hypoactive state of the HPA axis among depressed older persons appears to be specifically associated with underlying physical frailty, and therefore may be rather specific for the older population. Future research is needed to confirm our findings and explore the underlying pathways that associate both hypoactivity and hyperactivity of the HPA axis with late-life depressive symptoms.
Acknowledgments
The InCHIANTI study was supported as a targeted project (ICS 110.1/RS97.71) by the Italian Ministry of Health and in part by the U.S. National Institute on Aging (263 MD 9164 13 and 263 MD 821336). Data analyses were supported through grant 1R01-HL972972 from the National Heart, Lung, and Blood Institute.
References
- 1.Gotthardt U, Schweiger U, Fahrenberg J, et al. Cortisol, ACTH, and cardiovascular response to a cognitive challenge paradigm in aging and depression. Am J Physiol. 1995;268:R865–R873. doi: 10.1152/ajpregu.1995.268.4.R865. [DOI] [PubMed] [Google Scholar]
- 2.Heuser IJ, Schweiger U, Gotthardt U, et al. Pituitary-adrenal-system regulation and psychopathology during amitriptyline treatment in elderly depressed patients and normal comparison subjects. Am J Psychiatry. 1996;153:93–99. doi: 10.1176/ajp.153.1.93. [DOI] [PubMed] [Google Scholar]
- 3.O’Brien JT, Ames D, Schweitzer I, et al. Clinical and magnetic resonance imaging correlates of hypothalamic-pituitary-adrenal axis function in depression and Alzheimer’s disease. Br J Psychiatry. 1996;168:679–687. doi: 10.1192/bjp.168.6.679. [DOI] [PubMed] [Google Scholar]
- 4.O’Brien JT, Lloyd A, McKeith I, et al. A longitudinal study of hippocampal volume, cortisol levels, and cognition in older depressed subjects. Am J Psychiatry. 2004;161:2081–2090. doi: 10.1176/appi.ajp.161.11.2081. [DOI] [PubMed] [Google Scholar]
- 5.Otte C, Marmar CR, Pipkin SS, et al. Depression and 24-hour urinary cortisol in medical outpatients with coronary heart disease: The Heart and Soul Study. Biol Psychiatry. 2004;56:241–247. doi: 10.1016/j.biopsych.2004.06.003. [DOI] [PMC free article] [PubMed] [Google Scholar]
- 6.Otte C, Hart S, Neylan TC, et al. A meta-analysis of cortisolresponse to challenge in human aging: importance of gender. Psychoneuroendocrinology. 2005;30:80–91. doi: 10.1016/j.psyneuen.2004.06.002. [DOI] [PubMed] [Google Scholar]
- 7.Penninx BW, Beekman AT, Honig A, et al. Depression and cardiac mortality: results from a community-based longitudinal study. Arch Gen Psychiatry. 2001;58:221–227. doi: 10.1001/archpsyc.58.3.221. [DOI] [PubMed] [Google Scholar]
- 8.Musselman DL, Evans DL, Nemeroff CB. The relationship of depression to cardiovascular disease: epidemiology, biology, and treatment. Arch Gen Psychiatry. 1998;55:580–592. doi: 10.1001/archpsyc.55.7.580. [DOI] [PubMed] [Google Scholar]
- 9.Morrison MF, Redei E, TenHave T, et al. Dehydroepiandrosterone sulfate and psychiatric measures in a frail, elderly residential care population. Biol Psychiatry. 2000;47:144–150. doi: 10.1016/s0006-3223(99)00099-2. [DOI] [PubMed] [Google Scholar]
- 10.Oldehinkel AJ, van dB, Flentge F, et al. Urinary free cortisol excretion in elderly persons with minor and major depression. Psychiatry Res. 2001;104:39–47. doi: 10.1016/s0165-1781(01)00300-6. [DOI] [PubMed] [Google Scholar]
- 11.Morrison MF, Ten Have T, Freeman EW, et al. DHEA-S levels and depressive symptoms in a cohort of African American and Caucasian women in the late reproductive years. Biol Psychiatry. 2001;50:705–711. doi: 10.1016/s0006-3223(01)01169-6. [DOI] [PubMed] [Google Scholar]
- 12.Fries E, Hesse J, Hellhammer J, Hellhammer DH. A new view on hypocortisolism. Psychoneuroendocrinology. 2005;30:1010–1016. doi: 10.1016/j.psyneuen.2005.04.006. [DOI] [PubMed] [Google Scholar]
- 13.Ferrucci L, Bandinelli S, Benvenuti E, et al. Subsystems contributing to the decline in ability to walk: bridging the gap between epidemiology and geriatric practice in the InCHIANTI study. J Am Geriatr Soc. 2000;48:1618–1625. doi: 10.1111/j.1532-5415.2000.tb03873.x. [DOI] [PubMed] [Google Scholar]
- 14.Yehuda R, Halligan SL, Yang RK, et al. Relationship between 24-hour urinary-free cortisol excretion and salivary cortisol levels sampled from awakening to bedtime in healthy subjects. Life Sci. 2003;73:349–358. doi: 10.1016/s0024-3205(03)00286-8. [DOI] [PubMed] [Google Scholar]
- 15.Radloff LS. The CES-D scale: a self-report depression scale for reseach in the general population. Appl Psychol Meas. 1977;1:385–401. [Google Scholar]
- 16.Beekman AT, Deeg DJ, Van Limbeek J, et al. Criterion validity of the Center for Epidemiologic Studies Depression scale (CES-D): results from a community-based sample of older subjects in the Netherlands. Psychol Med. 1997;27:231–235. doi: 10.1017/s0033291796003510. [DOI] [PubMed] [Google Scholar]
- 17.Blank K, Gruman C, Robison JT. Case-finding for depression in elderly people: balancing ease of administration with validity in varied treatment settings. J Gerontol A Biol Sci Med Sci. 2004;59:M378–M84. doi: 10.1093/gerona/59.4.m378. [DOI] [PubMed] [Google Scholar]
- 18.Fried LP, Tangen CM, Walston J, et al. Frailty in older adults: evidence for a phenotype. J Gerontol A Biol Sci Med Sci. 2001;56:M146–M156. doi: 10.1093/gerona/56.3.m146. [DOI] [PubMed] [Google Scholar]
- 19.Guralnik JM, Winograd CH. Physical performance measures in the assessment of older persons. Aging (Milano) 1994;6:303–305. doi: 10.1007/BF03324256. [DOI] [PubMed] [Google Scholar]
- 20.Tsigos C, Chrousos GP. Hypothalamic-pituitary-adrenal axis, neuroendocrine factors and stress. J Psychosom Res. 2002;53:865–871. doi: 10.1016/s0022-3999(02)00429-4. [DOI] [PubMed] [Google Scholar]
- 21.Linkowski P, Mendlewicz J, Leclercq R, et al. The 24-hour profile of adrenocorticotropin and cortisol in major depressive illness. J Clin Endocrinol Metab. 1985;61:429–438. doi: 10.1210/jcem-61-3-429. [DOI] [PubMed] [Google Scholar]
- 22.Maes M, Lin A, Bonaccorso S, et al. Increased 24-hour urinary cortisol excretion in patients with post-traumatic stress disorder and patients with major depression, but not in patients with fibromyalgia. Acta Psychiatr Scand. 1998;98:328–335. doi: 10.1111/j.1600-0447.1998.tb10092.x. [DOI] [PubMed] [Google Scholar]
- 23.Deuschle M, Schweiger U, Weber B, et al. Diurnal activity and pulsatility of the hypothalamus-pituitary-adrenal system in male depressed patients and healthy controls. J Clin Endocrinol Metab. 1997;82:234–238. doi: 10.1210/jcem.82.1.3689. [DOI] [PubMed] [Google Scholar]
- 24.Pasquali R, Vicennati V. Activity of the hypothalamic-pituitary-adrenal axis in different obesity phenotypes. Int J Obes Relat Metab Disord. 2000;24(Suppl 2):S47–S49. [PubMed] [Google Scholar]
- 25.Hellhammer J, Schlotz W, Stone AA, et al. Allostatic load, perceived stress, and health: a prospective study in two age groups. Ann N Y Acad Sci. 2004;1032:8–13. doi: 10.1196/annals.1314.002. [DOI] [PubMed] [Google Scholar]