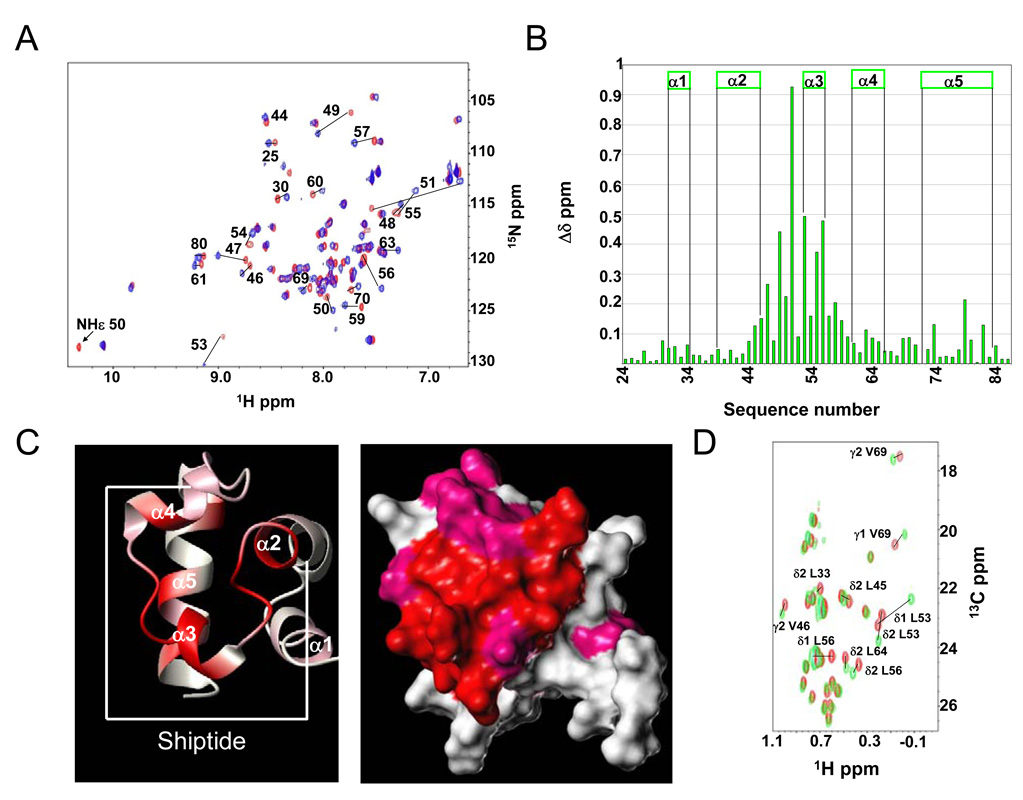
Figure 3.
A. Comparison of [1H, 15N]-HSQC spectra of Ship2-Sam (100 µM) in its apo form (red) and after addition of EphA2-Sam (400 µM) (blue). B. Histogram showing normalized chemical shift deviations (Δδ=[(ΔHN)2 + (0.17 * Δ15N)2]1/2) as function of the residue number. Residues L45, V46, H47, G49, W50, D51, L53, E54, F55, L56, S57, D58, I59, D63, H74, L79, L82 present normalized deviations with values higher that 0.1 ppm. Δδ values in between 0.05 and 0.1 ppm are observed for the following residues: S30, A31, W32, R34, G44, N48, D52, T60, E61, L64, E65, E66, A67, V69, Q70, D71, D80. C. Residues with normalized chemical shifts deviations (Δδ values) greater than 0.1 ppm and included in between 0.05 and 0.1 are colored in red and pink respectively on the 3D solution structure of Ship2-Sam (conformer number 1) in its ribbon (left panel) and surface (right panel) representations. The peptide region used for our studies is highlighted in the left panel. D. [1H, 13C]-HSQC spectra of selective Leu-13CH3δ1,2/Val-13CH3γ1,2 labeled Ship2-Sam (50 µM) in absence (red) and presence (green) of EphA2-Sam (150 µM).

