

Abstract
The role of uric acid (UA) in the process of atherothrombosis is controversial. Although serum UA has powerful antioxidant properties, epidemiological studies showed that UA was a risk factor for cardiovascular diseases and was positively associated with proinflammatory markers. Relations between baseline UA and changes in UA circulating levels with C-reactive protein (CRP) and interleukin-6 (IL-6) after 3 years of follow-up in a cohort of 892 Italian men and women aged 21 to 98 years was investigated. Subjects had complete baseline and follow-up data for UA, inflammatory markers, and covariates. An autoregressive approach was used to study such a relation. In adjusted analyses, baseline UA and changes in UA predicted a 3-year change in CRP (p = 0.028), but not IL-6 (p = 0.101). The relation between UA and CRP persisted after adjustment for baseline IL-6. Subjects with high UA at baseline had a progressively higher probability of developing clinically relevant increased IL-6 (>2.5 pg/ml) and CRP (>3 mg/L) during 3 years. In conclusion, our study suggests that in a population-based cohort, baseline UA and changes in circulating UA during 3 years of follow-up predict changes in circulating CRP independent of relevant confounders, including baseline IL-6.
Increased serum uric acid (UA) was closely associated with systemic inflammation,1 increased C-reactive protein (CRP),2 endothelial dysfunction,3,4 hypertension,5 and cardiovascular disease (CVD).6 Especially in women,7,8 older persons,9,10 and subjects with preexisting CVDs11 or at high cardiovascular risk,12 hyperuricemia was considered a risk factor for mortality. Experimental studies showed that UA increased after cell injury or death and, when released from dying cells, stimulated an inflammatory response by activating the maturation of dendritic cells and priming of CD8+ T-cell responses.13 Despite this evidence, few studies examined the relation between UA and proinflammatory markers. We previously reported a strong positive cross-sectional association between UA and proinflammatory markers in both hyperuricemic and normouricemic older persons.14 Whether circulating UA and changes in UA are associated with longitudinal changes in inflammatory markers is unknown. The purpose of this study was to evaluate whether baseline UA and changes in UA predict changes in interleukin-6 (IL-6) and CRP during 3 years of follow-up in a population-based sample of adults and older persons.
Methods
The Invecchiare in Chianti; aging in the Chianti area (InCHIANTI) Study was an epidemiological study conducted on a representative sample of the population living in 2 Italian towns located in the Tuscany region of Italy. The study was developed to investigate factors affecting mobility in late life. The rationale, design, and data collection are described elsewhere.15 The study protocol complied with the Declaration of Helsinki and was approved by the Ethical Committee of the Italian National Institute of Research and Care of Aging.
Briefly, in August 1998, a total of 1,270 persons aged ≥65 years and 30 men and women in each decade of age between 20 and 60 and in the age group 61 to 64 were randomly selected from the population registry. Of 1,530 persons originally sampled, 1,453 (94%) agreed to participate in the study. Of these, 1,343 agreed to donate a blood sample and 1,325 (86% of those originally sampled eligible) completed the baseline data collection, which started in September 1998 and ended in March 2000.
Follow-up data were collected from 2001 to 2002. Of 1,453 subjects at baseline, 142 (9.8%) were lost because of death, 127 (8.7%) refused, and an additional 17 (1.6%) were lost to follow-up or did not provide sufficient serum at follow-up for assay of inflammatory markers. Complete blood samples at follow-up were available for 1,167 subjects. Missing subjects were more likely to be >85 years, be women, have diabetes, and have higher UA, IL-6, and CRP on initial evaluation.
The analysis presented here included 961 subjects with complete data for UA and inflammatory markers at baseline and follow-up. Because of the potential for confounding, exclusions were made for subjects with a diagnosis of cancer (47 subjects), stage ≥4 kidney disease estimated using creatinine-based glomerular filtration rate (estimated glomerular filtration rate <30 ml/min/1.73 m2), and those using allopurinol and an UA-lowering medication (20 subjects). The final study population included 892 subjects (404 men, 488 women).
Blood samples were collected after overnight fasting and after sitting for 15 minutes. Aliquotted sera were frozen and stored at -80°C until enzyme-linked immunosorbent assays (ELISAs) were performed. A detailed description of the sampling procedure and data collection method was previously published.15
At baseline and follow-up, UA (in milligrams per deciliter) was measured using enzymatic colorimetric methods (Roche Diagnostics GmbH, Mannheim, Germany). The lower limit of detection was 0.2 mg/dl (range 0.2 to 25.0), and intra- and interassay coefficients of variation were 0.5% and 1.7%, respectively. For statistical analysis, UA was divided into quintiles according to baseline cut-off points of 4.0, 4.7, 5.3, and 6.1 mg/dl.
Baseline IL-6 assays were performed using an ELISA with ultrasensitive commercial kits (Human Ultrasensitive, Biosource International Inc., Camarillo, California). Minimum detectable IL-6 was 0.10 pg/ml, and interassay coefficient of variation was 7%. The average of 2 measurements was used in analyses. Follow-up IL-6 assays were performed at the University of Vermont Laboratory for Clinical Biochemistry Research (R&D Systems, Inc., Minneapolis, Minnesota). A subset of baseline blood samples (n = 75) were reanalyzed using the follow-up assay. The 2 assays correlated at 0.89, and remaining baseline values were transformed to maximize comparability between the 2 assays. For analytical purposes, IL-6 was coded into clinical risk categories based on available research showing increased risk of disability for subjects with IL-6 ≥2.5 pg/ml.16
Serum CRP was measured in duplicate using a high-sensitivity ELISA with purified protein and polyclonal anti-CRP antibodies (Calbiochem, San Diego, California) with standardization according to the World Health Organization First International Reference Standard. Minimum detectable threshold was 0.03 mg/L, and interassay coefficient of variation was 5%. According to American Heart Association recommendations, CRP >3-mg/L threshold were coded into categories at risk of cardiovascular events.17
Using categories of risk for both IL-6 and CRP, subjects were grouped according to changes from baseline to follow-up. Subjects with IL-6 ≤2.5 pg/L and CRP ≤3 mg/dl at both baseline and follow-up, those with IL-6 >2.5 pg/L at baseline and ≤2.5 pg/L at follow-up, and those with CRP >3 mg/dl at baseline and ≤3 mg/dl at follow-up were grouped under the definition of “persistent low or remittent inflammation.” Subjects with IL-6 ≤2.5 pg/L at baseline and >2.5 pg/L at follow-up and those with CRP ≤3 mg/dl at baseline and >3 mg/dl at follow-up were classified under “increasing inflammation.” Finally, subjects with IL-6 >2.5 pg/L and CRP >3 mg/dl at both baseline and follow-up were considered under “persistent high inflammation.”
Demographic information and information for smoking and medication use were collected using standardized questionnaires. Pack-years, a measure of cigarette smoking exposure that combines intensity and duration, was calculated as (packs smoked per day) × (years of smoking), based on self-report.
Average energy intake (kilocalories per day), average intake of fruit and vegetables (grams per day), alcohol intake (grams per day), and animal protein intake (grams per day) were obtained by interviewers using the European Prospective Investigation into Cancer and Nutrition food-frequency questionnaire. Information provided using the questionnaire was transformed into average daily intake of macro- and micronutrients using custom software that uses as a reference the table of food composition for Italian epidemiological studies, edited by the European Institute of Oncology.18
Physical activity in the previous year was assessed based on responses to multiple questions and rated as (1) sedentary: inactive or light-intensity physical activity (i.e., walking, light housework) ≤1 hour/week; (2) light physical activity: light-intensity physical activity 2 to 4 hours/week; and (3) moderate-high physical activity: light physical activity >4 hours/week or moderate physical activity (i.e., brisk walking, playing soccer, gardening) ≥1 to 2 hours/week. Liver function was evaluated using glutamic oxaloacetic transaminase and glutamic pyruvic transaminase. Kidney function was estimated using creatinine-based glomerular filtration rate with the simplified Modification of Diet in Renal Disease equation.19
All subjects were examined by a physician to ascertain preestablished criteria and health status. Standard algorithms that combined information from physician diagnosis, medical and drug records, and clinical and laboratory findings were used to ascertain hypertension, peripheral atherosclerosis, diabetes, stroke, and heart and lung diseases.20 Metabolic syndrome was defined according to criteria from the National Cholesterol Education Program Adult Treatment Panel III.21 Peripheral atherosclerosis was defined as bilateral carotid atherosclerotic plaques and/or any carotid stenosis >40% and/or presence of peripheral arterial disease. Peripheral artery disease was defined as ankle-brachial index <0.90.22 Carotid atherosclerotic plaques and stenosis were estimated using Doppler flow ultrasonography.
Subjects’ characteristics were described for the entire sample and groups according to changes in IL-6 and CRP between baseline and follow-up. Variables with symmetric distribution were reported as mean ± SD. Variables with asymmetric distribution were summarized as median and interquartile range and log-transformed in regression analyses and back-transformed for data presentation. Statistical comparisons across groups were performed using age- and gender-adjusted analyses of covariance and logistic regression models, as appropriate. Tests for trend across UA quintiles were conducted using age- and gender-adjusted linear regression models for means and a Mantel-Haenszelchi-square test for proportions. The significance level used for 2-sided tests was p <0.05.
The relation between UA and inflammatory markers was explored using scatterplots and by looking at average inflammatory marker values according to UA quintiles. The assumption of constant variance of inflammatory markers across UA levels was explored using residual plots. After exploring relations between IL-6 and CRP at baseline and IL-6 and CRP at follow-up between subjects with UA less than and greater than the mean value, we studied relations between baseline and change in UA and follow-up inflammatory parameters using an autoregressive approach.23 According to the autoregressive model, changes in IL-6 and CRP were regressed on baseline UA levels adjusting for baseline proinflammatory markers and other potential confounders.
The likelihood of having inflammatory parameters considered at clinical risk levels at follow-up was estimated using logistic regression adjusted for age, gender, and baseline proinflammatory levels. All analyses were performed using the SAS statistical package, version 8.2 (SAS Institute, Cary, North Carolina).
Results
Baseline characteristics of study subjects for the entire sample and stratified by category of change in IL-6 and CRP between baseline and follow-up are listed in Table 1. Most associations were similar regardless of whether categories were defined based on IL-6 or CRP. Compared with subjects with persistently low or remitted inflammation (follow-up IL-6 ≤2.5 pg/ml or CRP ≤3 mg/L regardless of baseline values), those with increased inflammation (IL-6 baseline ≤2.5 pg/ml and follow-up >2.5; CRP baseline ≤3 mg/L and follow-up >3) and especially persistently high inflammation (IL-6 >2.5 pg/ml and CRP >3 mg/L at both baseline and follow-up) were significantly older, had a higher UA and body mass index, were less physically active, and had a higher prevalence of clinically apparent CVD and risk factors for CVD (i.e., diabetes and hypertension).
Table 1.
Demographic and health-related characteristics of the study population and according to changes in interleukin-6 (IL-6) and C-reactive protein (CRP) from baseline to follow-up
| IL-6 From Baseline to Follow-Up |
CRP From Baseline to Follow-Up |
||||||
|---|---|---|---|---|---|---|---|
| Variables | Entire Sample (n = 892) | Persistently Low or Remittent* (n = 524) | Increased† (n = 107) | Persistently High‡ (n = 261) | Persistently Low or Remittent* (n = 596) | Increased† (n = 90) | Persistently High‡ (n = 206) |
| Women | 488 (54.7%) | 301 (57.4%) | 62 (57.9%) | 125 (47.9%) | 306 (51.3%) | 54 (60.0%) | 128 (62.4%) |
| Age (yrs) | 66.0 ± 15.6 | 61.2 ± 16.4 | 70.2 ± 12.8 | 73.9 ± 10.6§ | 64.3 ± 16.4 | 68.2 ± 15.2 | 70.0 ± 12.5§ |
| UA (mg/dl) | 4.9 ± 1.3 | 4.8 ± 1.1 | 4.9 ± 1.4 | 5.4 ± 1.4∥ | 4.8 ± 1.2 | 4.9 ± 1.4 | 5.2 ± 1.4§ |
| Glomerular filtration rate (ml/min/1.73 m2) | 80.7 ± 17.2 | 82.7 ± 17.2 | 76.5 ± 15.4 | 78.4 ± 17.4 | 82.0 ± 17.1 | 79.4 ± 16.9 | 77.5 ± 17.4 |
| CRP (μg/ml) | 2.14 (3.5) | 1.5 (2.4) | 1.9 (3.2) | 4.0 (5.8)§ | 1.4 (2.0) | 1.8 (1.2) | 5.8 (5.9)§ |
| IL-6 (pg/ml) | 2.42 (1.8) | 2.0 (1.2) | 1.8 (0.7) | 3.9 (2.3)§ | 2.2 (1.7) | 2.1 (1.5) | 3.3 (2.7)§ |
| Body mass index (kg/m2) | 27.0 ± 4.0 | 26.6 ± 3.8 | 27.4 ± 3.9 | 27.7 ± 4.4∥ | 26.5 ± 3.6 | 26.6 ± 4.4 | 28.7 ± 4.6§ |
| Energy intake (kcal/d) | 2061 ± 623 | 2124 ± 636 | 2047 ± 616 | 1939 ± 582 | 2108 ± 640 | 1966 ± 589 | 1964 ± 572 |
| Protein intake (g/d) | 79.9 ± 22.7 | 81.4 ± 22.8 | 80.9 ± 23.1 | 76.4 ± 22.1 | 80.7 ± 22.7 | 79.8 ± 23.0 | 77.5 ± 22.5 |
| Alcohol intake (g/d) | 7.8 (26.5) | 7.6 (26.7) | 9.1 (25.9) | 7.8 (25.5) | 8.0 (26.6) | 7.6 (14.9) | 7.6 (19.5) |
| Smoking (packs/yr) | 0.0 (16.2) | 0.0 (13.4) | 0.0 (15.1) | 0.0 (24.0) | 0.0 (16.8) | 0.0 (10.9) | 0.0 (19.0) |
| Physical activity (h/wk) | 3.1 ± 0.8 | 3.3 ± 0.7 | 3.0 ± 0.8 | 2.7 ± 0.9§ | 3.2 ± 0.8 | 3.0 ± 0.9 | 2.8 ± 0.8∥ |
| Hypertension | 505 (56.6%) | 257 (49.0%) | 62 (58.0%) | 186 (71.3%)∥ | 319 (53.5%) | 50 (55.5%) | 136 (66.2%) |
| CVDs | 168 (18.8%) | 72 (13.7%) | 21 (19.6%) | 75 (28.7%)∥ | 95 (16.0%) | 25 (27.8%) | 48 (23.3%) |
| Cerebrovascular diseases | 42 (4.7%) | 10 (1.9%) | 6 (5.7%) | 26 (10.1%)∥ | 21 (3.6%) | 2 (2.2%) | 19 (9.4%)∥ |
| Diabetes mellitus | 140 (15.7%) | 71 (13.5%) | 17 (15.9%) | 52 (20.0%)∥ | 83 (14.0%) | 20 (22.2%) | 37 (17.9%)∥ |
| Metabolic syndrome | 170 (19.1%) | 79 (15.1%) | 20 (18.7%) | 71 (27.2%)∥ | 96 (16.1%) | 16 (17.8%) | 58 (28.2%)∥ |
| Atherosclerosis | 113 (13.8%) | 34 (6.9%) | 21 (21.2%) | 58 (25.5%)∥ | 61 (10.9%) | 18 (22.5%) | 34 (18.6%) |
| Knee and hip arthritis | 63 (7.1%) | 29 (5.5%) | 6 (5.6%) | 28 (10.7%) | 32 (5.4%) | 10 (11.1%) | 21 (10.2%) |
| Use of diuretics | 47 (5.3%) | 16 (3.0%) | 5 (4.7%) | 26 (10.0%)∥ | 26 (4.4%) | 4 (4.4%) | 17 (8.2%)∥ |
Values expressed as number (percent), mean ± SD, or median (interquartile range).
Persistently low or remittent: follow-up IL-6 ≤2.5 pg/mL or follow-up CRP ≤3 mg/L regardless of baseline values.
Increased for IL-6, baseline ≤2.5 pg/ml and follow-up >2.5; for CRP baseline ≤3 mg/L and follow-up >3.
Persistently high: IL-6 >2.5 pg/ml and CRP >3 mg/L at both baseline and follow-up. Statistical comparisons are from age- and gender-adjusted analysis of covariance and age- and gender-adjusted logistic regression, as appropriate.
p <0.0001.
p <0.005.
Cross-sectional evaluations of baseline and follow-up data showed that circulating UA, IL-6, and CRP significantly correlated with age. In all subjects, UA increased significantly from baseline to follow-up (0.27 ± 0.86 mg/dl; p <0.0001), whereas IL-6 (p = 0.0501) and CRP (p = 0.1027) did not change significantly. At both baseline and follow-up, IL-6 (p = 0.0428), CRP (p ≤0.0001), and percentage of subjects with IL-6 >2.5 pg/ml (p <0.0001) andCRP >3 mg/L (p <0.0001) increased significantly across UA quintiles (Table 2).
Table 2.
Distribution of lnCHIANTI subjects with abnormally high interleukin-6 (IL-6) and C-reactin protein (CRP) across uric acid (UA) quintiles at baseline and follow-up
| UA (quintiles) |
||||||
|---|---|---|---|---|---|---|
| 1 (n = 201) | 2 (n = 178) | 3 (n = 160) | 4 (n = 175) | 5 (n = 178) | p Value* | |
| UA range (mg/dl) | 1.9-3.9 | 4.0-4.6 | 4.7-5.1 | 5.2-5.9 | 5.9-10.9 | |
| Baseline | ||||||
| IL-6 (pg/ml) | 2.8 ± 2.3 | 2.9 ± 2.3 | 3.4 ± 2.4 | 3.7 ± 6.0 | 3.6 ± 2.6 | 0.0428 |
| CRP (μg/ml) | 3.3 ± 6.0 | 3.9 ± 9.0 | 4.1 ± 5.8 | 4.4 ± 6.3 | 4.9 ± 7.0 | 0.0016 |
| IL-6 >2.5 pg/ml | 73 (36%) | 72 (40%) | 85 (53%) | 96 (55%) | 103 (58%) | <0.0001 |
| CRP >3 μg/ml | 57 (28%) | 56 (31%) | 64 (40%) | 77 (44%) | 92 (52%) | <0.0001 |
| Follow-up | ||||||
| IL-6 (pg/ml) | 2.7 ± 2.4 | 2.6 ± 2.2 | 3.1 ± 2.6 | 3.5 ± 2.8 | 3.4 ± 2.9 | <0.0001 |
| CRP (μg/ml) | 2.8 ± 3.9 | 2.9 ± 3.8 | 3.5 ± 4.9 | 4.2 ± 7.4 | 5.2 ± 11.8 | <0.0001 |
| IL-6 >2.5 pg/ml | 73 (36%) | 53 (30%) | 63 (40%) | 83 (47%) | 96 (54%) | <0.0001 |
| CRP >3 μg/ml | 58 (29%) | 53 (30%) | 49 (31%) | 68 (39%) | 68 (38%) | 0.0118 |
Values expressed as mean ± SD or number (percent).
Statistical comparisons among means are from an age- and gender-adjusted linear regression model, those among proportions are from Mantel-Haenszel chi-square tests.
Independent of age and gender, subjects with IL-6 >2.5 pg/ml and CRP >3 mg/L at baseline had a higher average increase in IL-6 (2.6 ± 0.6 pg/ml; p <0.0001) and CRP (4.10 ± 0.47 mg/L; p <0.0001) at follow-up compared with those who started with IL-6 ≤2.5 pg/ml and CRP ≤3 mg/L. From baseline to follow-up, subjects with UA greater than the median tended to develop higher IL-6 and CRP compared with those with UA less than the median. This trend maintained almost the same direction across baseline IL-6 and CRP quintiles (Figure 1).
Figure 1.
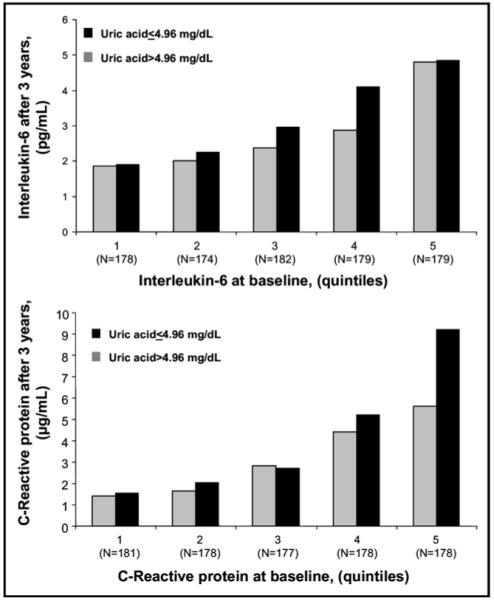
Mean IL-6 and CRP at the end of the 3-year observation period according to UA across IL-6 and CRP baseline quintile distribution.
Independent of IL-6 and CRP baseline values, higher baseline UA was significantly associated with higher follow-up IL-6 and CRP independent of age and gender (Table 3, model 1a). Adjusting for body mass index, glomerular filtration rate, glutamine oxaloacetic transaminase, glutamic pyruvic transaminase, total energy and protein intake, alcohol consumption, smoking, and physical activity, the association between baseline UA and changes in IL-6 was weakened and only approached statistical significance (Table 3, model 2a). After adjustment for clinical conditions, the association became completely nonsignificant (Table 3, model 3a). In adjusted analysis, baseline UA was significantly associated with CRP at follow-up (Table 3, model 2a) and the association remained statistically significant after adjustment for confounders, including clinical conditions (Table 3, model 3a). In this model, older age, body mass index, and baseline proinflammatory parameters were positive and independent predictors of IL-6 and CRP at follow-up.
Table 3.
Multiple linear regression model relating uric acid (UA) at baseline and UA changes with interleukin-6 (IL-6) and C-reactive protein (CRP) after 3 years of follow-up
| Model | IL-6 After 3 yrs log (pg/ml)* |
CRP After 3 yrs log (μg/ml)* |
|||
|---|---|---|---|---|---|
| β ± SE | p Value | β ± SE | p Value | ||
| 1a | UA (mg/dl) | 0.05 ± 0.01 | 0.0016 | 0.14 ± 0.02 | <0.0001 |
| 2a | UA (mg/dl) | 0.03 ± 0.01 | 0.0629 | 0.08 ± 0.03 | 0.0035 |
| 3a | UA (mg/dL) | 0.02 ± 0.01 | 0.3051 | 0.09 ± 0.03 | 0.0042 |
| 1b | UA (mg/dl) + | 0.06 ± 0.01 | 0.0006 | 0.16 ± 0.03 | <0.0001 |
| Change in UA (mg/dl) | 0.03 ± 0.02 | 0.1334 | 0.14 ± 0.04 | 0.0002 | |
| 2b | UA (mg/dl) + | 0.04 ± 0.02 | 0.0259 | 0.11 ± 0.03 | 0.0002 |
| Change in UA (mg/dl) | 0.03 ± 0.02 | 0.1323 | 0.12 ± 0.04 | 0.0033 | |
| 3b | UA (mg/dl) + | 0.02 ± 0.02 | 0.1399 | 0.11 ± 0.03 | 0.0007 |
| Change in UA (mg/dl) | 0.04 ± 0.02 | 0.1019 | 0.09 ± 0.04 | 0.0284 | |
IL-6 and CRP values were log-transformed for the analysis.
Model 1a adjusted for age, gender, and baseline IL-6 or CRP, model 2a adjusted for all variables in model 1 and body mass index, glutamic oxaloacetic transaminase, glutamic pyruvic transaminase, total energy intake, alcohol intake, smoking, physical activity, and glomerular filtration rate; model 3a adjusted for all variables in model 2 and CVDs, cerebrovascular diseases, metabolic syndrome, and atherosclerosis; and models 1b, 2b, and 3b adjusted for the same covariates of the respective “a” models and include change in UA among independent variables. Change in UA is the difference between UA at follow-up and baseline.
Similarly independent of confounders, changes in UA between baseline and follow-up were not independent predictors of change over time in IL-6 (Table 3, models 1b, 2b, and 3b), whereas they were significant predictor of changes over time in CRP. Interestingly, the association of baseline UA and UA changes with change over time in CRP, reported in model 3b, remained significant also after adjustment for baseline IL-6 (p = 0.0005 and p = 0.0160, respectively).
The likelihood of having abnormally high IL-6 and CRP levels after 3 years of follow-up was nonlinear across baseline UA quintiles. Independent of age, gender, body mass index, and baseline IL-6, odds ratios (ORs) for IL-6 >2.5 pg/ml were 1.83 (95% confidence interval [CI] 1.11 to 3.05) in the first, 1.22 (95% CI 0.72 to 2.07) in the third, 1.57 (95% CI 0.95 to 2.63) in the fourth, and 2.15 (95% CI 1.27 to 3.65) in the fifth UA quintile compared with the second UA quintile (Figure 2). The likelihood of having CRP greater than the threshold for clinical risk was higher, although not significant, in the fourth (OR 1.36, 95% CI 0.82 to 2.26), and fifth UA quintiles (OR 1.27, 95% CI 0.75 to 2.14) compared with the second UA quintile. Subjects in the first UA quintile (OR 1.00, 95% CI 0.61 to 1.65), and those in the third quintile (OR 0.94, 95% CI 0.56 to 1.59) had no higher probability to develop CRP at clinical risk at 3 years of follow-up compared with subjects in the second UA quintile (Figure 2). Both trends persisted after adjustments for behavioral and clinical confounders (data not shown).
Figure 2.
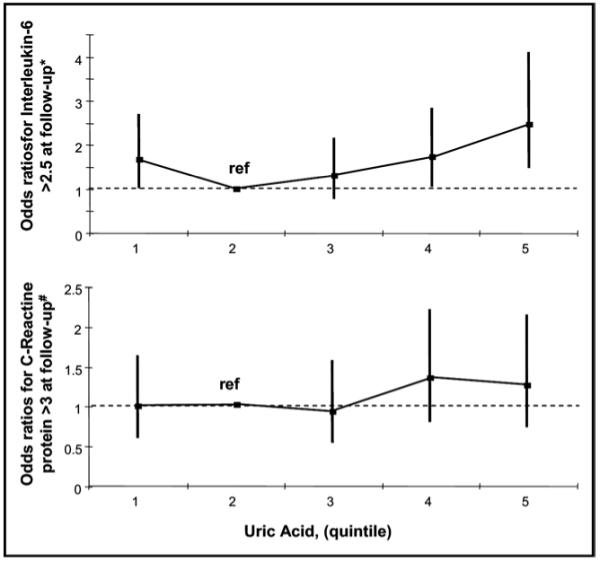
ORs to develop abnormally high IL-6 and CRP after 3 years of follow-up across UA quintiles. *ORs adjusted for age, gender, body mass index, and IL-6 or CRP at baseline.
Testing for the opposite hypothesis, that inflammatory markers predict UA levels, we found that baseline CRP and IL-6 and their changes during 3 years did not predict changes in UA during follow-up (data not shown).
Discussion
Using data collected in the context of an epidemiological study performed in a population-based sample, we evaluated whether UA circulating levels predict IL-6 and CRP circulating levels during 3 years of follow-up. Independent of baseline inflammatory markers and relevant confounders, baseline UA and changes in UA from baseline to follow-up were significant predictors of CRP changes during a 3-year follow-up. Baseline UA and changes in UA from baseline to follow-up were also independent predictors of IL-6 at follow-up, although the statistical significance of the association was lost after adjustment for clinical conditions. However, subjects in the fourth and fifth UA quintiles had a higher probability to develop clinically relevant increased IL-6 (>2.5 pg/ml) and CRP (>3 mg/L) during 3 years compared with those in the second quintile.
Increased UA frequently was described as a correlate of the development and progression of hypertension,24 diabetes,25 CVD, and mortality.12,26 In patients with hypertension,12 diabetes,27 preexisting cerebrovascular disease,28 and CVD,11 UA was a risk factor for further cardiovascular events, and in patients with mild-severe heart failure, was a negative prognostic factor for mortality.29 However, there were several controversies about the nature of the relation between UA and cardiovascular events. Because of the large number of risk factors involved in CVD and their close relation to UA, it was exceedingly difficult to prove or exclude an independent role, although this did not exclude the possibility that UA had a causal role in the development of CVD.
In keeping with some recent reports,30 our findings suggested that high UA from increasing CRP and inflammation anywhere in the body may contribute to the atherosclerotic process. The relation between UA and IL-6 remained somewhat unclear. The finding that baseline UA did not remain significantly associated with IL-6 after 3 years of follow-up and baseline IL-6 was not significantly associated with follow-up UA was unexpected. However, only subjects in the fourth and fifth UA quintiles had a higher probability of developing IL-6 >2.5 pg/ml, which suggested that the effect of UA on IL-6 was relevant only at greater than a critical UA threshold. As a possible alternative, we cannot exclude that our findings may simply relate to the more precise and reliable current methods for measuring CRP than those for IL-6. Overall, the reciprocal relation between IL-6 and CRP and their role in different inflammatory conditions should be further investigated.
Strengths of this study were that (1) the InCHIANTI Study was particularly suited to address the relation between UA and inflammatory markers because both measurements were systematically obtained at baseline and follow-up in all subjects, together with information about major confounders such as hypertension, use of diuretics, and alcohol and dietary intake; (2) all samples were tested for UA and inflammatory markers using state-of-the art clinically relevant assays; (3) relations between UA and inflammatory markers were tested in parallel against the most widely accepted inflammatory markers associated with CVD risk, such as IL-6 and CRP; (4) the opposite hypothesis that proinflammatory markers predicted changes in UA levels was tested and excluded; and (5) findings of these studies were unique among population-based studies and consistent with experimental evidence previously reported.
Acknowledgments
The InCHIANTI Study was supported as a “targeted project” (ICS 110.1/RS97.71) by the Italian Ministry of Health, Rome, Italy; Contracts No. N01-AG-916413 and N01-AG-821336 from the US National Institute on Aging, Bethesda, Maryland; and Contracts No. 263 MD 9164 13 and 263 MD 821336 from the Intramural Research Program of the US National Institute on Aging, Bethesda, Maryland. None of the sponsoring institutions interfered with the collection, analysis, presentation, or interpretation of the data reported here.
References
- 1.Anker SD, Doehner W, Rauchhaus M, Sharma R, Francis D, Knosalla C, Davos CH, Cicoira M, Shamim W, Kemp M, et al. Uric acid and survival in chronic heart failure: validation and application in metabolic, functional, and hemodynamic staging. Circulation. 2003;107:1991–1997. doi: 10.1161/01.CIR.0000065637.10517.A0. [DOI] [PubMed] [Google Scholar]
- 2.Saito M, Ishimitsu T, Minami J, Ono H, Ohrui M, Matsuoka H. Relations of plasma high-sensitivity C-reactive protein to traditional cardiovascular risk factors. Atherosclerosis. 2003;167:73–79. doi: 10.1016/s0021-9150(02)00380-5. [DOI] [PubMed] [Google Scholar]
- 3.Farquharson CA, Butler R, Hill A, Belch JJ, Struthers AD. Allopurinol improves endothelial dysfunction in chronic heart failure. Circulation. 2002;106:221–226. doi: 10.1161/01.cir.0000022140.61460.1d. [DOI] [PubMed] [Google Scholar]
- 4.Doehner W, Schoene N, Rauchhaus M, Leyva-Leon F, Pavitt DV, Reaveley DA, Schuler G, Coats AJ, Anker SD, Hambrecht R. Effects of xanthine oxidase inhibition with allopurinol on endothelial function and peripheral blood flow in hyperuricemic patients with chronic heart failure. Circulation. 2002;105:2619–2624. doi: 10.1161/01.cir.0000017502.58595.ed. [DOI] [PubMed] [Google Scholar]
- 5.Feig DI, Johnson RJ. Hyperuricemia in childhood essential hypertension. Hypertension. 2003;42:247–252. doi: 10.1161/01.HYP.0000085858.66548.59. [DOI] [PMC free article] [PubMed] [Google Scholar]
- 6.Johnson RJ, Kang DH, Feig D, Kivlighn S, Kanellis J, Watanabe S, Tuttle KR, Rodriguez-Iturbe B, Herrera-Acosta J, Mazzali M. Is there a pathogenetic role for uric acid in hypertension and cardiovascular and renal disease? Hypertension. 2003;41:1183–1190. doi: 10.1161/01.HYP.0000069700.62727.C5. [DOI] [PubMed] [Google Scholar]
- 7.Freedman DS, Williamson DF, Gunter EW, Byers T. Relation of serum uric acid to mortality and ischemic heart disease. The NHANES I epidemiologic follow-up study. Am J Epidemiol. 1995;141:637–644. doi: 10.1093/oxfordjournals.aje.a117479. [DOI] [PubMed] [Google Scholar]
- 8.Fang J, Alderman MH, National Health and Nutrition Examination Survey Serum uric acid and cardiovascular mortality: the NHANES I epidemiologic follow-up study, 1971-1992. JAMA. 2000;283:2404–2410. doi: 10.1001/jama.283.18.2404. [DOI] [PubMed] [Google Scholar]
- 9.Goldberg RJ, Burchfiel CM, Benfante R, Chiu D, Reed DM, Yano K. Lifestyle and biologic factors associated with atherosclerotic disease in middle-aged men. 20-Year findings from the Honolulu Heart Program. Arch Intern Med. 1995;155:686–694. [PubMed] [Google Scholar]
- 10.Franse LV, Pahor M, Di Bari M, Shorr RI, Wan JY, Somes GW, Applegate WB. Serum uric acid, diuretic treatment and risk of cardiovascular events in the Systolic Hypertension in the Elderly Program (SHEP) J Hypertens. 2000;18:1149–1154. doi: 10.1097/00004872-200018080-00021. [DOI] [PubMed] [Google Scholar]
- 11.Alderman MH. Uric acid and cardiovascular risk. Curr Opin Pharmacol. 2002;2:126–130. doi: 10.1016/s1471-4892(02)00143-1. [DOI] [PubMed] [Google Scholar]
- 12.Baker JF, Krishnan E, Chen L, Schumacher HR. Serum uric acid and cardiovascular disease: recent developments, and where do they leave us? Am J Med. 2005;118:816–826. doi: 10.1016/j.amjmed.2005.03.043. [DOI] [PubMed] [Google Scholar]
- 13.Shi Y, Evans JE, Rock KL. Molecular identification of a danger signal that alerts the immune system to dying cells. Nature. 2003;425:516–521. doi: 10.1038/nature01991. [DOI] [PubMed] [Google Scholar]
- 14.Ruggiero C, Cherubini A, Ble A, Bos AJ, Maggio M, Dixit VD, Lauretani F, Bandinelli S, Senin U, Ferrucci L. Uric acid and inflammatory markers. Eur Heart J. 2006;27:1174–1181. doi: 10.1093/eurheartj/ehi879. [DOI] [PMC free article] [PubMed] [Google Scholar]
- 15.Ferrucci L, Bandinelli S, Benvenuti E, Di Iorio A, Macchi C, Harris TB, Guralnik JM. Subsystems contributing to the decline in ability to walk: bridging the gap between epidemiology and geriatric practice in the InCHIANTI Study. J Am Geriatr Soc. 2000;48:1618–1625. doi: 10.1111/j.1532-5415.2000.tb03873.x. [DOI] [PubMed] [Google Scholar]
- 16.Ferrucci L, Harris TB, Guralnik JM, Tracy RP, Corti MC, Cohen HJ, Penninx B, Pahor M, Wallace R, Havlik RJ. Serum IL-6 level and the development of disability in older persons. J Am Geriatr Soc. 1999;47:639–646. doi: 10.1111/j.1532-5415.1999.tb01583.x. [DOI] [PubMed] [Google Scholar]
- 17.Pearson TA, Mensah GA, Alexander RW, Anderson JL, Cannon RO, III, Criqui M, Fadl YY, Fortmann SP, Hong Y, Myers GL, et al. for the Centers for Disease Control and Prevention. American Heart Association Markers of inflammation and cardiovascular disease: application to clinical and public health practice: a statement for healthcare professionals from the Centers for Disease Control and Prevention and the American Heart Association. Circulation. 2003;107:499–511. doi: 10.1161/01.cir.0000052939.59093.45. [DOI] [PubMed] [Google Scholar]
- 18.Salvini S. A food composition database for epidemiological studies in Italy. Cancer. 1997;114:299–300. doi: 10.1016/s0304-3835(97)04686-7. [DOI] [PubMed] [Google Scholar]
- 19.Levey AS, Coresh J, Balk E, Kausz AT, Levin A, Steffes MW, Hogg RJ, Perrone RD, Lau J, Eknoyan G, for the National Kidney Foundation National Kidney Foundation practice guidelines for chronic kidney disease: evaluation, classification, and stratification. Ann Intern Med. 2003;139:137–147. doi: 10.7326/0003-4819-139-2-200307150-00013. [DOI] [PubMed] [Google Scholar]
- 20.Guralnik JM, Fried LP, Simonsick EM, Kasper JD, Lafferty ME. The Women’s Health and Aging Study: Health and Social Characteristics of Older Women With Disability. National Institute of Aging; Bethesda, MD: 1995. [Google Scholar]
- 21.Third Report of the National Cholesterol Education Program (NCEP) Expert Panel on Detection, Evaluation, and Treatment of High Blood Cholesterol in Adults (Adult Treatment Panel III). Final report. Circulation. 2002;106:3143–3421. [PubMed] [Google Scholar]
- 22.McDermott MM, Guralnik JM, Albay M, Bandinelli S, Miniati B, Ferrucci L. Impairments of muscles and nerves associated with peripheral arterial disease and their relationship with lower extremity functioning: the InCHIANTI Study. J Am Geriatr Soc. 2004;52:405–410. doi: 10.1111/j.1532-5415.2004.52113.x. [DOI] [PubMed] [Google Scholar]
- 23.Rosner B, Munoz A. Conditional linear models for longitudinal data. In: Dwyer J, Feinleib M, Lippert P, Hoffmaeister H, editors. Statistical Models for Longitudinal Studies of Health. Oxford University; New York: 1992. pp. 115–131. [Google Scholar]
- 24.Jossa F, Farinaro E, Panico S, Krogh V, Celentano E, Galasso R, Mancini M, Trevisan M. Serum uric acid and hypertension: the Olivetti heart study. J Hum Hypertens. 1994;8:677–681. [PubMed] [Google Scholar]
- 25.Nakanishi N, Okamoto M, Yoshida H, Matsuo Y, Suzuki K, Tatara K. Serum uric acid and risk for development of hypertension and impaired fasting glucose or type II diabetes in Japanese male office workers. Eur J Epidemiol. 2003;18:523–530. doi: 10.1023/a:1024600905574. [DOI] [PubMed] [Google Scholar]
- 26.Niskanen LK, Laaksonen DE, Nyyssonen K, Alfthan G, Lakka HM, Lakka TA, Salonen JT. Uric acid level as a risk factor for cardiovascular and all-cause mortality in middle-aged men: a prospective cohort study. Arch Intern Med. 2004;164:1546–1551. doi: 10.1001/archinte.164.14.1546. [DOI] [PubMed] [Google Scholar]
- 27.Jee SH, Lee SY, Kim MT. Serum uric acid and risk of death from cancer, cardiovascular disease or all causes in men. Eur J Cardiovasc Prev Rehabil. 2004;11:185–191. doi: 10.1097/01.hjr.0000130222.50258.22. [DOI] [PubMed] [Google Scholar]
- 28.Weir CJ, Muir SW, Walters MR, Lees KR. Serum urate as an independent predictor of poor outcome and future vascular events after acute stroke. Stroke. 2003;34:1951–1956. doi: 10.1161/01.STR.0000081983.34771.D2. [DOI] [PubMed] [Google Scholar]
- 29.Ochiai ME, Barretto AC, Oliveira MT, Jr, Munhoz RT, Morgado PC, Ramires JA. Uric acid renal excretion and renal insufficiency in decompensated severe heart failure. Eur J Heart Fail. 2005;7:468–474. doi: 10.1016/j.ejheart.2004.09.018. [DOI] [PubMed] [Google Scholar]
- 30.Krishnan E, Baker JF, Furst DE, Schumacher HR. Gout and the risk of acute myocardial infarction. Arthritis Rheum. 2006;54:2688–2696. doi: 10.1002/art.22014. [DOI] [PubMed] [Google Scholar]