Abstract
The diagnosis and staging of lung cancer often begins with the assessment of a suspect peripheral chest site. Such suspicious peripheral sites may be solitary pulmonary nodules or other abnormally appearing regions of interest (ROIs). The state-of-the-art process for assessing such peripheral ROIs involves off-line procedure planning using a three-dimensional (3D) multidetector computed tomography (MDCT) chest scan followed by bronchoscopy with an ultrathin bronchoscope. We present an integrated computer-based system for planning peripheral bronchoscopic procedures. The system takes a 3D MDCT chest image as input and performs nearly all operations automatically. The only interaction required by the physician is the selection of ROI locations. The system is computationally efficient and fits smoothly within the clinical work flow. Integrated into the system and described in detail in the paper is a new surface-definition method, which is vital for effective analysis and planning to peripheral sites. Results demonstrate the efficacy of the system and its usage for the live guidance of ultrathin bronchoscopy to the periphery.
Keywords: image-guided surgery, 3D imaging, virtual bronchoscopy, lung cancer, bronchoscopy, pulmonary nodules, airway tree
1 INTRODUCTION
The diagnosis and staging of lung cancer often begins with the assessment of a suspect peripheral chest site [1,2]. Such suspicious peripheral sites may be solitary pulmonary nodules, diffuse masses, or other abnormally appearing regions of interest (ROIs). The state-of-the-art process for assessing such peripheral ROIs involves off-line procedure planning using a three-dimensional (3D) multidetector computed tomography (MDCT) chest scan followed by bronchoscopy with an ultrathin bronchoscope [3-6]. If bronchoscopy determines that a selected ROI is benign, then more invasive surgery can be avoided [2,5].
The current practice for planning bronchoscopic procedures requires the physician to scroll through two-dimensional (2D) transverse-plane sections of the MDCT image on a computer console and perform 3D mental reconstruction of the anatomy. During this examination, the physician first identifies the diagnostic ROIs and then arrives at an appropriate 3D route through the airways for each ROI (Figure 1). In practice, an ROI is often a small solitary pulmonary nodule (≤ 30mm in diameter) situated several airway generations beyond the trachea [2]. Unfortunately, a physician’s accuracy at defining proper 3D routes is only on the order of 40% for ROIs located near airways at generation 4 or less, with errors beginning as early as generation 2 [7,8].
Figure 1.
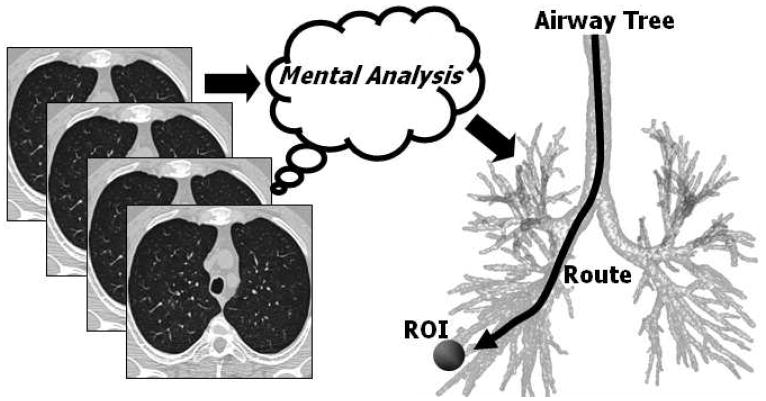
Current route-planning practice. The physician interactively scrolls through a high-resolution 3D MDCT image, which consists of a contiguous stack of 2D sections, to mentally determine a complex 3D airway route that reaches a diagnostically important ROI. Later, during live bronchoscopy, the physician draws upon this mental impression to navigate the bronchoscope through the airways. Even though the physician typically has the 3D MDCT scan available for perusal in the bronchoscopy laboratory during the procedure, his/her accuracy at reaching peripheral ROIs is only on the order of 40% [8].
Even if an accurate route is defined through 3D MDCT analysis, the physician must navigate the bronchoscope — with no direct MDCT-based assistance — through the complex bifurcating airway tree to reach a site. In many cases, an ROI is situated outside an airway and not visible through the bronchoscope’s endoluminal video feed. This forces the physician to make difficult bronchoscopic biopsy decisions blindly, incurring still more error [9-12]. Finally, the skill variation among physicians for performing bronchoscopy is known to be substantial [13, 14]. All of these factors make effective planning and follow-on bronchoscopy of peripheral sites difficult [4].
Supplemental devices do exist that provide assistance for maneuvering and positioning the bronchoscope, but they have restrictions. Fluoroscopy and CT fluoroscopy only give incomplete 2D information [15]. Endobronchial ultrasound only provides local extraluminal guidance information and gives no global assistance for navigating through the airway tree [16]. Lastly, electromagnetic navigation does enable guidance of the bronchoscope through the airways, but could benefit from a precisely defined 3D route prior to the procedure [17].
As a potential MDCT-based planning technique, virtual bronchoscopy (VB) has long been acknowledged as a means for producing endoluminal airway renderings that accurately resemble the interior airway views depicted by a bronchoscope [9,18-20]. In VB, image-processing methods create the endoluminal renderings by first segmenting the airway tree and then producing a computer-graphics model of the endoluminal surfaces of the segmented airways [9-12,19-21]. Recent research has incorporated VB techniques with follow-on ultrathin bronchoscopy for assessing peripheral chest sites [22-24]. Before bronchoscopy, the system employed by Asano et al. first determines airway routes and generates endoluminal renderings of the tracheobronchial tree at informative locations along the routes [23, 24]. Unfortunately, the system requires a physician to manually define the 3D airway routes for reaching each ROI and the parameters used for creating the endoluminal renderings. In fact, Shinagawa et al. pointed out the tediousness of these tasks and suggested the need for automation to reduce the burden on the physician [24].
We present an integrated computer-based system for planning peripheral bronchoscopic procedures. The system takes a 3D MDCT chest image as input and performs nearly all operations automatically. The only interaction required by the physician is the selection of ROI locations. The system is computationally efficient and fits smoothly within the clinical work flow. The final output of the system is a data structure referred to as a case study [11]. The case study later serves as an input for a pre-bronchoscopy report generator and also provides a plan used directly by an image-based guidance system during live bronchoscopy [25-27].
This paper focuses on the description of the complete integrated system and its application to planning peripheral bronchoscopic procedures. Section 2 first details the system. Section 3 illustrates the operation and the effectiveness of the system and demonstrates the system’s use for the live guidance of ultrathin bronchoscopy to the periphery. Finally, Section 4 offers concluding remarks.
2 SYSTEM DESCRIPTION
The proposed system accepts a high-resolution 3D MDCT chest scan I as input. Note that peripheral airways beyond generation 3 or greater have a diameter only on the order of 2-6 mm. Also, in our studies, we have used the Olympus BF-XP160F ultrathin videobronchoscope (2.8 mm diameter), a typical state-of-the-art bronchoscope employed for reaching peripheral airways [23, 24, 27]. Because of these size constraints, we generally require 3D MDCT data having a transverse-plane resolution (Δx,Δy) and a section spacing (Δz) on the order of 0.5-1.0 mm. Modern MDCT scanners readily produce such images [6].
Section 2.1 gives a top-level description of the system. Many of the methods incorporated into the system are described in detail in other publications. Hence, we summarize these methods within the context of the system in Section 2.2. Finally, robust and accurate endoluminal surface definition is crucial for being able to perform effective MDCT-based preplanning and later live image-based guidance of bronchoscopy for peripheral ROIs. This requires a new method for endoluminal surface definition, described in Section 2.3.
2.1 System Overview
The top-level process for using the system involves seven major steps summarized below:
ROI Selection: Identify desired diagnostic ROIs depicted in input image I (done by the physician).
ROI Definition: Use a rapid semi-automatic live-wire-based method for defining each ROI in I [28].
Airway-Tree Segmentation: Segment the 3D airway tree to produce subimage IS [29,30].
Airway Surface Definition Define accurate endoluminal surfaces for the segmented airways.
Centerline Analysis: Compute the central axes of the defined airways [31,32].
Route Planning: Apply a route-planning technique to define the optimal 3D route leading through the airways to each ROI [33].
Airway-Tree Editing: Examine the 3D route computed for each ROI and edit the airway tree by appropriately adding missing small child airways and their surface representations encountered along the route. This gives the most correct observable route leading to a given ROI [29,30].
The selection of the diagnostic ROIs done at the beginning of the process is the only step requiring physician input. As described shortly, this step is simple and straightforward. All other operations are initiated by a technician, and all of these operations are automatic, except for ROI definition (step 2) and airway-tree editing (step 7). As discussed more in Section 3, the system is efficient to use and fits smoothly within the clinical work flow.
The final output is a data structure referred to as a case study [11]. The case study contains all computed data, including the defined ROIs, airway surface representation, airway centerlines, specific 3D routes leading to each ROI, and quantitative measurements. A separate module, described elsewhere, uses the case study to derive an interactive report detailing the procedure plan for follow-on bronchoscopy [25,26,34]. In addition, the case study provides essential data for later live image-based guidance of bronchoscopy [10, 11, 27, 35]. The remainder of this section provides more detail on the operation of the system.
2.2 Overview of Existing Methods
As many of the methods incorporated into the system for steps 1-3 and 5-7 are complex and described in detail elsewhere, we refer the reader to the separate publications describing them [28-33, 36, 37]. We point out that the methods for airway tree segmentation and editing (steps 3 and 7), airway surface definition (steps 4), and route planning (step 6) were especially developed for robust 3D route planning to peripheral chest sites. The methods for ROI definition and centerline analysis (steps 2 and 5) are more general, yet have specific applicability to the peripheral airway-analysis problem. All of these separate methods have undergone considerable validation using many human 3D MDCT data sets and have been applied successfully to the live guidance of bronchoscopy to the periphery [27]. The remainder of this subsection gives a basic discussion of the methods for steps 1-3 and 5-7 within the context of the system, while Section 2.3 elaborates on our proposed new method for step 4, airway surface definition.
2.2.1 Steps 1 and 2: ROI Selection and Definition
The planning process begins by the selection and definition of diagnostic ROIs depicted in the input 3D MDCT scan I. For step 1, the physician merely needs to point to a location of an ROI and describe its basic shape and extent to a technician. At our University’s medical institution, participating physicians convey this information in one of two ways: (1) roughly outline the region on the MDCT scan via a PACS-networked radiology image-access program (our institution uses a system from General Electric); or (2) point to the location of an ROI on our system’s interactive display. With either method, the physician’s interaction is minimal.
For Step 2, a technician defines the 3D shape of each identified ROI. Because the ROIs encountered for lung-cancer assessment vary greatly in shape and appearance, we have devised a semi-automatic tool for rapid ROI definition. The tool draws upon the interactive paradigm known as the “live wire” (Figure 2a) [28, 38]. Briefly, the technician interactively begins a 2D contour of an ROI on a 2D MDCT section. An internal live-wire engine then automatically suggests sections of an optimal contour piece by piece as the technician moves the mouse. In this manner, a 2D ROI contour can be defined very rapidly for essentially any region. In addition, the tool allows the technician to override incorrectly-suggested sections by manually steering the contour definition; this is especially useful for region boundaries that are poorly defined or nearly nonexistent. Our live wire tool also enables efficient 3D ROI definition. After defining an ROI, the system then computes a filled volume to complete the definition of the region.
Figure 2.
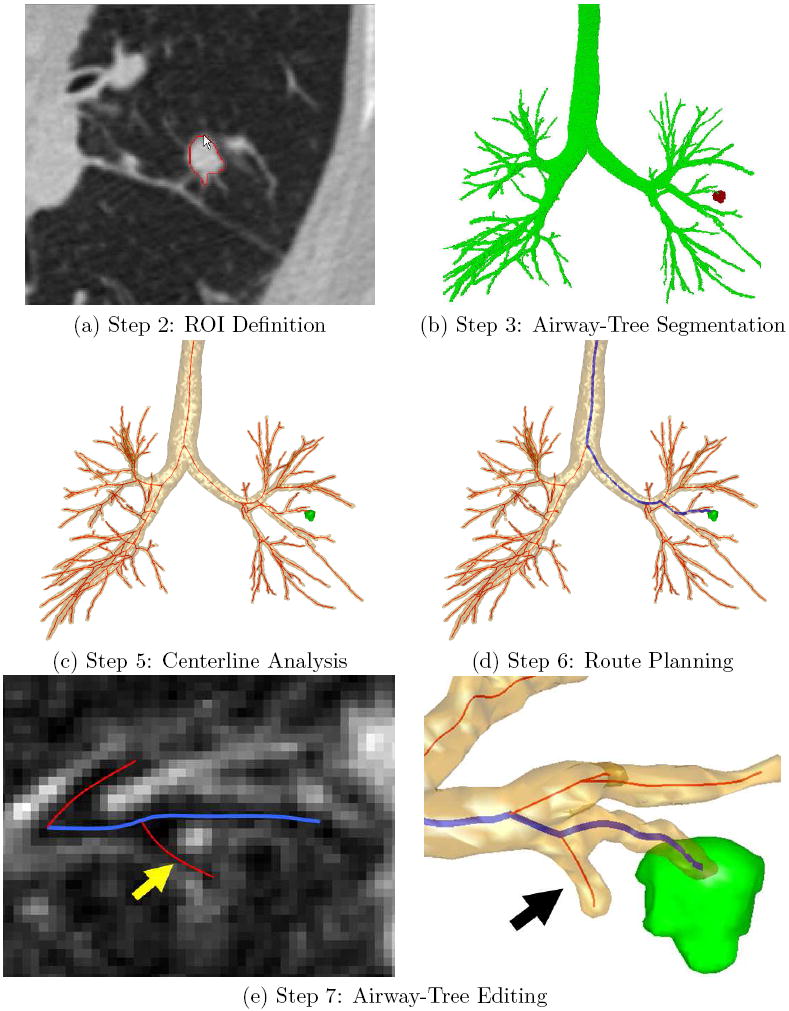
Illustrative outputs from the procedure planning system. A Siemens Sensation 40 scanner generated the input 3D MDCT image used for this example (image size: 512 × 512 × 796; voxel resolution: Δx = Δy = 0.86 mm, Δz = 0.50 mm; patient 20349.25). (a) Step 2 (ROI Definition): the use of live wire to define a previously identified lesion on a 2D slice of input 3D MDCT scan I. (b) Step 3 (Airway-Tree Segmentation): segmented airway tree IS (green) and the fully-defined peripheral lesion (red). (c) Step 5 (Centerline Analysis): Extracted centerlines (red) appear with the airway tree and ROI. (d) Step 6 (Route Planning): Blue path indicates the selected route for the previously defined ROI. (e) Step 7 (Airway-Tree Editing): the technician identifies a weakly-defined 8th generation airway, indicated by arrows in the local 2D cross-sectional slice on the left and the surface view on the right.
2.2.2 Step 3: Airway-Tree Segmentation
A suitable route leading to a selected peripheral ROI requires a complete extraction of all visible airways leading to the ROI. Airway-tree segmentation, which produces a binary-valued image IS containing the segmented airway tree, is the first step in this procedure. Many methods, based on region growing, mathematical morphology, and hybrid techniques, have been suggested previously for segmenting the airway tree [39-42]. But no method guarantees suitable extraction of all necessary peripheral airways. Robust extraction of peripheral small-diameter airways is challenging, because of insufficient image spatial resolution (Δx,Δy,Δz), low contrast between airway/wall interfaces, and incomplete airway/wall borders.
We have devised an automatic method that extracts substantially more peripheral airways than existing methods. Described more fully in [29, 30], the method can be summarized as follows: (1) apply adaptive region growing to give a conservative segmentation; (2) perform a search for candidate cross-sections of missed airways; (3) assemble candidate cross-sections into potential airway-branch sections and reject disconnected candidate cross-sections; (4) connect sufficiently close airway-branch sections into larger branch sections; and (5) apply a global graph-search algorithm to locate and attach suitable branch sections to the previously computed segmentation. This gives the final IS (Figure 2b). We have demonstrated the method on over 40 3D human MDCT scans. The method typically extracts 2-3 more generations of peripheral airways than existing methods.
2.2.3 Steps 5 and 6: Centerline Analysis and Route Planning
After airway-tree segmentation, surface definition (step 4) is applied. As this involves a major discussion in its own right, we defer it until Section 2.3.
After surface definition, we apply the centerline analysis method of Yu et al. to compute the central axes of the segmented airways (step 5) [31, 32]. The method is especially effective in situating the centerlines in the airway-bifurcation regions. The improved accuracy is necessary, since the centerlines define the trajectories for computing endoluminal renderings through the airway surfaces and also serve as initialization locations during later image-based guidance of live bronchoscopy. Figure 2c gives an example output for centerline analysis. We also compute quantitative measurements, such as airway cross-sectional area and diameters, along equally spaced locations along the centerlines [36,37]. These measurements provide necessary information to route planning and to later report generation [25,26,34].
Next, for 3D route planning (step 6), we employ the automatic method of Gibbs and Higgins to compute routes [33]. For each ROI, the method applies a simple optimization to locate the route through the defined airways that: (1) is situated closest to the ROI; and (2) accounts for the size and bending restrictions of the bronchoscope relative to the previously computed airway-tree measurements. This gives a route that not only terminates close to the ROI but also enables the bronchoscope to fit through its entire extent during a live procedure. Figure 2d depicts an example optimal route.
2.2.4 Step 7: Airway-Tree Editing
A given 3D route produced by route planning gives a passage through the segmented airways in IS leading to the vicinity of a particular ROI. Unfortunately, small child airways branching off of the route may be missed. Even though such airways do not need to be traversed during later bronchoscopy, their definition is important for later report generation and image-based guidance of bronchoscopy [25,26,35,43]. Failing to include all airways branching off of a route leading to an ROI could be misleading and disorienting and ultimately result in unsuccessful bronchoscopy. For this reason, we have devised an interactive tree-editing tool.
Described more fully in [29, 30], the technician interactively previews each route defined by the route planner and visually locates missing small child airways. When a missed child airway is identified, a live-wire-based tool allows rapid interactive definition of the missed airway. Figure 2e shows a weakly-defined peripheral airway missing from IS and the airway surfaces, centerlines, and route after the interactive addition of the missing airway. Note that a “complete” child airway need not be added, as the important issue is to provide the proper landmarks for correct surface definition.
Figure 3 shows the impact of this process, both in the MDCT-based endoluminal renderings and in the subsequently observed live bronchoscopic video. Before tree editing, the endoluminal rendering (Figure 3a) does not show an existing child airway. With the branch added by tree editing, the endoluminal rendering now correctly shows the airway geometry (Figure 3b) as revealed in the live bronchoscopic video (Figure 3c). In our human studies, we have typically needed to add one or two extra child peripheral branches, with no additions needed in many cases. For all cases considered to date, we have not had to add any branch before generation 5, with the median addition occurring at generation 8 [27].
Figure 3.
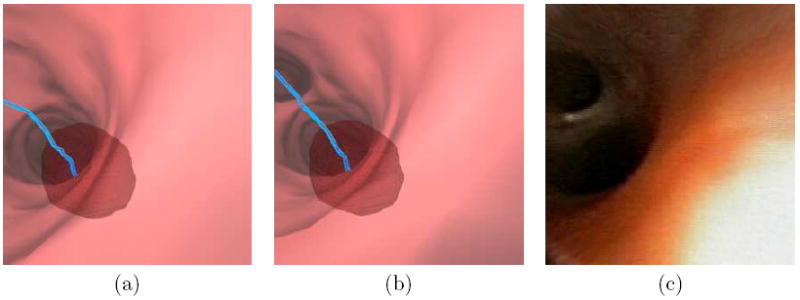
Example of the impact of Airway-Tree Editing for case 20349.3.24 (Figures 8 and 9). Part (a) shows a resulting endoluminal rendering derived from the raw segmented tree IS, while part (b) shows a similar result after a small peripheral generation-12 child branch is added via Airway-Tree Editing. The blue line is the preplanned route leading to the ROI rendered transparently in red. The added branch is necessary, as verified by the video for this case recorded during the live guided bronchoscopy — note the small airway in the upper-left portions of the views for parts (b-c).
2.3 Step 4: Airway Surface Definition
We now return to Step 4, a major innovation within the system for peripheral analysis. Unfortunately, the standard approach for generating surface data from a segmented 3D MDCT image typically yields unacceptable representations for the endoluminal surfaces of small peripheral airways. This step is critical, however, for accurate centerline analysis, 3D route planning, and quantitative calculation (steps 5-7), for follow-up report generation, and, ultimately, for successful live guidance of bronchoscopy to the periphery. This subsection describes our proposed robust method for endoluminal surface calculation.
We first provide background and discuss related work. Large airways, such as the trachea and main bronchi, appear in I as dark voxels having nominal Hounsfield Unit (HU) values of −1000 HU surrounded by brighter soft-tissue walls having nominal HU values ≈ 50 – 200 HU [44]. When observed in MDCT images, large airway have diameters ≥ 10 mm and exhibit thick, well-defined walls (> 1 mm thickness) surrounding the lumen. Due to partial volume averaging and smoothing kernels used during image reconstruction, however, abrupt 1200 HU transitions in I do not occur at airway/wall interfaces. Instead, the response spreads over several voxels (Figure 4a). Furthermore, small-diameter peripheral airways (< 4 mm diameter) have walls that are often thinner than the voxel resolution and are surrounded by dark voxels, resulting in weak signatures in I (Figure 4b). Surrounding anatomical structures (e.g., blood vessels) and image noise further obscure these small airways.
Figure 4.

Idealized gray-scale profiles of a thick-walled airway (a) and thin-walled airway (b). The dotted line represents the underlying idealized HU profile of the airway-wall interface, with small values corresponding to air and large values corresponding to soft tissue. The solid line represents the actual observed blurred HU profile in I. The local maximum of the intensity gradient is marked by a dot, while the location of the average between air and soft-tissue HU values is marked by a short horizontal line. For thick-walled airway (a), both the average-value isosurface and the maximum of the intensity gradient properly localize the surface interface separating air and wall. For the thin-walled airway (b), however, neither quantity accurately localizes this surface. The average-HU isosurface value is never reached, which causes holes in an endoluminal rendering of this surface. Conversely, the maximum of the intensity gradient appears well within the airway, which results in an overly constricted endoluminal rendering.
The current standard method for defining airway-tree surfaces is to extract an isosurface from I at an HU value between air and soft tissue via the Marching Cubes algorithm [45]. Since many disconnected isosurfaces may exist, this approach typically constrains the airway surface to be near IS. Such segmentation-constrained -600 HU isosurfaces have been shown to produce endoluminal renderings that correspond well with bronchoscopic video in the large airways [10, 11, 46]. Unfortunately, this approach breaks down in the periphery. The weak signatures of small airways often fail to cross the isosurface threshold, leading to visible holes in endoluminal renderings (Figure 5). In addition, the endoluminal renderings often appear too small. Because of the incomplete airway-wall definition and poor representation of the airway-tree topology, such endoluminal renderings are inadequate for peripheral reporting and guidance. The problems illustrated in Figure 5 typically occur in the large majority of peripheral airways for a given MDCT image.
Figure 5.
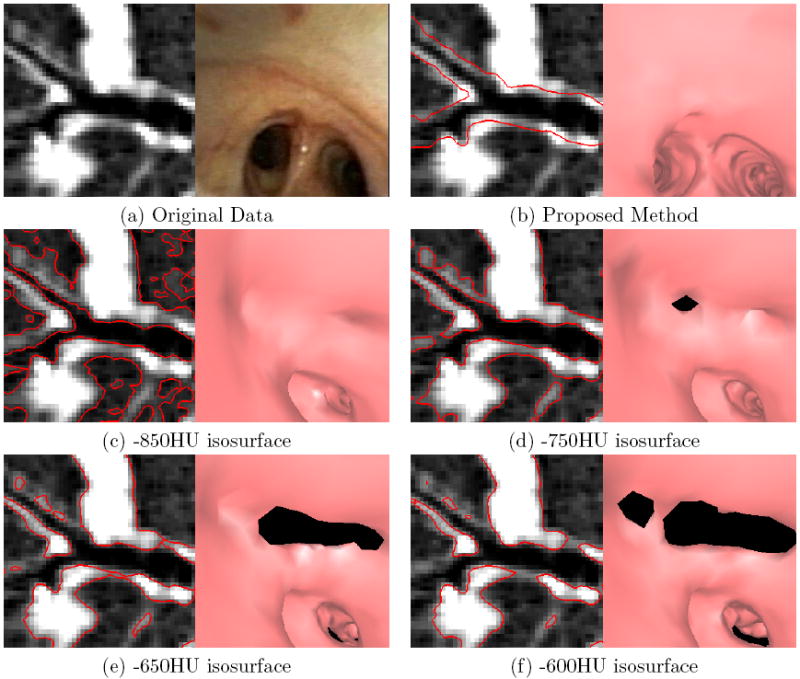
Examples of endoluminal surfaces produced by the proposed surface-definition method and the previous method relying on fixed-HU values. The selected bifurcation is for a peripheral airway near the medial segment of the right upper lobe. A Siemens Sensation 40 scanner generated the MDCT image (image size: 512 × 512 × 557; voxel resolution: Δx = Δy = Δz = 0.50 mm; patient 20349.3.26). (a) Raw local oblique MDCT cross section in the vicinity of the bifurcation and a corresponding bronchoscopic video frame depicting the bifurcation. (b) Surfaces (red) produced by the proposed method overlaid on the cross-sectional image and an endoluminal rendering corresponding to the pose of the real bronchoscopic video of (a). Parts (c-f) depict corresponding results using the fixed-HU method for various HU values. The isosurfaces can be simultaneously too conservatively and too incompletely defined. For all thresholds, the surfaces are too narrow — the bifurcation that is apparent in the video frame (a) is not completely visible in any of the endoluminal renderings (c-f). With the exception of the -850HU isosurface, all isosurfaces also contain noticeable holes (the black regions appearing in the endoluminal renderings).
Li et al. defined airway tree surfaces using a graph-theoretic approach [47]. Unfortunately, the method is too computationally intensive for practical clinical use and does not handle bifurcation regions, which are of vital importance to VB reporting and guidance. Saragaglia et al. focused on generating surfaces for measuring airway-wall thicknesses rather than VB [48]. In this method, the interior airway-wall surface is generated using the segmented image only. While acceptable for peripheral airways, such an approach loses precision in the larger airways. Thus, no method exists that provides sub-voxel precise surfaces in both the large, well-defined airways and weakly-defined peripheral airways. The remainder of this section details a new approach that addresses these issues.
2.3.1 Method Overview
The inputs to the method are the original grayscale data I and the segmented airway-tree image IS. We begin by forming two intermediate images, II and IT. II contains well-defined local isosurfaces of I and is used in areas of strong image support. IT, on the other hand, is a topological-dilation image and is used in weakly-defined peripheral regions. Also, for computational efficiency, much of the processing to follow only needs to consider voxels υ that are “near” the segmented airway tree contained in IS. To do this, we use simple morphological dilations to construct another subimage IM, such that IS ⊂ IM. IM, a binary-mask image consisting of all the voxels in I that are at a distance ≤ 3.5 mm from the nearest voxel in IS, liberally includes any image voxels that might contribute to the desired surfaces.
To construct both II and IT, we make use of a connected-component tree data structure T [37]. T is derived from IS as follows. First, a front-propagation algorithm finds the minimum-length path through IS connecting each segmented voxel υ ∈ IS with a preselected site in the trachea (this can be essentially any tracheal site). The length of each path is quantized to within ±1 mm. 26-connected voxels situated on identical length paths form a connected component Ci. Assume T contains N such components, Ci, i = 1, … N, each defining an approximate local cross section of the airway tree (N typically around a few thousand — see Table 1). Processing is also done so that T contains adjacency and parent-child relationships between the various components. In particular, if a voxel in component Ci is 26-connected to a voxel in Cj, i ≠ j, and the path length associated with Ci is less than that of Cj, then Ci is the parent of child component Cj.
Table 1.
Performance summary for five cases analyzed with the procedure-planning system. The top portion gives the number of ROIs identified in each case and summarizes quantitative data related to airway-tree segmentation. The bottom portion provides the execution times of each system component, omitting the time required for file input/output. The times for ROI Definition, Route Planning, and Airway-Tree Editing are averages over the eleven ROIs. The other steps, Airway-Tree Segmentation, Airway Surface Definition, and Centerline Analysis, are performed once per case, regardless of the number of ROIs. The “Total: Per-ROI Steps” gives the mean time required for ROI Definition, Route Planning, and Airway-Tree Editing, averaged over the number of ROIs in the case. The “Total: Per-Case Steps” gives the total time required for those steps that are only performed once (does not depend on the number of ROIs). The “Total: Average Planning Time” is the time required for all planning steps in a typical case containing a single ROI.
| Case |
||||||
|---|---|---|---|---|---|---|
| A | B | C | D | E | Mean | |
| # of ROIs | 5 | 1 | 1 | 2 | 2 | 2.2 |
| Airway-Tree Seg. Vol. (mm3) | 45,242 | 37,651 | 81,167 | 42,032 | 57,703 | 52,759 |
| # of Connected-Components Ci | 4,491 | 4,228 | 3,642 | 2,637 | 4,680 | 3,936 |
| ROI Definition (sec/ROI) | 122 | 67 | 76 | 284 | 114 | 141 |
| Airway-Tree Segmentation (sec) | 160 | 115 | 226 | 143 | 164 | 162 |
| Airway Surface Def. (sec) | 76 | 73 | 67 | 71 | 106 | 79 |
| Centerline Analysis (sec) | 93 | 63 | 56 | 89 | 116 | 56 |
| Route Planning (sec/ROI) | 2 | 1 | 1 | 2 | 1 | 1.6 |
| Airway-Tree Editing (sec/ROI) | 247 | 557 | 282 | 727 | 406 | 395 |
| Total: Per-ROI Steps (min:sec) | 6:11 | 10:25 | 5:59 | 16:53 | 8:41 | 8:57 |
| Total: Per-Case Steps (min:sec) | 5:29 | 4:11 | 5:49 | 5:03 | 6:26 | 4:56 |
| Total: Average Planning Time (min:sec) | 11:40 | 14:36 | 11:48 | 21:56 | 15:07 | 13:53 |
Given T, the local isosurface image II and the topological-dilation image IT can be defined, as discussed in Subsections 2.3.2 and 2.3.3. Finally, we blend II and IT to form a likelihood image IL, which is then used to derive the final surfaces (Subsection 2.3.4).
2.3.2 Local Isosurface Image II
We use the components in T to determine local isosurfaces in I, if they exist. Many threshold values can be chosen to produce a local isosurface around each component. Underestimating a threshold value leads to constricted endoluminal renderings, while overestimating the threshold leads to surface holes (Figure 5). An appropriate threshold ti for a given component Ci, therefore, is the largest value that produces a completely-defined local isosurface about Ci.
We estimate the threshold ti of a component Ci by finding the most weakly-defined airway-wall sections. To find these sections, we first erode a binary image of the voxels in Ci with an 18-connected structuring element to produce an eroded component CiE. While the airway-tree segmentation is typically confined to lumen voxels, the erosion helps make it highly likely that CiE contains no airway-wall voxels. We then examine a set of 18-connected paths P emanating from voxels in CiE and traversing the airway wall. Each path p ∈ P consists of an 18-connected sequence of voxels in I. The paths are constrained to have lengths ≤ 5.0 mm, must terminate at a distance ≥ 2.5 mm from the nearest voxel in IS, and must be wholly contained within IM. Given the typical resolution of the 3D MDCT chest image data, these requirements help ensure that each path completely traverses the airway wall and that the paths in P sample all airway-wall sections around CiE.The maximum grayscale value encountered along p indicates the strength of the airway wall along the path. A component Ci is assigned a threshold estimate ti by
| (1) |
where υ is a voxel in p. This identifies the weakest section of airway wall that could lead to holes in an isosurface.
Threshold estimates can vary greatly between adjacent components. Directly using the estimates to determine local isosurfaces leads to artifacts in II. We instead define a smoothly-varying component score Si for each Ci ∈ T, i= 1 … N. Each score is found via a bottom-up dynamic programming algorithm that progresses from terminal bronchi in T back to a proximal location in the trachea [37]. This approach strongly penalizes component scores Si ≥ ti. Such a penalty reflects our experience that holes are more of a hinderance to VB guidance than constricted airways.
Next, we construct a threshold image Ithresh from the component scores. More explicitly, if D(υ, Ci) is the distance from a voxel υ ∈ IM to Ci and D(υ, Ci) ≤ D(υ, Cj), ∀ j ≠ i,j = 1,…N, then the grayscale value of Ithresh for voxel υ ∈ IM is given by
| (2) |
The value Ithresh(υ) shifts the HU value of I to align the local airway isosurfaces of I to a global 0-isosurface in II by
| (3) |
Equation (3) gives the final form of the local isosurface image II used later during final surface construction (Subsection 2.3.4).
2.3.3 Topological-Dilation Image IT
This section describes the construction of IT, the image used to help define surfaces of peripheral airways.
The straightforward approach for extracting an isosurface directly from IS yields poor results. The smoothing effects of partial-volume averaging and image-reconstruction kernels do not exist in IS. Without smooth transitions in the image data, the resulting isosurfaces fall along voxel boundaries, leading to blocky, anatomically-incorrect endoluminal renderings. More importantly, since IS is conservatively defined, endoluminal renderings of IS-based isosurfaces are overly constricted. An isotropic dilation of IS combined with the original gray-scale data I partially ameliorate these difficulties [11]. Yet, small neighboring airways still can appear merged. Figure 6 illustrates these difficulties.
Figure 6.
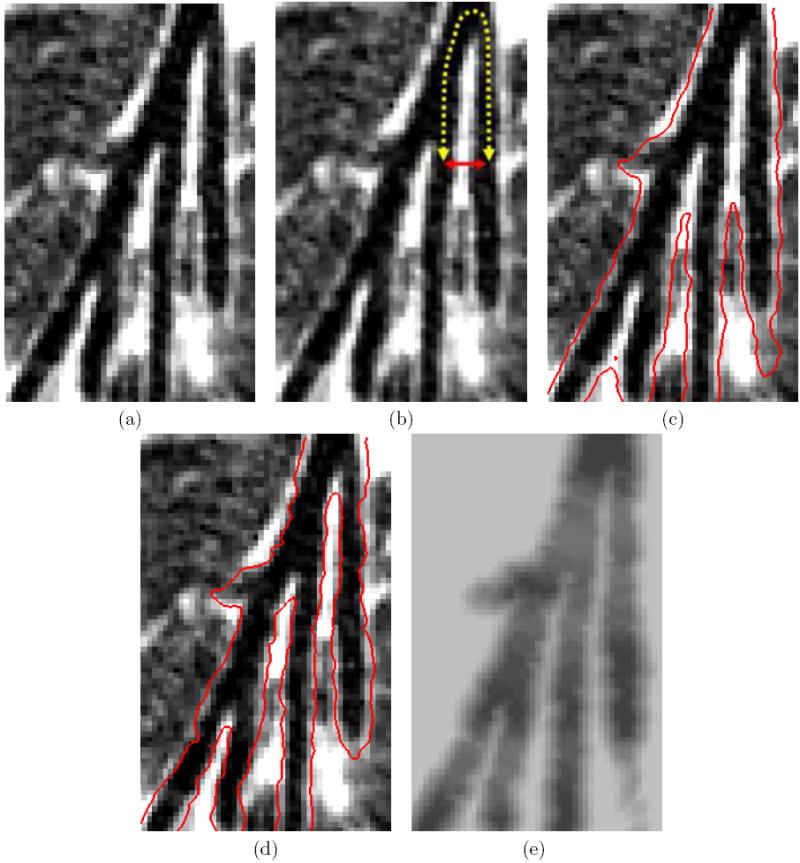
Various endoluminal surface representations produced for a location containing parallel peripheral branches at generations 6, 7, 8, and 9 in the right middle lobe medial segment. MDCT chest scan generated by a Siemens Sensation 16 scanner (image size: 512×512×544; voxel resolution: Δx = Δy = 0.68 mm, Δz = 0.50 mm; patient 20349.3.7): Part (a) shows the raw oblique cross-sectional data. Part (b) illustrates a pair of airways that are separated by a large topological distance, indicated by the dashed line, but a small Euclidean distance, shown by the solid line. Part (c) shows the same data with the surfaces (red) generated by an isotropic dilation of the airway-tree segmentation by 1.0 mm; the two airways singled out in part (b) have nearly merged together. Part (d) shows the surfaces produced by the proposed method — the two airways are now distinct. Part (e) shows an oblique cross section of the final likelihood image IL.
To avoid these errors, we propose an operation we will refer to as topological dilation, which sets the airway walls as close as possible to a desired distance dD from the nearest airway-tree voxel in IS without merging topologically distinct airways. We define topologically-distinct airways in terms of parent-child relationships associated with the connected-component tree T. The method proceeds in three steps:
Define the topological-dilation constraints. This step identifies pairs of components in T that would merge under standard isotropic dilation by dD but should remain distinct (e.g., Figure 6c). Such components locally constrain the achievable topological-dilation distances. Additional constraints help ensure the local topological-dilation distances vary smoothly over the airway tree.
Apply the constraints to a linear programming (LP) problem. The solution of the LP problem dictates the topological-dilation distance of each component to sub-voxel resolution.
Generate the topological-dilation image. IT is formed by combining dilated versions of each component in T.
Below, we give more details on these steps.
The first step identifies pairs of components whose isotropic dilation by an amount dD could result in inappropriate intersections in IT. Nominally, problematic component pairs are separated by a Euclidean distance d ≤ 2 · dD. Because the airway surfaces are ultimately derived from a discretely-sampled volumetric image, however, the voxel dimensions Δ = (Δx,Δy,Δz) must be taken into account. In practice, we search for components separated by a distance d ≤ dS, where dS is given by
| (4) |
and ∥Δ∥ is the Euclidean norm of the vector Δ. Not all such pairs of components with small separation distances are problematic. In fact, the construction of T ensures that all components must be within dS of another component, because each is 26-connected relative to the original digitally-sampled lattice of I to either a parent, a child, or both. Constraints should apply only to components with small separation distances that are topologically distant from one another (Figure 6b). Formally, only components separated by a Euclidean distance ≤ dS and a topological distance ≥ dT constrain topological dilation. The integer value dT equals the number of components Ci encountered on the unique path between the pairs of components under consideration. We have experimentally found that dT = 7 yields appropriate results.
The second step is to determine appropriate local topological-dilation distances for each component. We constrain the topological-dilation distance fi of component Ci in the following ways:
-
The topological-dilation distance for each component is bounded from above by the desired isotropic dilation amount:
(5) -
Define dij as the Euclidean distance between Ci and a topologically distant component Cj, i ≠ j. If dij < dS, then
(6) where ∈ > 0 is an infinitesimal constant that prevents self intersections (∈ = 0.01 in this paper).
-
If Ci is the parent of Cj, i ≠ j, then
(7) Constraint (7) limits the amount that adjacent components can change in size and helps ensure a more smoothly varying IT. dsmooth = 0.25 mm for the results in this paper.
The objective now is to maximize
| (8) |
the sum of all dilation distances fi for the Ci ∈ T, subject to constraints (5-7). The solution vector
| (9) |
of this LP problem gives the local topological-dilation distance fi of each component Ci.
The final step is to generate IT so that its 0-grayscale isosurface reflects the desired local dilation distances. The grayscale value IT(υ) of a voxel υ ∈ IM is given by
| (10) |
where D(υ, Ci) is the minimum distance between υ and Ci, fi is the topological-dilation distance of Ci, and α scales the floating-point distances D(υ, Ci) appropriately for representation by 16-bit integer values. The value of α is essentially arbitrary, as long as it is large. The results in this paper are generated with α = 100.
2.3.4 Final Surface Construction
With II constructed per (3) and IT constructed per (10), we now construct the likelihood image IL. To assign values to each voxel in IL, we examine (2), the threshold-image Ithresh. A high value for Ithresh(υ) implies that voxel υ corresponds to a strong airway wall and II(υ) should be assigned to IL(υ). Likewise, a low value for Ithresh(υ) implies that voxel υ corresponds to a weak airway wall and IT(υ) should be assigned to IL(υ). Thus,
| (11) |
where the value −675 is the cross-over threshold for assigning values. Much flexibility exists for picking this value, given the MDCT chest image characteristics we assume. The voxels υ ∉ IM, which are outside the mask region, are not of interest and do not appear in the final surfaces. Finally, the desired surfaces are extracted from IL via Marching Cubes [45]. The next section gives results for this method.
3 RESULTS
The proposed system has undergone considerable validation using data produced by 4-, 16-, 40-, and 64-detector MDCT scanners (scanner manufacturers: Siemens, Philips). In addition to the extensive results during the testing and verification of the individual methods [28-33, 36, 37], we have also applied the system to (1) bronchoscopy training, (2) central-chest lymph-node analysis, (3) image-guided bronchoscopy of mediastinal lymph nodes, and (4) physician performance analysis of bronchoscopy to the periphery [49-53]. In this section, we demonstrate the system for complete MDCT-based analysis of peripheral cases and give further results for defining endoluminal surfaces of peripheral airways. Finally, we illustrate the use of the case study data for live image-based guidance of bronchoscopy to the periphery.
The data presented in this paper was collected at the Penn State Milton S. Hershey Medical Center under institutional review board approval. To date, we have processed over 40 cases, with 14 cases having undergone full live guidance of bronchoscopy to the periphery [27]. We focus our attention on these latter cases. For these cases, the physicians defined 31 diagnostic ROIs. These ROIs occurred at a median depth of 8 airway generations beyond the trachea and were distributed throughout the two lungs.
Table 1 gives a summary of performance results for five cases. All processing was performed on a standard dual-core 2.6 GHz machine, equipped with 4 GB of RAM and running Windows XP. The top portion of the table provides quantitative data for airway-tree segmentation. These data influence the running times of the segmentation, centerline, and surface-definition steps. The bottom portion of Table 1 gives the execution time required for each system component, excluding the time for file I/O.
ROI Definition (step 2) and Airway-Tree Editing (step 7), the steps requiring human interaction, incurred the largest timing variations. A technician, who was given the coordinates of each ROI’s center of mass by a physician, defined the ROIs. Individual large ROIs in Cases A and D (major axis lengths = 48 mm and 42 mm) took longer to define than smaller ROIs (major axis lengths ≤ 17 mm). For Airway-Tree Editing, airway-tree size and morphology, image quality, ROI size and location, and patient characteristics influenced the interaction time. The automatic steps ran quickly, especially considering that a typical 3D MDCT data set contained on the order of 300 MB of data. The total time required by a technician to produce a complete case study was just under 14 minutes on average, a very rapid and tolerable length of time.
Figure 2, discussed previously in Section 2, presented results of the complete system for a route to a peripheral lesion leading to an aberrant segment branching off the lingular bronchus in the left upper lobe of patient 20349.25. As we have demonstrated elsewhere, successful bronchoscopy involves two factors [52, 53]: (1) following the correct route leading to the ROI; and (2) proper location of the biopsy site when in the vicinity of the ROI. Figure 7 illustrates additional information our system provides when reaching the vicinity of an ROI. A blue arrow of length 4 mm appears at the end of the route pointing to proper biopsy direction. In addition, the ROI, which is actually extraluminal and hence not visible within the airway, appears transparently in green. These cues provide unambiguous information on the location of the proper biopsy site.
Figure 7.
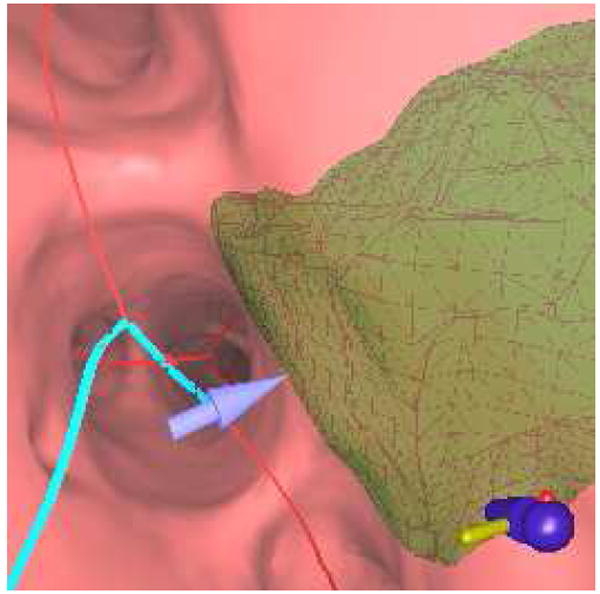
An endoluminal view produced near the end of a route. This view indicates a few of the extra attributes provided by our proposed planning system. The blue line indicates the preplanned route, while a 4-mm blue arrow points toward the center of the green extraluminal ROI. Even though ROI is located outside the airway, the transparent rendering and arrow allow the physician to unambiguously locate the lesion.
We next compare the endoluminal renderings generated by the method of Section 2.3 to bronchoscopic video frames (Figures 8 and 9). The surface renderings correspond well to the observed video in each of the 10 airway-tree generations that comprise the route. A comparison of surfaces generated at generation 7 reveals a marked improvement by the new method over the thresholding-based approach relying on a segmentation-constrained -600 HU isosurface (Figure 10), while Figure 11 gives another example [10, 11]. In fact, in Figure 10 the isosurface produced by the previous method contains black holes that obscure much of the airway. While the outlines of the upcoming trifurcation are visible, a -600HU isosurface does not appropriately capture any of the remaining airways beyond generation 7. This makes proper report generation and guidance to this peripheral ROI impossible. In contrast, the surfaces generated by the new method accurately resemble the observed video for the entire route toward the ROI.
Figure 8.
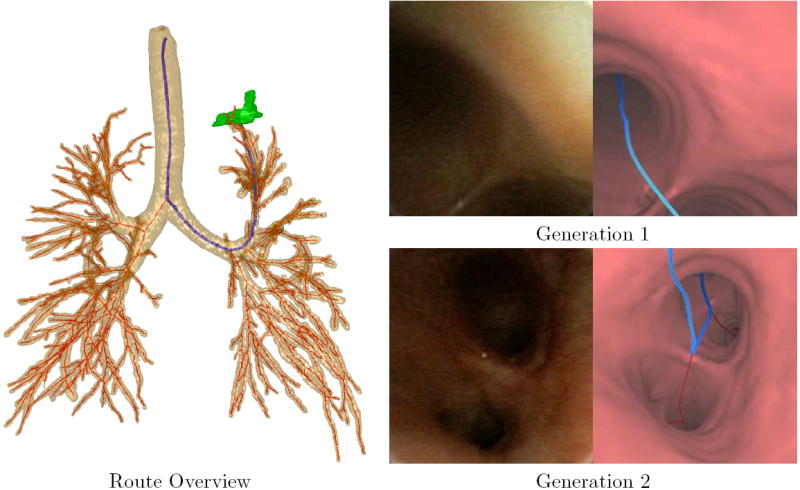
A bronchoscopic route to a peripheral ROI in patient 20349.3.28. The Route Overview shows a global view of the airway tree, centerlines (red), route (blue) and ROI (green, left upper lobe). The views to the right show video frames taken along the route to the ROI (left) and registered endoluminal renderings of airway surfaces derived by the method of Section 2.3 (right). The endoluminal views are taken along the route at generations 1, the trachea, and 2, the left main bronchus.
Figure 9.
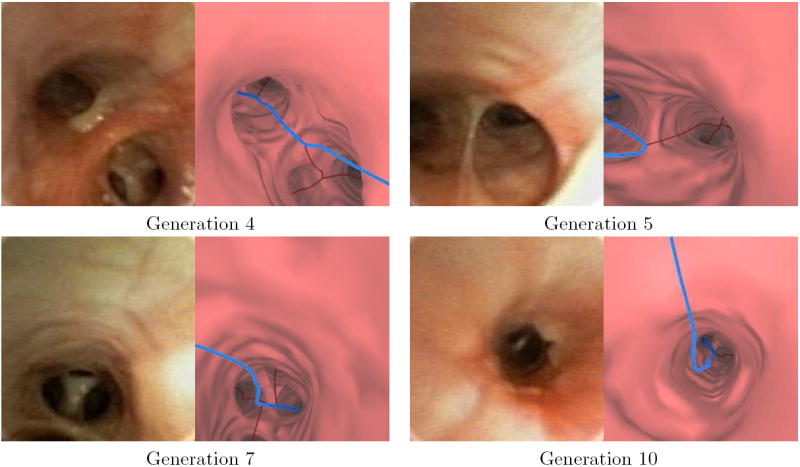
Video frames and the corresponding virtual bronchoscopic views along the remainder of the route depicted in Figure 8.
Figure 10.
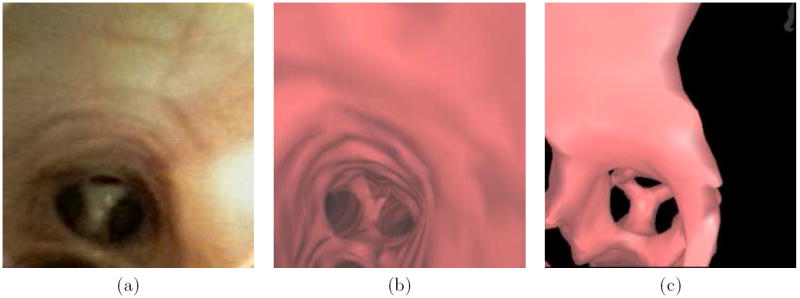
A comparison a bronchoscopic video frame (a) with endoluminal renderings (b) and (c) of patient 20349.3.28 (also used for Figures 8 and 9). The visually-accurate rendering (b) was generated after running through the proposed method of Section 2.3. Part (c) depicts an unacceptable rendering, produced by a previously-proposed surface definition method at the same location as parts (a-b) [10,11,41].
Figure 11.
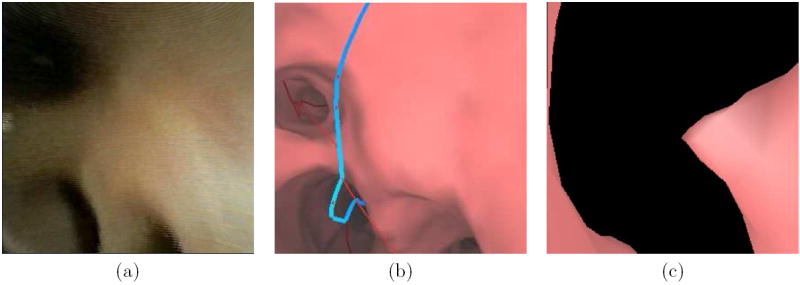
Another comparison a bronchoscopic video frame (a) with endoluminal renderings (b) and (c). This example is from patient 20349.3.24. The rendering (b) was generated after running through the methods incorporated into the proposed system — the rendering is visually accurate. Part (c) depicts an unacceptable rendering, produced by a previously-proposed surface definition method at the same location as parts (a-b) [10,11,41].
Finally, we demonstrate the use of this paper’s methods for follow-on live guidance of bronchoscopy to the periphery. In recent years, our group has undertaken the development of a large system for planning and guiding bronchoscopy. This system has been been described in earlier efforts that focused on central-chest studies [10,11,51]. The system runs on a standard Windows-based PC and interfaces to the bronchoscopy hardware through a Matrox Meteor II video frame grabber. The system has recently undergone improvements to enable successful planning and guidance of bronchoscopy to the periphery [27, 35, 43, 53] — these include the MDCT-based analysis system discussed in this paper.
Figure 12 shows the guidance system in use during a live human peripheral procedure. The image-based registration technique of Merritt et al. aligns the virtual world with the anatomy observed in the live video [35, 43]. During the registration process, the endoluminal and global extraluminal views move in synchrony, giving the physician visual feedback of the bronchosope’s orientation. When the virtual world is aligned with the observed anatomy, the physician can easily determine the airways to follow along the pre-determined route. We have also found it helpful for the physician to direct the technician to move the virtual camera along the route. In this way the physician has control over placement of the virtual camera and can, for instance, preview upcoming route sections. For the example view in Figure 12, the system was able to lead the physician to within 20 mm of the lesion. At the 8th airway-tree generation, the physician then performed a diagnostic brushing. Other results are described in [27].
Figure 12.
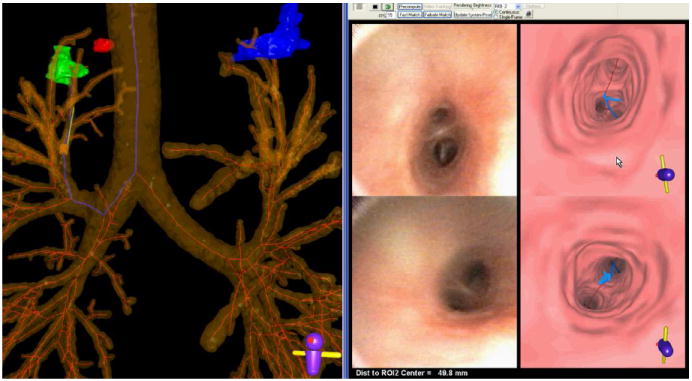
A screen capture of the guidance system during a live procedure (case 20349.3.28). The left portion shows a global view consisting of an extraluminal rendering of the airway tree, centerlines, and three ROIs (red, green, and blue). The blue centerline depicts the computed route for the green ROI. The yellow cylinder and green protruding needle represent the tip of the virtual bronchoscope at the current viewing site of the procedure. The right portion of the screen capture illustrates endoluminal video (left views) and renderings (right views). The top-left endoluminal rendering represents the current viewing site of the system, as indicated by the virtual bronchoscope, with the blue line indicating the route to follow to the ROI. The top-right view shows the live bronchoscopic video feed. The lower left (endoluminal rendering with blue route) and lower right (bronchoscopic video) views represent a “frozen look” of the previously encountered bifurcation passed while the physician maneuvered the bronchoscope along the route. The physician follows the blue line to reach the ROI. Currently, the physician is 49.8 mm from the ROI, as indicated in the bottom right footer. When the physician reaches the vicinity of the ROI, a view similar to that shown in Figure 7 appears.
4 CONCLUSION
With adequate planning, peripheral lesions can be biopsied using ultrathin bronchoscopes [23,24]. The task of planning peripheral bronchoscopic procedures, however, is difficult and time consuming. Our proposed system fills a vital need for efficient planning of bronchoscopy to peripheral diagnostic regions of interest. The tools integrated into the system enable a user to define essentially any ROI semi-automatically, including diffuse masses. The methods for airway-tree segmentation and airway-tree editing allow for complete definition of all potentially visible airways along a route leading to an ROI, while the methods for centerline analysis and route planning enable complete routes which accommodate the characteristics of the bronchoscope.
We have also shown that accurate endoluminal surfaces are vital to the planning and analysis process. Previously proposed methods cannot generate appropriate views for the periphery, either accurately or in a timely manner. Our proposed method addresses this problem. Our method successfully produces endoluminal renderings for all encountered airways leading to a peripheral ROI. In fact, without the method, proper airways would not be definable for many ROIs situated in the periphery. Finally, the quantitative data computed by our system facilitates report generation and follow-on live image-guided bronchoscopy. Nearly all steps in the system are automatic, with less than 15 minutes of technician time typically required to produce a case study.
Most importantly, we have demonstrated the applicability of our system to the planning and subsequent image-based guidance of peripheral bronchoscopic procedures. In a pilot study, we have reached as far as a generation-13 airway. Due to its high level of automation and short computational run times, we have found that the planning system fits smoothly within the clinical work flow. The system’s limits in locating suitable routes are imposed by the resolution and quality of the input 3D MDCT image data. The applicability of the system’s case study to subsequent live guidance of bronchoscopy is limited by the size and maneuverability of the device. As a concluding thought, it is conceivable that other guidance or registration technologies, such as electromagnetic navigation, could also benefit from the planning data produced by our system.
Supplementary Material
Acknowledgments
This work was partially supported by NIH NCI grants CA074325 and CA091534 and by NIH NIBIB grant EB000305. We also wish to thank Drs. Rebecca Bascom, Muhammad Khan, and Syed Gilani of the Penn State Milton S. Hershey Medical Center who provided much of the data for the paper.
Footnotes
Publisher's Disclaimer: This is a PDF file of an unedited manuscript that has been accepted for publication. As a service to our customers we are providing this early version of the manuscript. The manuscript will undergo copyediting, typesetting, and review of the resulting proof before it is published in its final citable form. Please note that during the production process errors may be discovered which could affect the content, and all legal disclaimers that apply to the journal pertain.
References
- 1.Sihoe AD, Yim AP. Lung cancer staging. J Surgical Research. 2004 Mar;117(1):92–106. doi: 10.1016/j.jss.2003.11.006. [DOI] [PubMed] [Google Scholar]
- 2.Jeong YJ, Yi CA, Lee KS. Solitary pulmonary nodules: detection, characterization, and guidance for further diagnostic workup and treatment. AJR Am J Roentgenol. 2007 Jan;188(1):57–68. doi: 10.2214/AJR.05.2131. [DOI] [PubMed] [Google Scholar]
- 3.Wang KP, Mehta A, editors. Flexible Bronchoscopy. Blackwell Science; Cambridge, MA: 1995. [Google Scholar]
- 4.Baaklini W, Reinoso M, Gorin A, Sharafkaneh A, Manian P. Diagnostic yield of fiberoptic bronchoscopy in evaluating solitary pulmonary nodules. Chest. 2000 April;117(4):1049–1054. doi: 10.1378/chest.117.4.1049. [DOI] [PubMed] [Google Scholar]
- 5.Rivera MP, Detterbeck F, Mehta AC. Diagnosis of lung cancer: The guidelines. Chest. 2003;123:129S–136S. doi: 10.1378/chest.123.1_suppl.129s. [DOI] [PubMed] [Google Scholar]
- 6.Dalrymple NC, Prasad SR, Freckleton MW, Chintapalli KN. Introduction to the language of three-dimensional imaging with multidetector CT. Radiographics. 2005 Sept-Oct;25(5):1409–1428. doi: 10.1148/rg.255055044. [DOI] [PubMed] [Google Scholar]
- 7.Osborne D, Vock P, Godwin J, Silverman P. CT identification of bronchopulmonary segments: 50 normal subjects. AJR. 1984 Jan;142(1):47–52. doi: 10.2214/ajr.142.1.47. [DOI] [PubMed] [Google Scholar]
- 8.Dolina MY, Cornish DC, Merritt SA, Rai L, Mahraj R, Higgins WE, Bascom R. Interbronchoscopist variability in endobronchial path selection: A simulation study. Chest. 2008 April;133(4):897–905. doi: 10.1378/chest.07-2540. [DOI] [PubMed] [Google Scholar]
- 9.McAdams HP, Goodman PC, Kussin P. Virtual bronchoscopy for directing transbronchial needle aspiration of hilar and mediastinal lymph nodes: a pilot study. Am J Roentgenology. 1998 May;170(5):1361–1364. doi: 10.2214/ajr.170.5.9574616. [DOI] [PubMed] [Google Scholar]
- 10.Helferty JP, Sherbondy AJ, Kiraly AP, Higgins WE. Computer-based system for the virtual-endoscopic guidance of bronchoscopy. Comput Vis Image Underst. 2007 Oct-Nov;108(12):171–187. doi: 10.1016/j.cviu.2006.10.010. [DOI] [PMC free article] [PubMed] [Google Scholar]
- 11.Higgins WE, Helferty JP, Lu K, Merritt SA, Rai L, Yu K-C. 3D CT-video fusion for image-guided bronchoscopy. Comput Med Imaging Graph. 2008 April;32(3):159–173. doi: 10.1016/j.compmedimag.2007.11.001. [DOI] [PMC free article] [PubMed] [Google Scholar]
- 12.Hopper K, Lucas T, Gleeson K, Stauffer J, Bascom R, Mauger D, Mahraj R. Transbronchial biopsy with virtual CT bronchoscopy and nodal highlighting. Radiology. 2001 Nov;221(2):531–536. doi: 10.1148/radiol.2211001585. [DOI] [PubMed] [Google Scholar]
- 13.Minami H, Ando Y, Nomura F, Sakai S, Shimokata K. Interbronchoscopist variability in the diagnosis of lung cancer by flexible bronchoscopy. Chest. 1994 June;105(2):1658–1662. doi: 10.1378/chest.105.6.1658. [DOI] [PubMed] [Google Scholar]
- 14.Haponik E, Shure D. Underutilization of transbronchial needle aspiration: experiences of current fellows. Chest. 1997 July;112(1):251–253. doi: 10.1378/chest.112.1.251. [DOI] [PubMed] [Google Scholar]
- 15.White CS, Weiner EA, Patel P, Britt EJ. Transbronchial needle aspiration: guidance with CT fluoroscopy. Chest. 2000 Dec;118(6):1630–1638. [PubMed] [Google Scholar]
- 16.Yasufuku K, Nakajima T, Motoori K, Sekine Y, Shibuya K, Hiroshima K, Fujisawa T. Comparison of endobronchial ultrasound, positron emission tomography, and CT for lymph node staging of lung cancer. Chest. 2006 Sept;130(3):710–718. doi: 10.1378/chest.130.3.710. [DOI] [PubMed] [Google Scholar]
- 17.Gildea TR, Mazzone PJ, Karnak D, Meziane M, Mehta AC. Electromagnetic Navigation Diagnostic Bronchoscopy: A Prospective Study. Am J Respir Crit Care Med. 2006;174(9):982–989. doi: 10.1164/rccm.200603-344OC. [DOI] [PMC free article] [PubMed] [Google Scholar]
- 18.Vining DJ, Liu K, Choplin RH, Haponik EF. Relationships of virtual reality endobronchial simulations to actual bronchoscopic findings (preliminary report) Chest. 1996 Feb;109(2):549–553. doi: 10.1378/chest.109.2.549. [DOI] [PubMed] [Google Scholar]
- 19.Higgins WE, Ramaswamy K, Swift R, McLennan G, Hoffman EA. Virtual bronchoscopy for 3D pulmonary image assessment: State of the art and future needs. Radiographics. 1998 May-June;18(3):761–778. doi: 10.1148/radiographics.18.3.9599397. [DOI] [PubMed] [Google Scholar]
- 20.Rogalla P, Van Scheltinga J, Hamm B. Virtual Endoscopy and Related 3D Techniques. Springer-Verlag; Berlin: 2002. [Google Scholar]
- 21.Summers RM. Navigational aids for real-time virtual bronchoscopy. Am J Roentgen. 1997 May;168(5):1165–1170. doi: 10.2214/ajr.168.5.9129406. [DOI] [PubMed] [Google Scholar]
- 22.Asano Fumihiro, Shindoh Joe, Shigemitsu Kikuo, Miya Kiichi, Abe Takashi, Horiba Michiaki, Ishihara Yoichiro. Ultrathin bronchoscopic barium marking with virtual bronchoscopic navigation for fluoroscopy-assisted thoracoscopic surgery. Chest. 2004 Nov;126(5):1687–1693. doi: 10.1378/chest.126.5.1687. [DOI] [PubMed] [Google Scholar]
- 23.Asano F, Matsuno Y, Shinagawa N, Yamazaki K, Suzuki T, Moriya H. A virtual bronchoscopic navigation system for pulmonary peripheral lesions. Chest. 2006 Aug;130(2):559–66. doi: 10.1378/chest.130.2.559. [DOI] [PubMed] [Google Scholar]
- 24.Shinagawa N, Yamazaki K, Onodera Y, Asano F, Ishida T, Moriya H, Nishimura M. Virtual bronchoscopic navigation system shortens the examination time—feasibility study of virtual bronchoscopic navigation system. Lung Cancer. 2007;56(2):201–206. doi: 10.1016/j.lungcan.2006.12.005. [DOI] [PubMed] [Google Scholar]
- 25.Gibbs JD, Graham MW, Yu KC, Higgins WE. Integrated system for planning peripheral bronchoscopic procedures. In: Hu XP, Clough AV, editors. SPIE Medical Imaging 2008: Physiology, Function, and Structure from Medical Images. Vol. 6916. 2008. pp. 69160H–1–69160H–15. [Google Scholar]
- 26.Yu KC, Gibbs JD, Graham MW, Higgins WE. System for the generation and preview of an image-based report for bronchoscopy. J Digit Imaging. 2009 in press. [Google Scholar]
- 27.Graham MW, Gibbs JD, Yu KC, Cornish DC, Khan MS, Bascom R, Higgins WE. Image-guided bronchoscopy for peripheral nodule biopsy: A human feasibility study. Am J Respir Crit Care Med. 2008 April;177(abstracts issue):A893. [Google Scholar]
- 28.Lu K, Higgins WE. Interactive segmentation based on the live wire for 3D CT chest image analysis. Int J Computer Assisted Radiology and Surgery. 2007 Dec;2(34):151–167. [Google Scholar]
- 29.Graham MW, Gibbs JD, Higgins WE. A robust system for human airway tree segmentation. In: Pluim JPW, Reinhardt JM, editors. SPIE Medical Imaging 2008: Image Processing. Vol. 6914. 2008. pp. 69141J–1–69141J–18. [Google Scholar]
- 30.Graham MW, Gibbs JD, Higgins WE. Method for robust definition of peripheral airways. Comput Med Imaging Graph. 2008 under review. [Google Scholar]
- 31.Yu KC, Ritman EL, Higgins WE. 3D model-based vasculature analysis using differential geometry. IEEE Int Symp on Biomedical Imaging. 2004 Apr;1:177–180. [Google Scholar]
- 32.Yu KC, Ritman EL, Higgins WE. System for the analysis and visualization of large 3D anatomical trees. Comput Biol Med. 2007 Dec;37(12):1802–1820. doi: 10.1016/j.compbiomed.2007.06.005. [DOI] [PMC free article] [PubMed] [Google Scholar]
- 33.Gibbs JD, Higgins WE. 3D path planning and extension for endoscopic guidance. In: Cleary KR, Miga MI, editors. SPIE Medical Imaging 2007: Visualization and Image-Guided Procedures. Vol. 6509. 2007. pp. 65091K–1–65091K–13. [Google Scholar]
- 34.Yu KC, Gibbs JD, Graham MW, Bascom R, Higgins WE. Interactive graphical report enables off-line 3D endobronchial route planning prior to bronchoscopy. Am J Respir Crit Care Med. 2008 April;177(abstracts issue):A893. [Google Scholar]
- 35.Merritt SA, Rai L, Gibbs JD, Yu K, Higgins WE. Method for continuous guidance of endoscopy. In: Manduca A, Hu XP, editors. SPIE Medical Imaging 2007: Physiology, Function, and Structure from Medical Images. Vol. 6511. 2007. pp. 65110O–1–65110O–12. [Google Scholar]
- 36.Kiraly AP, Reinhardt JM, Hoffman EA, McLennan G, Higgins WE. Virtual bronchoscopy for quantitative airway analysis. In: Amini A, Manduca A, editors. SPIE Medical Imaging 2005: Physiology, Function, and Structure From Medical Images. Vol. 5746. 2005. pp. 369–383. [Google Scholar]
- 37.Gibbs JD. Ph.D. thesis. The Pennsylvania State University; 2008. Three Dimensional Route Planning for Medical Image Reporting and Endoscopic Guidance. [Google Scholar]
- 38.Mortensen EN, Barrett WA. Interactive segmentation with intelligent scissors. Graphical Models and Image Processing. 1998;60(5):349–384. [Google Scholar]
- 39.Summers RM, Feng DH, Holland SM, Sneller MC, Shelhamer JH. Virtual bronchoscopy: segmentation method for real-time display. Radiology. 1996 Sept;200(3) doi: 10.1148/radiology.200.3.8756944. [DOI] [PubMed] [Google Scholar]
- 40.Mori K, Hasegawa J, Toriwaki J, Anno H, Katada K. A fast rendering method using the tree structure of objects in virtualized bronchus endoscope system. In: Hohne KH, Kikinis R, editors. Visualization in Biomedical Computing. Vol. 1131. LNCS; 1996. pp. 33–42. [Google Scholar]
- 41.Kiraly AP, Higgins WE, Hoffman EA, McLennan G, Reinhardt JM. 3D human airway segmentation methods for virtual bronchoscopy. Academic Radiology. 2002 Oct;9(10):1153–1168. doi: 10.1016/s1076-6332(03)80517-2. [DOI] [PubMed] [Google Scholar]
- 42.Fetita CI, Preteux F, Beigelman-Aubry C, Grenier P. Pulmonary airways: 3-D reconstruction from multislice CT and clinical investigation. IEEE Transactions on Medical Imaging. 2004 November;23(11):1353–1364. doi: 10.1109/TMI.2004.826945. [DOI] [PubMed] [Google Scholar]
- 43.Merritt SA, Rai L, Higgins WE. Real-time CT-video registration for continuous endoscopic guidance. In: Manduca A, Amini AA, editors. SPIE Medical Imaging 2006: Physiology, Function, and Structure from Medical Images. Vol. 6143. 2006. pp. 370–384. [Google Scholar]
- 44.Kalender W. Computed Tomography: Fundamentals, System Technology, Image Quality, Applications. Publicis MCD Verlag; Munich: 2000. [Google Scholar]
- 45.Lorensen WE, Cline HE. Marching cubes: A high resolution 3D surface construction algorithm. Computer Graphics. 1987 Jul;21(4):163–169. [Google Scholar]
- 46.Helferty JP, Higgins WE. Technique for registering 3D virtual CT images to endoscopic video. IEEE Int Conf Image Processing. 2001 Oct 7-10;II:893–896. [Google Scholar]
- 47.Li K, Wu X, Chen DZ, Sonka M. Optimal surface segmentation in volumetric images - a graph-theoretic approach. IEEE Trans Pattern Anal Mach Intell. 2006 Jan;28(1):119–134. doi: 10.1109/TPAMI.2006.19. [DOI] [PMC free article] [PubMed] [Google Scholar]
- 48.Saragaglia A, Fetita C, Brillet PY, Prêteux F, Grenier PA. Airway wall thickness assessment: a new functionality in virtual bronchoscopy investigation. In: Armando Manduca, Hu Xiaoping P., editors. SPIE Medical Imaging 2007: Physiology, Function, and Structure from Medical Images. Vol. 6511. 2007. pp. 65110P–1–65110P–12. [Google Scholar]
- 49.Simonyants L, Gibbs JD, Higgins WE, Bascom R. Virtual navigation system (VNS) chest computerized tomography (CT) repository for training in bronchoscopy pathway selection. Am J Respir Crit Care Med. 2008 April;177(abstracts issue):A554. [Google Scholar]
- 50.Lu K, Merritt SA, Higgins WE. Extraction and visualization of the central chest lymph-node stations. In: Giger ML, Karssemeijer N, editors. SPIE Medical Imaging 2008: Computer-Aided Diagnosis. Vol. 6915. 2008. pp. 69151B–1–69151B–15. [Google Scholar]
- 51.Higgins WE, Merritt SA, Gibbs JD, Graham MW, Lu K, Rai L, Yu K-C, Cornish DC, Dolina MY, Mahraj RP, Toth JW, Tucakovic M, Bascom R. Virtual navigation system for bronchoscopic sampling of central chest lymph nodes: a human feasibility study. Am J Respiratory Crit Care Med. 2007;175(abstracts issue):A814. [Google Scholar]
- 52.Higgins WE, Merritt SA, Yu KC, Patel V, Bascom R, Cornish D, Gibbs J, Rai L. Real-time image-guided bronchoscopy for peripheral lesion biopsy: a phantom study. Radiologic Society of N America. 2007:741. [Google Scholar]
- 53.Merritt SA, Gibbs JD, Yu KC, Patel V, Rai L, Cornish DC, Bascom R, Higgins WE. Real-time image-guided bronchoscopy for peripheral lung lesions: A phantom study. Chest. 2008 Nov;134(5):1017–1026. doi: 10.1378/chest.08-0603. [DOI] [PubMed] [Google Scholar]
Associated Data
This section collects any data citations, data availability statements, or supplementary materials included in this article.


