Abstract
It is commonly understood that scattered radiation in x-ray computed tomography (CT) degrades the reconstructed image. As a precursor to developing scatter compensation methods, it is important to characterize this scatter using both empirical measurements and Monte Carlo simulations. Previous studies characterizing scatter using both experimental measurements and Monte Carlo simulations have been reported in diagnostic radiology and conventional mammography. The emerging technology of cone-beam CT breast imaging (CTBI) differs significantly from conventional mammography in the breast shape and imaging geometry, aspects that are important factors impacting the measured scatter. This study used a bench-top cone-beam CTBI system with an indirect flat-panel detector. A cylindrical phantom with equivalent composition of 50% fibroglandular and 50% adipose tissues was used, and scatter distributions were measured by beam stop and aperture methods. The GEANT4-based simulation package GATE was used to model x-ray photon interactions in the phantom and detector. Scatter to primary ratio (SPR) measurements using both the beam stop and aperture methods were consistent within 5% after subtraction of nonbreast scatter contributions and agree with the low energy electromagnetic model simulation in GATE. The validated simulation model was used to characterize the SPR in different CTBI conditions. In addition, a realistic, digital breast phantom was simulated to determine the characteristics of various scatter components that cannot be separated in measurements. The simulation showed that the scatter distribution from multiple Compton and Rayleigh scatterings, as well as from the single Compton scattering, has predominantly low-frequency characteristics. The single Rayleigh scatter was observed to be the primary contribution to the spatially variant scatter component.
Keywords: scatter, breast, cone-beam CT, Monte Carlo, simulation
INTRODUCTION
Cone-beam computed tomography (CT) has been undergoing rapid development due to the advent of digital flat-panel detectors. Dedicated cone-beam CT breast imaging (CTBI) is an emerging imaging technology that may provide better detection and diagnosis of early stage breast cancer.1, 2, 3 However, previous studies4, 5, 6 have shown that a relatively large scatter to primary ratio in the cone-beam geometry can degrade reconstructed image quality. The issue of how to control and reduce scattered radiation in cone-beam CTBI remains a big challenge. The GEANT4-based Monte Carlo simulation package GATE (Ref. 7) has been successful in the application of PET and SPECT with its precise modeling of various physics processes. Other advantages of the GATE software are that it is publicly available, free of cost, and actively maintained by an international collaboration with close relation to the GEANT4 team. A detailed description of the physics models provided by GEANT4 can be found in the Appendix of this article. However, little has been reported concerning the GATE application in x-ray CT. Our group has been investigating cone-beam CTBI and reported8 preliminary studies using GATE Monte Carlo simulations.
In this work, we empirically measured scattered radiation in a cylindrical breast phantom and compared the measurements with the GATE simulation results. A method was developed to differentiate the scatter contribution in the breast from background, which is similar to an approach first proposed by Yaffe et al.9 many years ago. The purpose was to first validate the GATE Monte Carlo simulations for scattered radiation in cone-beam CTBI. The validated GATE simulation package was then used to characterize the scatter to primary ratio for a range of x-ray energy spectra, varying isocenter to detector distances, and various breast size and density. Simulation was also conducted to investigate scatter from a realistic, voxelized breast phantom in order to determine the characteristics of various scatter components which cannot be separated in measurements.
METHODS AND MATERIALS
Cone-beam CT breast imaging system
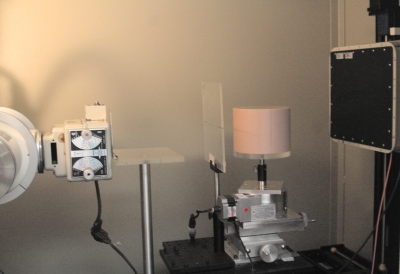
Dedicated cone-beam CTBI systems that have been proposed1, 2, 3, 10, 11 consist of an x-ray tube and flat-panel detector rotating around the examined breast. In our bench-top laboratory system, we equivalently rotate the object phantom and keep the x-ray tube and detector stationary (Fig. 1). The x-ray tube (RAD-94, Varian Medical System, Mountain View, CA) operates from 40 to 150 kVp with a rotating 14° tungsten target and a small focal spot of 0.4 mm. The nominal inherent filtration is 0.5 mm of aluminum equivalent thickness. A lead collimator is located adjacent to the x-ray beam window and can be used to adjust the cone-beam angle. An aluminum filter (either 5.0 mm for below 60 kVp or 6.0 mm) is placed in the x-ray field in order to harden the generated x-ray spectrum. The x-ray energy spectra for different kVp settings can be estimated using the TASMIP algorithm developed by Boone and Seibert12 based on data measured two decades ago. An indirect flat-panel detector (PaxScan 2520 Rev C, Varian Medical Systems, Mountain View, CA) is used for the cone-beam CT imager. The detector features a sensitive area of 195×244 mm2 with a 0.6 mm thick CsI(Tl) scintillator plate. The front of the scintillator plate is shielded by a thin blackened cover. The material of the cover is unknown, possibly a 1 mm thick plastic. An amorphous silicon array of 1536×1920 with a pitch of 0.127 mm in both directions is adjacent to the back of the scintillator plate. Therefore, a pixel matrix of 1536×1920 can be obtained for one projection in full resolution mode. The central x-ray is perpendicular to the detector plane and the source-to-detector distance was 86 cm.
Figure 1.
The bench-top cone-beam CT breast imaging system using an indirect flat-panel detector.
Breast phantom
In CTBI, the breast is imaged in a pendant position without compression. The physical breast phantom used in this study is a cylinder with a radius of 70 mm and a height of 105 mm. Its composition is epoxy plastic with x-ray absorption and scattering properties equivalent to a tissue composition of 50% fibroglandular and 50% adipose tissue. The central axis of the cylinder is parallel to the detector plane. The distance between the phantom axis and the detector is defined as the air gap. The air gap in this experiment was 28 cm and thus the magnification of the object was about 1.5 in an optimal range. These experimental conditions are comparable to those in other experiments13 or simulations.14
Scatter measurements
The scatter to primary ratio (SPR) can be measured using both the beam stop and aperture methods.15 In the beam stop method, a lead disk or a lead strip is positioned between the x-ray tube and the phantom to stop a primary beam from reaching the phantom so that the counts in the corresponding detector pixels are considered mainly from scattered radiation. On the other hand, a hole or a gap in a lead sheet allows only a narrow beam incident into the phantom, significantly reducing the detected scattered radiation. Therefore the scatter component can be obtained by subtracting this primary component from a total radiation component (without any tools between the x-ray and the phantom). The lead disk or hole can be used to estimate the point spread function of the scatter while scatter line profiles can be measured using the lead strip or gap. In our study we used both the lead strip and gap to compare consistency between different measurement methods. Figure 2 shows the scatter measurement tools used in our study. The lead strip shown in the left is 200 mm long, 2 mm wide, and 1.6 mm thick. The same size gap is in a 200×200×1.6 mm3 lead sheet as shown in the right of Fig. 2. Note that the lead gap is eventually formed by two pieces of lead sheet which are held together by two transparent plastic sheets each with the thickness of 1 mm.
Figure 2.
The tools used for scatter line profile measurements. The left is for beam stop method and the right for aperture method.
The measured total (i.e., primary plus scatter) radiation projection image is the same for both the beam stop and aperture methods for estimating scatter to primary ratio (SPR) profiles. Every projection image was recorded after gain and flat-field correction. One hundred images were acquired and averaged representing the total (without any scatter measurement tool), scatter (with the lead strip tool), and primary (with the lead gap tool) projection data. The scatter measurement tools were positioned so that the observed horizontal line profiles were located approximately in the middle of the phantom. The values of scatter or primary radiation were determined by local minima or maxima on each column of the averaged scatter or primary projection images. The total radiation values used to calculate the SPR were chosen in corresponding scatter (beam stop method) or primary (aperture method) horizontal line locations.
A method to differentiate scattered radiation in the phantom from background
As we have previously reported,16 the discrepancy observed between the measured and simulated scattered radiations suggests the existence of external scatter sources other than the studied object. Possible external scatter sources include the x-ray unit (tube and collimator), x-ray filter, and detector (cover and crystal).17, 18 A method, which is similar to that first proposed by Yaffe et al.9 and applied by Fahrig et al.,19 was used to differentiate the scattered radiation occurring in the studied object from the external background.17 First, we measured the total and scattered radiations with the usual approach using either the beam stop or the aperture methods when the object was placed within the field of view. We have
| (1) |
and
| (2) |
Then we removed the object from the field of view, keeping all other conditions unchanged. The measurement of scattered radiation in this condition should constitute pure background,
| (3) |
Thus the background SPR can be obtained as
| (4) |
The background scattered radiation component in the object, , was derived by the primary radiation in the object scaled with the background SPR and can be subtracted from the above measurement to give the scatter in the object
| (5) |
Thus, the object SPR, defined as the ratio of scattered radiation in the object (and incident on the detector) to the primary radiation incident on the detector, can be obtained as
| (6) |
where
| (7) |
From the above equations, we can see that only four measured quantities are required to derive the object SPR. In fact, the beam stop method directly measures the scatter while the aperture method directly measures the primary; therefore, we have
| (8) |
for the beam stop method and
| (9) |
for the aperture method.
Monte Carlo simulation
The GATE (GEANT4 application for tomographic emission) Monte Carlo simulation package7 is used to generate photons of varying energies and simulate their transport within different materials. GEANT4 provides three models for photon interactions: Standard, low Energy, and PENELOPE, which are all relevant in modeling x-ray medical imaging applications. We have conducted a model comparison for the GATE program and documented this in the Appendix. The more accurate low energy electromagnetic model was chosen for use in the Monte Carlo simulation studies described here. In the GATE simulation of x-ray photons, every interaction process including the Compton and Rayleigh scatterings was labeled and the number of times that a photon undergoes the Compton or Rayleigh scatterings within the phantom or detector was counted, providing a means to separate the single or multiple incoherent or coherent scatterings.
The simulated phantom was the same size, shape, and composition as the physical breast phantom used in the experimental measurements. The elemental compositions and densities of the fibroglandular and adipose tissues as measured by Hammerstein et al.20 were used. The densities of fibroglandular and adipose tissues were 1.04 and 0.93 g∕cm3, respectively. The density of a mixture of those two tissues in the breast can be calculated accordingly with their relative percentage.
To model x-ray tube emission with a focal spot of 0.4 mm, simulated photons were emitted isotropically from a sphere with the radius of 0.2 mm within a cone angle of 12.3° so as to expose the entire phantom. The emitted photons can traverse the phantom and reach the 0.6 mm thick CsI scintillator plate if they do not stop within the phantom by undergoing a photoelectric interaction there. Production and transport of scintillation light in the crystal were not modeled. The photons deposited in the detector were recorded and separated by primary (defined as those that did not undergo any scattering within the phantom) and scatter (defined as those encountering at least one Compton or Rayleigh scattering in the phantom). All deposited energies of the primary or the scatter photons were then summed into 1×1 mm2 pixels to form corresponding images. Since we did not model the production and collection of scintillation light in the detector, a scaling applied to the simulated image is necessary in order to relatively compare the simulated and measured images. This scaling procedure assumes good energy linearity of the flat-panel detector, which is generally observed to be true.21
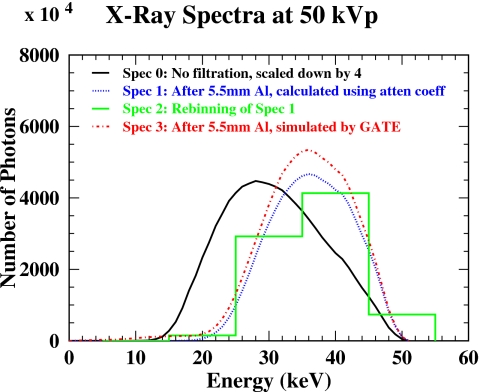
The final primary and scatter images for a given x-ray kVp setting were obtained by summing the individual images generated at each energy according to the desired x-ray spectrum. The scatter to primary ratio image or total (primary plus scatter) image can thus be obtained. A typical x-ray energy spectrum for a tungsten target at 50 kVp is shown in Fig. 3. The curves show relative intensity in 1 keV intervals. Spectrum 0 was generated by the TASMIP algorithm12 as no filtration was involved. Spectrum 1 was then recalculated to include 5.5 mm Al filter absorption using known aluminum attenuation coefficients at different x-ray energies.22 Histogramed spectrum 2 was the rebinning of spectrum 1 in 10 keV energy intervals. Spectrum 3 was collected after the simulated photons (according to spectrum 0) were transmitted through the 5.5 mm thick aluminum by the GATE Monte Carlo simulation. This simulation included both the primary and scattered radiations in the filter. The collected primary photon energy spectrum matches well with analytically calculated spectrum 1. About 15% more photons at the peak of 35 keV and 17% more photons over the whole energy range were observed for spectrum 3 compared to spectrum 1, which can be attributed to the scatter production in the 5.5 mm thick aluminum filter.
Figure 3.
The x-ray spectra for tungsten target at 50 kVp. The curves show relative intensity in 1 keV intervals. Spectrum 0 was generated by the TASMIP algorithm as no filtration was involved. Spectrum 1 was then recalculated to include 5.5 mm Al filter absorption using known aluminum attenuation coefficients at different x-ray energies. Spectrum 2 is the rebinning of spectrum 1 in 10 keV energy intervals. Spectrum 3 was collected after the simulated photons (according to spectrum 0) were transmitted through the 5.5 mm thick aluminum by the GATE Monte Carlo simulation.
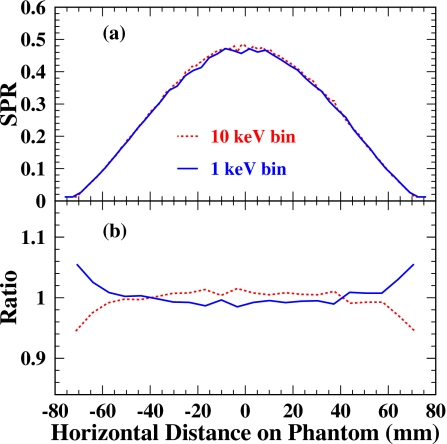
Spectra 1 and 2 in Fig. 3 can be used with two different simulation strategies: (1) Generating photons in 1 keV energy intervals according to the weighting of spectrum 1 and then simply summing them or (2) generating an equal number of photons at 20,30,40,50,… keV and then summing them according to the weighting of spectrum 2. An advantage of method (2) is that with the same statistics study can be extended to a broader kVp range. However, for readers who seek more accurate results at the cost of longer computation times, method (1) is recommended. Method (2) is based on an assumption that simulation at a larger interval such as 10 keV would give accurate enough results like at 1 keV interval. Such a comparison was made at 50 kVp for the primary to scatter ratio line profile in the cylindrical phantom and shown in Fig. 4. The solid and dotted curves are the SPRs by methods (1) and (2), respectively. Direct comparison is shown in Fig. 4a while their ratios to the average of both SPRs are shown in Fig. 4b. The agreement within 4% was observed except near the end points where the larger difference may be due to different rebinning strategies used in obtaining profiles. In this study we used method (1) (i.e., 1 keV interval) although the observed 4% difference between the methods is acceptably small compared to statistical and systematic uncertainties.
Figure 4.
Comparison of the SPR line profiles by two simulation strategies. The solid curve is the SPR integrated according to spectrum 1 in Fig. 3 by generating 1 keV energy different photons with relative numbers. The dotted curve is the SPR weighted and summed according to spectrum 2 in Fig. 3 by generating an equal number of photons at 20, 30, 40, and 50 keV: (a) Direct comparison; (b) ratios to the average of both SPRs. The agreement within 4% was observed except for at the end points where the larger difference may be due to different rebinning strategies used in obtaining profiles.
The GATE simulations were performed on a Linux cluster computer. The cluster has 173 dual CPU slave nodes. Each node has at least 1 Gbyte memory. The processors on each node are AMD Opteron 240s with a clock speed of 1.4 GHz. Each CPU performed a part of the simulation for one discrete energy.
RESULTS
Validation of the GATE simulation
Profile comparison of direct measurements and simulation
In order to effectively compare the results from different models as well as from different measurements, we chose (i) to compare only central line profiles along the horizontal direction in the projection image, which reflect the thickness change in the phantom, and (ii) to scale down the image obtained in the detector to the isocenter position of the phantom by the magnification factor, letting the relative comparison between different experimental settings (such as source-to-detector distance, air gap) become more prominent. That is to say, if the phantom is the same, similar profile shape and edges should be observed at the same scale in the object plane since the studied primary and scattered radiations occurred within the same object. Unless clearly stated, the following results are for 50 kVp in both measurements and simulations.
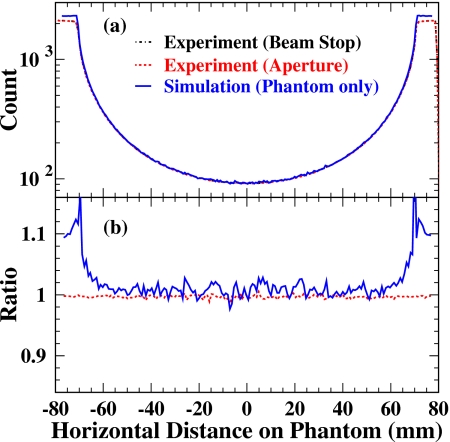
Shown in Fig. 5 is the total radiation profile comparison between the measurements and the simulation. Note that the total radiation profiles shown for both the beam stop and aperture methods are actually the same (obtained without any scatter measurement tool). The simulation was done by emulating the cylindrical phantom only and recorded in the CsI scintillator plate. Spectrum 1 in Fig. 3 was used. The simulated total radiation profile was scaled to that of the measured profile at the center position for relative comparison. The direct shape comparison is shown in Fig. 5a while the ratios to the measured total radiation by the beam stop method are shown in Fig. 5b. Similar profile shapes of the measurements and the simulation in the cylindrical phantom region indicate that the simulation of the photoelectric process, which is the dominant interaction in the studied x-ray energy range and determines the shape of the total radiation profile, is satisfactory.
Figure 5.
Total radiation profile shape comparison of the experiments and the simulations: (a) Direct comparison; (b) ratios to the measured total radiation by the beam stop method. Simulated total radiation is scaled to the measured profile at the center position. The agreement between the shapes of measured and simulated profiles in the cylindrical phantom region indicates that the simulation of photoelectric interactions is satisfactory.
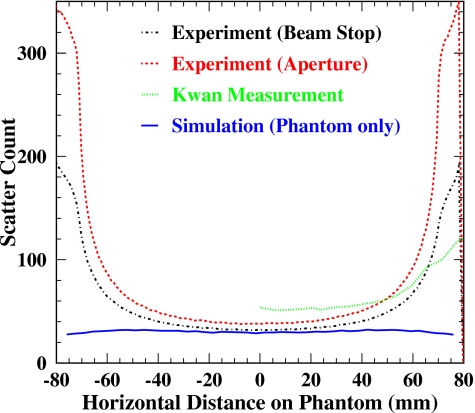
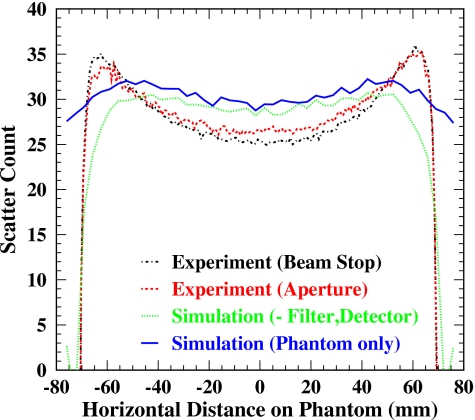
Figure 6 compares the scattered radiation profiles of the direct measurements (without background subtraction) by the two methods and the simulation. Simulated scatter was scaled by applying the scaling factor obtained in the total radiation comparison. Here the scattered radiation includes both the incoherent and coherent scatterings that are indistinguishable in experiment. Also shown in Fig. 6 for comparison is the measurement of Kwan et al. at 80 kVp for the same phantom, which was taken from Fig. 2 of their paper13 and scaled in magnitude down by 4 and in the horizontal location down by the magnification of 1.68. Large discrepancies toward both edges of the cylinder phantom between the measurements and simulation suggest that a large scatter component may come from sources other than the phantom.
Figure 6.
Scatter (including both Compton and Rayleigh scatter) profiles obtained by experimental measurements and simulation. Simulated scatter was scaled by applying the scaling factor obtained in the total radiation comparison. Kwan et al. measurement at 80 kVp was scaled down by 4 and shown for comparison. Large discrepancies toward both edges of cylindrical phantom between the measurements and simulation suggest that a large scatter component may arise from sources other than the phantom.
Investigation of background scatter sources in experiment
In general, any scattering material positioned in the x-ray transmission path would contribute to the observed scatter. In CTBI, x-ray photons are first generated in the x-ray tube and then transmitted through the collimator, filter, object phantom, FPD cover, and scintillator. Absorbed x rays are then converted to optical photons which are finally received by the pixelized amorphous silicon array. In a realistic Monte Carlo simulation all of these components should be modeled since they are present during a clinical acquisition as pointed out by Sechopoulos et al.18 Sometimes it is difficult or impossible in a Monte Carlo simulation program to accurately emulate all aspects of the physical detection system because (i) the exact elemental composition of materials and geometric parameters for some parts are unknown and (ii) it is computationally intensive and nearly infeasible. To simplify the Monte Carlo simulation and to evaluate the most important scatter contributions, we have modeled the filter, phantom, detector cover, and scintillator together and separately. The inherent filtration (0.5 mm Al equivalent) of the x-ray tube was modeled and included in a 5.5 mm thick Al filter. The collimator lead slot was considered thick enough to stop x-ray photons and was not included in our simulation. The exact composition of the detector cover was unknown; however it was modeled as a plate of 1 mm thick plastic according to information provided by the vendor of the FPD detector.
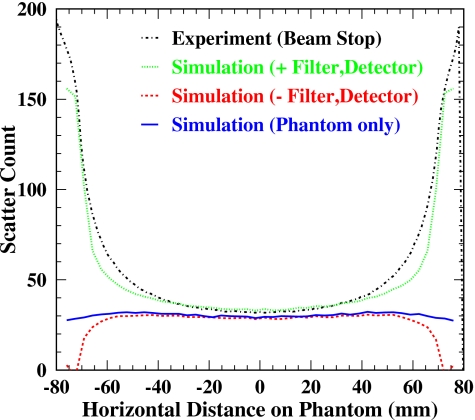
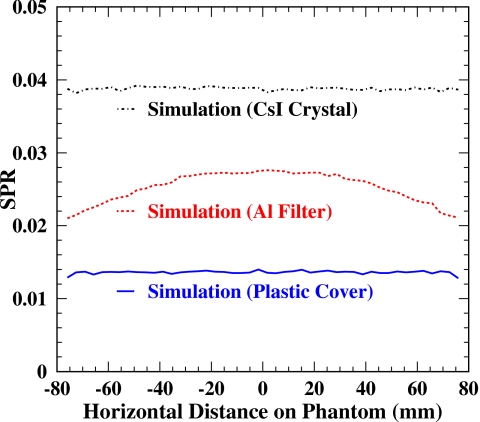
The simulated scatter profile, generated by modeling the 5.5 mm thick aluminum filter, the cylindrical phantom, the 1 mm thick plastic cover, and the 0.6 mm thick CsI scintillator is shown in Fig. 7 as a dotted curve. Compared to the measured scatter obtained with the beam stop method shown in Fig. 7 as a dot-dashed curve, both profiles show similar shape and magnitude. Shown in Fig. 8 are SPR profiles from scatter contributions within the 5.5 mm thick aluminum filter, within the 1 mm thick plastic detector cover, and within the 0.6 mm thick CsI crystal of the detector. The shape of the SPR profile for the filter reflects the change of geometric paths for cone-beam x-ray photons. Considering all three SPRs as originating from the background and using Eq. 5, we can derive the scatter in the phantom from the all-inclusive simulation (the dotted curve in Fig. 7) and plot it in Fig. 7 as a dashed curve. This profile matches well with the phantom-only simulation (the solid curve in Fig. 7) except for near the edges of the phantom where the edge effect may play an important role. Our simulation study demonstrates that the background subtraction method described in Sec. 2D is effective.
Figure 7.
Scatter profiles obtained by the beam stop measurement and various simulations. Simulated scatter including contributions from the aluminum filter, the plastic cover, and CsI crystal of the detector demonstrated the similar shape as the measured scatter. The simulated scatter after the background scatter subtraction agrees well with the scatter simulated from the phantom-only except near the edges of the phantom.
Figure 8.
SPR profiles simulated in the 5.5 mm thick aluminum filter, the 1 mm thick plastic cover, and 0.6 mm thick CsI crystal of the detector. The shape in the SPR profile for the filter reflects the change of geometric paths for cone-beam x-ray photons.
Measurement and subtraction of background scatter
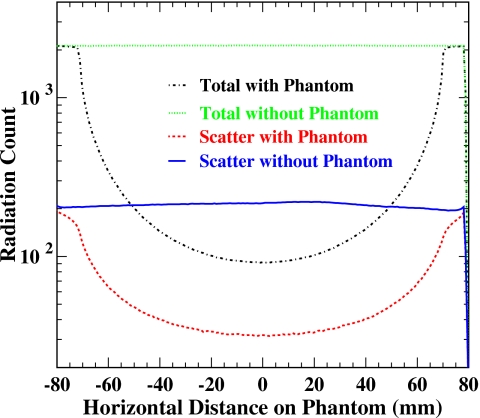
In order to derive the measured scatter contribution from the phantom alone, we followed the method described in Sec. 2D. First we measured the total and scattered (with one scatter measurement tool, either the lead strip or lead gap) radiations when the phantom was in the field of view as usual. Results of the total and scattered radiations for the beam stop method are shown in Fig. 9 as dot-dashed and dashed curves. Next we removed the phantom from the field of view and measured the total and scattered (with the same scatter measurement tool) radiations as shown in Fig. 9 as dotted and solid curves. The total radiation without the phantom was uniform as it was a flood image.
Figure 9.
Total and scattered radiation profiles measured with and without the phantom. Shown are for the beam stop method only.
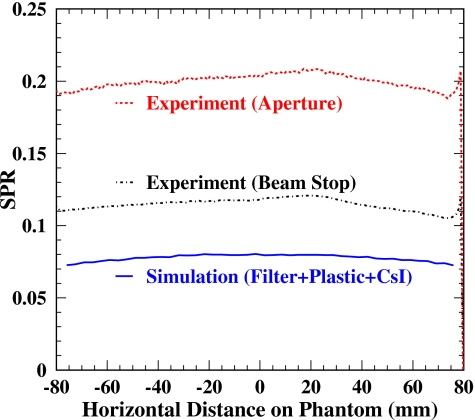
The measured background SPRs for both the beam stop and aperture methods are shown in Fig. 10 as dot-dashed and dashed curves. Both shapes are similar but the magnitude for the aperture method is systematically larger than that for the beam stop method. This is because the directly measured primary by the aperture method is smaller than actual primary due to (i) the 2 mm transparent plastic used in the lead gap tool which would reduce primary and (ii) the detector cover and scintillator plates which would induce more scatters, therefore further reducing detected primary. Also shown in Fig. 10 as a solid curve is the simulated background SPR, which is the summation of three SPRs in Fig. 8. A smaller simulated SPR compared to the measured background SPR indicates that the three simulated background sources cannot fully account for actual background scatter.
Figure 10.
Measured and simulated background SPR profiles. The solid curve is the sum of the simulations of three background sources shown in Fig. 8.
By applying Eq. 5, the measured scatter within the phantom is computed for the two measurement methods. Figure 11 shows a comparison of the experimentally measured scatter profiles (after correcting for background scatter) with the simulated profiles. It is observed that the relative difference of the measured scatter distributions between the two methods is about 5% after the background subtraction while it is larger than 30% before (Fig. 6). It is evident that large discrepancies toward both of the edges as seen in Fig. 6 are significantly reduced after background scatter subtraction.
Figure 11.
Relative scatter profile comparison of the experiments after background scatter subtraction with the simulations. The solid curve is the simulation for the phantom only while the dotted curve is the simulation including and then subtracting of three background contributions.
Scatter to primary ratio comparison
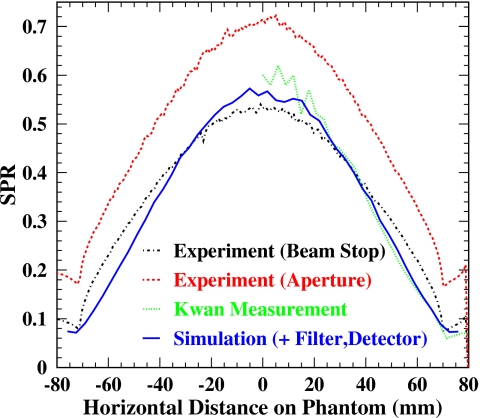
A more precise comparison of the measurements with the simulations can be obtained by comparing the scatter to primary ratio (SPR) since the arbitrary scaling factor would be canceled out in obtaining this ratio. We plot and compare the SPRs of the measurements directly from the two methods and the simulation including the 5.5 mm Al filter, 1 mm plastic cover, and 0.6 mm CsI scintillator in Fig. 12. Also shown is the measurement of Kwan et al. at 40 kVp for the same phantom, and again the horizontal location was rescaled. Similar shape and magnitude are observed for the measurement by the beam stop method, the simulation including background sources, and the measurement of Kwan et al. The SPRs from the aperture method are systematically larger than those from the beam stop method, which we attribute to the deficit of directly measured primary in the aperture method.
Figure 12.
SPR comparison of the experiments (without background scatter subtraction) and the GATE simulation (with the filter, plastic cover, and crystal of the detector). Also shown is the measurement of Kwan et al. at 40 kVp.
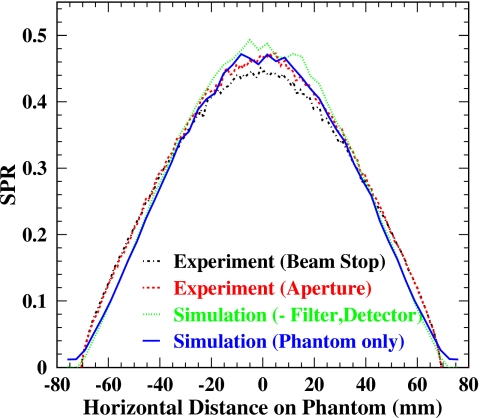
Figure 13 shows a comparison of the measured SPRs after background scatter subtraction with the simulations. At the center, the background subtracted simulation agrees with the phantom-only simulation within 5% and both measurements also agree with the phantom-only simulation within 5%. In addition, measurements were consistent within 5% over the phantom present range, resulting in a significant improvement (from 30% to 5%) in agreement for the two different measurement methods, as the scatter contribution from the phantom should be the same. This may be because the subtraction procedure cancels out a large bias caused by the measurement methods, especially the aperture method.
Figure 13.
SPR profile comparison of the experiments after background scatter subtraction with the simulation results. At the center, both measurements are consistent within 5%, and the background subtracted simulation agrees with the phantom-only simulation within 5%. Both measurements also agree with the phantom-only simulation within 5%.
Characterization of the scatter to primary ratio
Spectral dependence
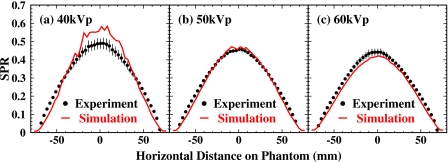
Spectral dependence of the SPR was studied by measuring scatter to primary ratios for different x-ray kVp settings. In this experiment, the x-ray energy setting was changed from 50 to 40 or 60 kVp and the acquisition and analysis procedure was repeated. Previous reports have suggested that the x-ray spectral energy range of 40–60 kVp is considered optimal for cone-beam CT breast imaging.23
The SPRs were averaged from the two measurements by the beam stop and aperture methods after background scatter subtraction and plotted as solid circles in Fig. 14. The error bars are differences between the two measurements, demonstrating the systematic uncertainty of the experimental measurement. The simulation results for the phantom-only are shown as solid curves. Good agreement between the measurements and simulations is observed for 50 and 60 kVp x rays. At 40 kVp, the relatively large discrepancy between the measurement and the GATE simulation may be due to (i) a larger systematic measurement uncertainty and (ii) a larger x-ray spectrum uncertainty in the TASMIP algorithm because there exist limited and less accurate data for x-ray energies below 40 keV used in derivation of the spectrum.12
Figure 14.
Spectral dependence of the SPR from the measurements and the GATE simulations at 40, 50, and 60 kVp. Solid circles and their associated error bars are average values and differences of the measured SPRs by the beam stop and aperture methods after background scatter subtraction. Solid curves are the simulated SPRs for the phantom only.
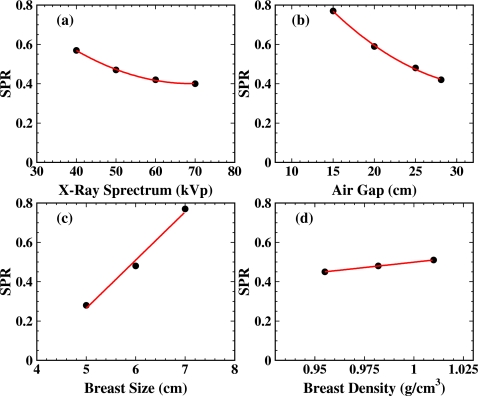
We plot simulated SPR at the center of the phantom where the maximum value was achieved as a function of x-ray spectrum in Fig. 15a, where the 70 kVp point was taken from our previous study.8 Result of a second order polynomial fit to the data points is plotted as a solid curve and given as
| (10) |
Figure 15.
Simulated SPRs as a function of (a) x-ray spectrum, (b) air gap, (c) breast size (radius), and (d) breast density. Solid circles are simulation data points. Solid curves are second order polynomial [(a) and (b)] and linear [(c) and (d)] fits to the data.
The observed trend that the SPR decreases when x-ray kVp increases below 60 kVp and flattens out above 60 kVp is consistent with the observation of Kwan et al.13
Effect of the air gap, breast size, and composition
The effect of the air gap, breast size, and composition on the SPR was studied and reported previously by our group using the same low energy model in the GATE simulation.8 There the breast size was characterized by the radius of the cylindrical phantom. Simulations were conducted for a 6 cm breast phantom with a composition of 50% fibroglandular and 50% adipose tissues at 60 kVp with three different air gaps of 15, 20, and 25 cm. Also studied were three different breast sizes at 5, 6, and 7 cm for the 50%∕50% breast composition and three different breast compositions at 25%∕75%, 50%∕50%, and 75%∕25% for the 6 cm breast at 60 kVp with the air gap of 15 cm. We have converted relative breast composition into respective breast density, which is a more understandable quantitative clinical measure. The maximum SPRs were taken at the center of the presented profiles. Together with the point at the air gap of 28 cm in this study for the 7 cm breast phantom at 50 kVp after scaling to 6 cm and 60 kVp, we plot the SPR as a function of air gap (D) in Fig. 15b, of breast size (R) in Fig. 15c, and breast density (ρ) in Fig. 15d. Solid circles are simulation data points. Solid curves are second order polynomial (b) and linear [(c) and (d)] fits to the data. The fits give
| (11) |
| (12) |
| (13) |
It is observed from Fig. 15 that (i) a good linear relationship exists between the SPR and the breast size or density for the range of breast size and density that were simulated and (ii) the breast size and air gap are two of the most important factors affecting the SPR: The larger the breast and the smaller the air gap, the larger the resulting SPR. In principle, for any given CTBI system setting, the maximum SPR can be estimated using Eqs. 10, 11, 12, 13.
Characterization of different scatter components in a realistic breast phantom
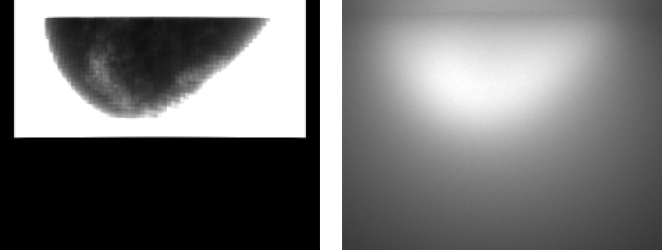
Unlike estimates of experimentally measured scatter distributions, different scatter components can be separated in Monte Carlo simulation to reveal distribution characteristics of each component such as single Compton and single Rayleigh scatterings. To simulate a more realistic breast model, a voxelized digital breast phantom was developed and its detailed description can be found elsewhere.24 Briefly, under institutional review board (IRB) approval, a fresh mastectomy specimen was obtained immediately following surgery prior to tissue gross pathology. The specimen was placed in a holder and imaged using the same CTBI system as that in this study. The reconstructed CT data were postprocessed and segmented into a breast object model. The digital object model specifies tissue as a fraction of adipose tissue and has a pixel size of 0.254 mm. A central cross section view of this digital breast phantom is shown in Fig. 16, in which the white part represents fibroglandular tissue while the black part represents adipose tissue.
Figure 16.
A central cross section view of the voxelized, realistic breast phantom developed from breast specimen. The fibroglandular and adipose tissues are shown by white and black pixels.
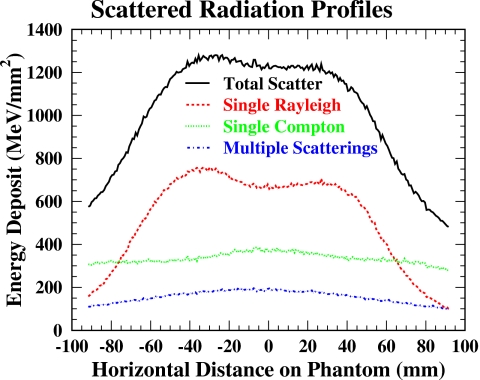
In simulation, the 3D digital breast phantom was positioned 1 cm under the central beam of cone-beam x rays to emulate the pendant geometry of a clinical CTBI system. The cone-beam was readjusted to just cover the entire breast region. The simulated detector pixel was 1 mm2. A total of 50×109 x-ray photons were generated. The simulated primary projection image shown on the left side of Fig. 17 reflects the cone-beam region. In contrast, the simulated scatter projection image (right side of Fig. 17) extends beyond the phantom and is distributed within the entire detector area. Simulated scatter profiles for a horizontal line located in the middle of the breast phantom are shown in Fig. 18. The collected number of photons in a detector pixel of 1 mm2 for multiple scatterings was estimated at a level of 300. Multiple scatterings shown (dot-dashed curve) include both multiple Compton and Rayleigh scatterings. It is observed that multiple scatter as well as single Compton scatter (dotted curve) have predominantly low-frequency characteristics and the spatially variant scatter distribution is mainly due to single Rayleigh scatter (dashed curve).
Figure 17.
Simulated primary (left) and scatter (right) projection images of the realistic breast phantom in the CTBI system. The simulated detector pixel size is 1 mm.
Figure 18.
Simulated scatter profiles for the digital breast phantom. Multiple scatterings include both multiple Compton and Rayleigh scatterings.
Precise simulation results on different scatter components could be useful in developing an effective scatter correction strategy based on fast analytical calculation rather than time-consuming Monte Carlo simulation. Kyriakou et al.25 showed that estimation of single Compton or Rayleigh scattering can be calculated analytically with a relatively low computation load. Determining the contribution from multiple scatterings remains a key to more accurately estimating the total scatter. We propose such a method as follows: Step (i), measuring background SPR for a given CTBI setting once, preferably by beam stop method; step (ii), calculating single Compton and Rayleigh scatters using the reconstructed CT image as an initial estimate for a given breast;25 step (iii), estimating multiple scatter according to previously built relation between single Compton and multiple scatters like that in Fig. 18; step (iv), summing all contributions from background scatter, single Rayleigh scatter, single Compton scatter, and multiple scatter to be deducted from corresponding projection data; step (v), reconstructing again from a scatter-corrected projection set to obtain a low-scatter CT image. There are many issues that need to be investigated before this method can be successfully applied. We plan to further study this scatter correction method in the future.
DISCUSSION
Past experimental data26 show that the cross section of the coherent scattering in the energy range of 10–200 keV drops quickly as energy increases for most elements. On the other hand, the cross section of incoherent scattering has different energy dependence in this energy range for different elements. For example, the Compton scattering cross section for light elements such as carbon changes smoothly while for heavy elements such as lead it increases with energy. The energy dependence of the total scatter radiation derives from the competitive effect of the incoherent and coherent scatterings from all composite elements of material. For the breast in the energy range typically used with CTBI, both our measurements and simulations show a slight decrease in the SPR with increased incident x-ray energy.
Our direct SPR measurement by the beam stop method was observed to be similar in shape and magnitude to those reported by Kwan et al.13 under similar experimental conditions; although we note that they used a 2.9 mm wide steel plate and, as mentioned, we used a 2 mm wide lead strip. However, they did not publish results using the aperture method. Our systematic study investigating experimental measurements using different methods of measuring scatter demonstrates that precise scatter measurement still remains a challenge, and large discrepancies can be observed between different methods. This suggests the existence of environmental scatter radiation sources other than the breast. A method was developed to differentiate the scatter contribution in the breast from background, leading to consistent results for different methods after background scatter subtraction. A similar approach was proposed by Yaffe et al.9 many years ago. In 1994, Fahrig et al.19 used this method to correct SPR measurements, observing a 60% effect when a fiber optic antiscatter grid was in place between phantom and detector. They used a BGO plus PMT detector without any detector cover and attributed the background scatter contribution to off-focal radiation.
Possible background scatter sources include the x-ray tube, collimator, filter, detector cover, and detector scintillator in a cone-beam CTBI system. We have tried to model the filter, detector cover, and detector scintillator in simulation but that model was unable to fully account for the measured background scatter. Other background scatter sources include glass windows of the x-ray tube and collimator, backscatter from x-ray photons transmitted through detector, and scintillation light spread before it reaches amorphous silicon. The latter is called veiling glare and is an important scatter contribution in image intensifier.27, 28, 29 Investigation of the veiling glare effect in a digital flat-panel detector needs thorough knowledge of scintillation light conversion and spreading, and it is beyond the scope of this study.
CONCLUSION
In conclusion, scatter in cone-beam CT breast imaging was investigated by comparing experimentally measured scatter distributions to those simulated with the GATE Monte Carlo software. The resulting experimental scatter measurements compared favorably to previously reported measurements. However, by comparing the direct measurements to simulated scatter distributions, it was observed that a significant scatter component can arise from nonbreast sources. To estimate scatter within the breast, a strategy of measurement was developed to subtract the background scatter due to external (nonbreast) sources. The subtracted scatter measurement agrees well with the GATE low energy model simulation.
The validated GATE Monte Carlo simulation package was used to characterize the scatter to primary ratio in different x-ray kVp settings and air gaps as well as for different breast sizes and densities and to study the characteristics of various scatter components including single, multiple incoherent, and coherent scatterings. Aided by the accurate GATE simulations, we confirmed that the spatially variant scatter component in cone-beam CT breast imaging is mainly due to single Rayleigh scattering. Correct measurement procedures and accurate simulations will allow one to develop a more effective and precise scatter correction method in cone-beam CT image reconstruction.
ACKNOWLEDGMENTS
This work was supported in part by the National Institutes of Health (NIH) under Grant No. R01 EB002133 from the National Institute of Biomedical Imaging and Bioengineering (NIBIB). Its contents are solely the responsibility of the authors and do not necessarily represent the official views of the NIH or the NIBIB.
APPENDIX: MODEL COMPARISON IN GATE SIMULATION
The GATE is the GEANT4 application for tomographic emission. GEANT430, 31 was developed by the high energy physics community as a powerful Monte Carlo simulation tool to optimize detector design, to test various theoretic models, to predict detection efficiency, etc. Of particular interest in the x-ray medical imaging application is its electromagnetic interactions packages. Basically, GEANT4 provides three models for photon interactions: Standard, low energy, and PENELOPE. The standard electromagnetic package32 provides a parametrized photoelectric process and a parametrized Compton scattering process optimized for high energy (>5 keV) but no Rayleigh scattering process. The low energy package33 models photoelectric, Compton scattering, and Rayleigh scattering processes based on the exploitation of evaluated data libraries. The PENELOPE model34 has been specifically developed for Monte Carlo simulation and great care was given to the low energy description. In the PENELOPE model, the total cross section of the Compton scattering process or the Rayleigh scattering process is determined from an analytical parametrization. In the current GATE implementation, the PENELOPE model provided by GEANT4 is not included. Since there is no Rayleigh scattering process implemented in the standard model and it is believed that the coherent (Rayleigh) scattering plays an important role in the total scatter distribution for the applied x-ray energy range, we applied the Rayleigh scattering process from the low energy model to the standard model. Hence, what we refer to as the standard model will mean the combination of the standard photoelectric process, the standard Compton scattering process, and the low energy Rayleigh scattering process.
The GATE simulations using the standard and low energy models were compared for both computing performance and physics accuracy. The typical CPU times required for a simulation of 100×106, 50 keV photons on one 1.4 GHz CPU with 1 Gbyte memory are 12.2 and 17.0 h for the standard and low energy models, respectively. It is apparent that the parametrized standard model consumes ∼30% less computing resources. The following comparisons were made at 50 kVp for simulations of both models and measurements.
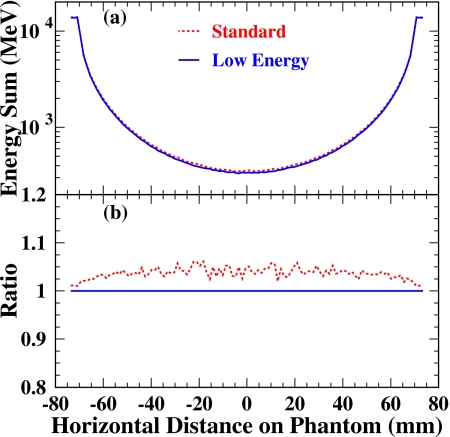
First, we compared the primary profiles of the two models, which is shown in Fig. 19a. The primary shapes look similar and match with the expected projection shape of the 140 mm diameter phantom. Shown in Fig. 19b is the ratio comparison both scaled by the primary profile from the low energy model. It can be clearly seen that less than 5% more primary radiation was generated in the standard model over all region. Only photoelectric interactions stop photons from penetrating the phantom. Therefore larger photoelectric cross section would lead to more suppressed total transmitted radiation which mainly consists of primary radiation. The observed agreement indicates that the parametrized photoelectric process in the standard model is a good approximation of the measured cross section data used in the low energy model.
Figure 19.
Primary profile comparison for two electromagnetic models in GATE simulations: (a) Direct shape; (b) relative comparison scaled by the primary profile from the low energy model. Less than 5% more primary radiation was generated in the standard model. The agreement between the standard and low energy models indicates that the parametrized photoelectric process in the standard model is a good approximation of the measured cross section data used in the low energy model.
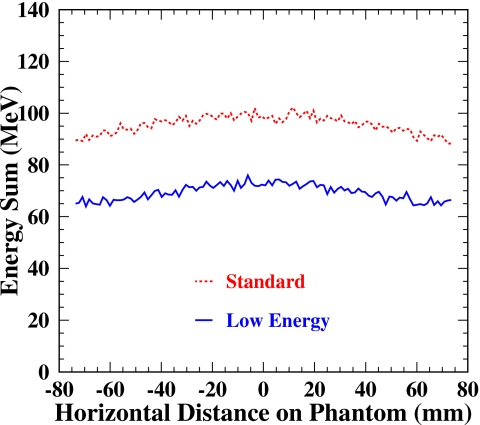
Secondly, we compared the Compton scatter profiles of the two models, shown in Fig. 20. Unlike the primary shapes, the distribution of incoherent scatter is nearly flat, indicating less dependency on the depth of the scattered object. Detailed investigation shows that there is not much of a difference in the spatial distribution arising from photons undergoing just single Compton scattering and those undergoing multiple incoherent scattering (e.g., see Fig. 18 in this article). Compton forward scatterings in the low energy model are suppressed compared to those in the standard model, suggesting that the inclusion of Hubbell’s atomic form factor or scattering function (not in the standard model) is important in order to suppress Compton forward scatterings, which seem to be overestimated by the Klein–Nishina formula used in the standard model.35 Overall, the standard model yields more than 30% higher scatter contribution.
Figure 20.
Compton scatter profile comparison for two electromagnetic models in GATE simulations. The 30% more Compton scatter in the standard model than in the low energy model indicates that the inclusion of the scattering function (not in the standard model) is important in order to suppress Compton forward scatterings.
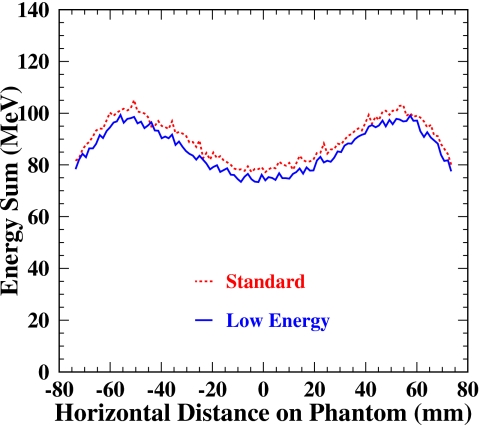
Next, the Rayleigh scatter profiles are shown in Fig. 21. Note that the Rayleigh scattering process we included in the standard model is the same as that in the low energy model. About 5% more Rayleigh scatter was observed in the standard model, which is a reflection of the fact that more primary radiation was generated in the standard model as demonstrated in Fig. 19b. The two symmetric peaks observed are mainly due to single Rayleigh scatter (refer to Fig. 18) and the multiple coherent scatter magnitude is smoothly varying like that of the incoherent scattering.
Figure 21.
Rayleigh scatter profiles in GATE simulations. Note that the Rayleigh scattering process that we included in the standard model is the same as that in the low energy model. About 5% more Rayleigh scatter was observed in the standard model, which is a reflection of the fact that more primary radiation was generated in the standard model as demonstrated in Fig. 19b.
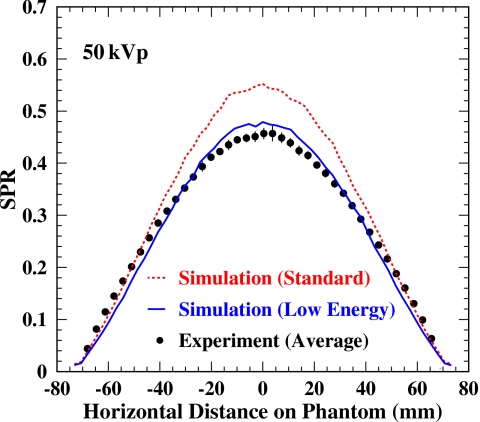
Finally, we compared the SPR profiles of simulations from both models with the measurements. The measured SPRs were averaged from both the beam stop and aperture methods and plotted as solid circles in Fig. 22. The simulation results from the GATE standard and low energy models are shown as dashed and solid curves, respectively. In the studied x-ray energy range, the SPRs from the GATE simulation with the standard model are always larger than those from the low energy model. Good agreement (<5% at center point) between the measurement and simulation from the GATE low energy model is observed.
Figure 22.
SPR profile comparison of two model simulations and the measurements. Dashed and solid curves are the simulated SPRs by the standard and low energy models, respectively. The simulation using the low energy model gives a better match to the measurements.
The low energy electromagnetic package available in GEANT4 uses known measured data libraries for photon interaction cross sections, providing an accurate Monte Carlo simulation model covering a wide energy range above 1 keV. As an alternative, the standard electromagnetic package generates parametrized cross section values, providing a fast model for higher energy applications where the Rayleigh scattering process is negligible, e.g., in PET and SPECT simulations. This study has shown that in comparison to the low energy model, simulation of breast x-ray CT imaging using the standard model yields 30% more Compton scatter and roughly the same primary radiation which is dominantly determined by the photoelectric process. Therefore, a proposed hybrid model in the GATE Monte Carlo simulation, which selects the photoelectric process from the standard electromagnetic model and the Compton and Rayleigh scattering processes from the low energy model, would take advantage of the computing efficiency of the standard model (∼30% less computing resource consumption than the low energy model) and the physics accuracy of the low energy model.
References
- Boone J. M. et al. , “Dedicated breast CT: Radiation dose and image quality evaluation,” Radiology 10.1148/radiol.2213010334 221, 657–667 (2001). [DOI] [PubMed] [Google Scholar]
- Chen B. and Ning R., “Cone-beam volume CT breast imaging: Feasibility study,” Med. Phys. 10.1118/1.1461843 29, 755–770 (2002). [DOI] [PubMed] [Google Scholar]
- Glick S., Vedantham S., and Karellas A., “Investigation of optimal kVp settings for CT mammography using a flat panel detector,” Proc. SPIE 10.1117/12.465581 4682, 392–402 (2002). [DOI] [Google Scholar]
- Siewerdsen J. H. and Jaffray D. A., “Cone-beam computed tomography with a flat-panel imager: Magnitude and effects of x-ray scatter,” Med. Phys. 10.1118/1.1339879 28, 220–231 (2001). [DOI] [PubMed] [Google Scholar]
- Endo M. et al. , “Effect of scattered radiation on image noise in cone-beam CT,” Med. Phys. 10.1118/1.1357457 28, 469–474 (2001). [DOI] [PubMed] [Google Scholar]
- Siewerdsen J. H. et al. , “The influence of antiscatter grids on soft-tissue detectability in cone-beam computed tomography with flat-panel detectors,” Med. Phys. 10.1118/1.1819789 31, 3506–3520 (2004). [DOI] [PubMed] [Google Scholar]
- Jan S. et al. , “Gate, a simulation toolkit for PET and SPECT,” Phys. Med. Biol. 10.1088/0031-9155/49/19/007 49, 4543–4561 (2004). [DOI] [PMC free article] [PubMed] [Google Scholar]
- Liu B., Glick S. J., and Groiselle C., “Characterization of scatter radiation in cone-beam CT mammography,” Proc. SPIE 10.1117/12.595396 5745, 818–827 (2005). [DOI] [Google Scholar]
- Yaffe M., Fenster A., and Johns H. E., “Xenon ionization detectors for fan beam computed tomography scanners,” J. Comput. Assist. Tomogr. 1, 419–428 (1977). [DOI] [PubMed] [Google Scholar]
- Tornai M. P., McKinley R. L., Bryzmialkiewicz C. N., Madhav P., Cutler S. J., Crotty D. J., Bowsher J. E., Samei E., and C. E.Floyd, Jr., “Design and development of a fully 3D dedicated x-ray computed mammotomography system,” Proc. SPIE 10.1117/12.595636 5745, 189–197 (2005). [DOI] [Google Scholar]
- Shaw C. C., Chen L., Altunbas M. C., Tu S., Wang T. P., Liu X., Lai C. J., Kappadath S. C., and Meng Y., “Cone beam breast CT with a flat panel detector—simulation, implementation and demonstration,” Conf. Proc. IEEE Eng. Med. Biol. Soc. 4, 4461–4464 (2005). [DOI] [PubMed] [Google Scholar]
- Boone J. M. and Seibert J. A., “An accurate method for computer-generating tungsten anode x-ray spectra from 30 to 140 kVp,” Med. Phys. 10.1118/1.597953 24, 1661–1670 (1997). [DOI] [PubMed] [Google Scholar]
- Kwan A. L. C., Boone J. M., and Shah N., “Evaluation of x-ray scatter properties in a dedicated cone-beam breast CT scanner,” Med. Phys. 10.1118/1.1954908 32, 2967–2975 (2005). [DOI] [PubMed] [Google Scholar]
- Siewerdsen J. H. and Jaffray D. A., “Optimization of x-ray imaging geometry (with specific application to flat-panel cone-beam computed tomography),” Med. Phys. 10.1118/1.1286590 27, 1903–1914 (2000). [DOI] [PubMed] [Google Scholar]
- Maher K. P. and Malone J. F., “Computerized scatter correction in diagnostic radiology,” Contemp. Phys. 10.1080/001075197182469 38, 131–148 (1997). [DOI] [Google Scholar]
- Chen Y., Liu B., O’Connor M., Didier C. S., and Glick S. J., “Comparison of scatter/primary measurements with GATE simulations for x-ray spectra in cone-beam CT mammography,” Proceedings of the IEEE Nuclear Science Symposium and Medical Imaging Conference, San Diego, CA, 2006. (unpublished), Conference Record No. GA-7.
- Chen Y., Liu B., O’Connor M., Didier C. S., and Glick S. J., “Scatter measurements and simulations in x-ray cone-beam CT breast imaging,” Med. Phys. 34, 2606 (2007). [DOI] [PMC free article] [PubMed] [Google Scholar]
- Sechopoulos I., Suryanarayanan S., Vedantham S., D’Orsi C. J., and Karellas A., “Scatter radiation in digital tomosynthesis of the breast,” Med. Phys. 10.1118/1.2428404 34, 564–576 (2007). [DOI] [PMC free article] [PubMed] [Google Scholar]
- Fahrig R., Mainprize J. G., Robert N., Rogers A., and Yaffe M., “Performance of glass fiber antiscatter devices at mammographic energies,” Med. Phys. 10.1118/1.597236 21, 1277–1282 (1994). [DOI] [PubMed] [Google Scholar]
- Hammerstein G. R. et al. , “Absorbed radiation dose in mammography,” Radiology 130, 485–491 (1979). [DOI] [PubMed] [Google Scholar]
- Colbeth R. E., Mollov I. P., Roos P. G., Shapiro E. G., and Tognina C., “Flat panel detectors for cone beam CT: The complete package of large area, resolution, wide dynamic range and high speed,” Varian Medical Systems Internal Rept.
- Boone J. M. and Chavez A. E., “Comparison of x-ray cross sections for diagnostic and therapeutic medical physics,” Med. Phys. 10.1118/1.597899 23, 1997–2005 (1996). [DOI] [PubMed] [Google Scholar]
- Glick S. J., Thacker S., Gong X., and Liu B., “Evaluating the impact of X-ray spectral shape on image quality in flat-panel CT breast imaging,” Med. Phys. 10.1118/1.2388574 34, 5–24 (2007). [DOI] [PubMed] [Google Scholar]
- O’Connor J. M., Das M., Didier M., Mah’D M., and Glick S. J., “Using mastectomy specimens to develop breast models for breast tomosynthesis and CT breast imaging,” Proc. SPIE 10.1117/12.772666 6913, 691315 (2008). [DOI] [Google Scholar]
- Kyriakou Y., Riedel T., and Kalender W. A., “Combining deterministic and Monte Carlo calculations for fast estimation of scatter intensities in CT,” Phys. Med. Biol. 10.1088/0031-9155/51/18/008 51, 4567–4586 (2006). [DOI] [PubMed] [Google Scholar]
- Amsler C. et al. , “Review of particle physics,” Phys. Lett. B 10.1016/j.physletb.2008.07.018 667, 1 (2008). [DOI] [Google Scholar]
- Seibert J. A., Nalcioglu O., and Roeck W. W., “Characterization of the veiling glare PSF in x-ray intensified fluoroscopy,” Med. Phys. 10.1118/1.595494 11, 172–179 (1984). [DOI] [PubMed] [Google Scholar]
- Seibert J. A., Nalcioglu O., and Roeck W., “Removal of image intensifier veiling glare by mathematical deconvolution techniques,” Med. Phys. 10.1118/1.595720 12, 281–288 (1985). [DOI] [PubMed] [Google Scholar]
- Shaw C.-G. and Plewes D. B., “Effects of scattered radiation and veiling glare in dual-energy tissue-bone imaging: A theoretical analysis,” Med. Phys. 10.1118/1.595975 14, 956–967 (1987). [DOI] [PubMed] [Google Scholar]
- Agostinelli S. et al. , “Geant4: A simulation toolkit,” Nucl. Instrum. Methods Phys. Res. A 10.1016/S0168-9002(03)01368-8 506, 250–303 (2003). [DOI] [Google Scholar]
- Allison J. et al. , “Geant4 developments and applications,” IEEE Trans. Nucl. Sci. 10.1109/TNS.2006.869826 53, 270–278 (2006). [DOI] [Google Scholar]
- Ivanchenko V. N.et al. , “Geant4 standard electromagnetic package for HEP applications,” IEEE Nuclear Science Symposium, Rome, Italy, 2004. (unpublished), Conference Record No. N33–165.
- Chauvie S.et al. , “Geant4 low energy electromagnetic physics,” Proceedings of the Computing in High Energy and Nuclear Physics conference, 2001. (unpublished), pp. 337–340.
- Baro J. et al. , “Penelope: An algorithm for Monte Carlo simulation of the penetration and energy loss of electrons and positrons in matter,” Nucl. Instrum. Methods Phys. Res. B 10.1016/0168-583X(95)00349-5 100, 31–46 (1995). [DOI] [Google Scholar]
- Hubbell J. H., “Summary of existing information on the incoherent scattering of photons, particularly on the validity of the use of the incoherent scattering function,” Radiat. Phys. Chem. 10.1016/S0969-806X(97)00049-2 50, 113–124 (1997). [DOI] [Google Scholar]


