

Abstract
The distribution of water diffusion in biological tissues may be estimated by a 3-D Fourier transform (FT) of diffusion-weighted measurements in q-space. In this study, methods for estimating diffusion spectrum measures (the zero-displacement probability, the mean-squared displacement, and the orientation distribution function) directly from the q-space signals are described. These methods were evaluated using both computer simulations and hybrid diffusion imaging (HYDI) measurements on a human brain. The HYDI method obtains diffusion-weighted measurements on concentric spheres in q-space. Monte Carlo computer simulations were performed to investigate effects of noise, q-space truncation, and sampling interval on the measures. This new direct computation approach reduces HYDI data processing time and image artifacts arising from 3-D FT and regridding interpolation. In addition, it is less sensitive to the noise and q-space truncation effects than conventional approach. Although this study focused on data using the HYDI scheme, this computation approach may be applied to other diffusion sampling schemes including Cartesian diffusion spectrum imaging.
Keywords: Diffusion, diffusion spectrum imaging, diffusion tensor imaging, orientation distribution function, q-space
I. Introduction
Diffusion measurements with magnetic resonance imaging (MRI) is a useful tool for the noninvasive study of microstructural architecture in the brain and other tissues. The diffusion tensor is a widely used and elegant model of water diffusion [1]. This model assumes that the water diffusion behavior follows a 3-D normal distribution with the diffusion tensor as the covariance matrix
| (1) |
where P is the probability density of diffusion displacements or diffusion probability density function (PDF), is the diffusion displacement vector, Δ is the diffusion time, and the diffusion tensor. The distribution of diffusion displacements may be estimated using signal measurements at multiple diffusion-weighting levels and directions, represented by the diffusion-weighting wavevector, , where is the diffusion gradient vector, and δ is the diffusion gradient pulse width [2], [3]. Theoretically, there is a Fourier relationship between the q-space signals and the PDF
| (2) |
where E is the normalized q-space signal.
For the diffusion tensor model, both the PDF and q-space signal are assumed to be Gaussian functions. Thus, for simple multivariate Gaussian diffusion i.e., mono-exponential decay as a function of the diffusion-weighting b
| (3) |
where is the gradient direction unit vector, one may use the diffusion tensor to estimate the PDF directly [1], [4]. However, complex tissue organization (e.g., crossing white matter (WM) fibers), nonmono-exponential diffusion decay (e.g., so-called fast and slow diffusion), and partial volume averaging effects between different tissues (e.g., contributions from gray matter (GM), WM, and cerebrospinal fluid (CSF) in a single voxel) will cause the diffusion to not be Gaussian [5]-[15]. In this case, q-space measurements can be used to accurately characterize the true PDF, which can reveal the distribution of fiber directions and information about “fast” and “slows” diffusion. Researchers have proposed a broad spectrum of methods to overcome limitations of the simple diffusion tensor. Some approaches focus mainly on directional measures at fixed diffusion-weighting with high angular resolution diffusion imaging (HARDI) including q-ball imaging (QBI), spherical harmonic decomposition/transform approaches, generalized DTI (GDTI), diffusion orientation transform (DOT), and fiber orientation estimation using continuous axially symmetric tensors (FORE-CAST) [6], [7], [16]-[21]. The PDF may also be estimated through a model fitting on q-space signals such as the CHARMED model by Assaf et al. [22], [23]. This model consists of a linear combination of one hindered and several restricted Gaussian compartments expressed in the q-space. Another recent model was proposed by Behrens et al. [24], which describes complex diffusion as a combination of isotropic and infinitely narrow “stick” diffusion functions. The final class of methods is to try to sample a discrete range of q-space and exploit the Fourier relationship to estimate the PDF properties without any assumed model. The q-space formalism was first introduced by Callaghan [3], and more recently, adaptations of this approach have been applied to diffusion imaging of the human brain on clinical scanners [9], [25]-[30]. A principal advantage of q-space approaches is that the PDF may be estimated empirically without prior assumptions; however, the main disadvantage is that they are inefficient as a large number of measurements are required to encode q-space.
These q-space approaches also offer the opportunity to characterize diffusion in specific directions. For example, in regions with crossing WM fibers, the diffusivities in the directions parallel and perpendicular to fiber groups may be estimated. However, when using standard diffusion measurement techniques (e.g., the diffusion tensor and diffusivity profiles from HARDI), the estimated apparent diffusivities are based upon the projections of the PDF, which obscure the information from crossing WM and can lead to false “peaks” in the diffusivity profiles e.g., [5]. The directional data of the PDF provides less blurred information about directional tissue microstructure. The relationship between the diffusion profiles from standard diffusivity measurements and the PDF will be discussed.
The interpretation of PDF image data is somewhat challenging as it is a 3-D distribution function at each voxel in the image. In order to distill this information into descriptive maps of PDF features, several scalar measures have been proposed including the zero displacement probability [P(0)] and the mean-squared displacement (MSD) [27]-[29]. Another interest in these methods has been the estimation and visualization of WM fiber orientations using colormaps, and renderings of probability isosurfaces and orientation distribution functions [22], [23], [25], [26], [29]. This information may be useful for resolving crossing WM pathways with tractography methods. One challenge associated with q-space measurements is that insufficient sampling will lead to aliasing and/or truncation artifacts that result from the Fourier transform (FT), which will lead to artifacts in the estimations of these measures [31], [32]. However, certain properties of the FT may be exploited to estimate these properties directly from the q-space data. In this paper, these direct approaches are discussed and evaluated. The methods are applied to both simulated and real data acquired using hybrid diffusion imaging (HYDI) techniques, which sample q-space on concentric spherical shells [29]. Finally, the effects of q-space SNR and sampling are investigated using Monte Carlo simulations.
II. Theory
The relationship between the diffusion PDF and the q-space diffusion signals is a 3-D FT [2], [3]; however, it is possible to extract many of the PDF measures directly from the q-space signals without using the FT. For a 2-D image the central section theorem states that the FT of the line-integral projection (e.g., the Radon transform [36]) of the object distribution is equal to the radial line in the Fourier space at the same angle as the projection. The Radon transform and the central section theorem are the foundation of tomographic reconstruction for projection imaging methods like computed tomography (CT) [33], [35]. In three dimensions, the central section theorem corresponds to a Fourier relationship between a planar-projection integral of the object and a radial line in the Fourier domain at the same angle. Thus, a radial line in q-space corresponds to the FT of the projection of the PDF at the same angle. Conversely, there is a Fourier relationship between a radial line in the PDF and the corresponding projection of the q-space signals. The radial lines in either the q-space signal distribution or the displacement-space PDF are called conditional functions; whereas the projections of these distributions are referred to as the marginal functions. Thus, the FT of the conditional function in one domain corresponds to the marginal function in the opposite domain.
A. Zero Displacement Probability (Po)
The Po is the probability density of water molecules that minimally diffuse within the diffusion time Δ. In the brain, WM exhibits the most consistently high Po, which suggests that water diffusion is more restricted [27]-[29]. As the name indicates, Po is defined as the probability density of zero displacement for a given PDF, , where is the diffusion displacement vector. Using the central limit theorem [33], [34], the PDF signal at the origin may be estimated directly by integrating over all the signals in q-space
| (4) |
where is the normalized diffusion signal at the q-space wave-vector. For nonuniform q-space sampling, the summation needs to be corrected by the sampling density.
B. Mean-Squared Displacement (MSD)
MSD is related to the mean diffusivity (MD) in a voxel via the Einstein diffusion equation, . By definition, this may be estimated by integrating the PDF weighted by the squared displacement: . One may change the orthogonal coordinate to the spherical coordinate and rewrite MSD as
| (5) |
where is the averaged probability on a shell with radius of . Ps could be estimated using 1-D FT of geometric means of HYDI shells in the q-space. Thus,
| (6) |
where GM denotes the geometric mean and qr,s denotes the q-space radius of a shell in a HYDI acquisition. The geometric mean operation for each shell eliminates the need to compensate the data by the sampling density.
C. Orientation Distribution Function (ODF)
The orientation distribution function (ODF) is the radial line integral of the PDF [25], [29]
| (7) |
where θR is the rotation angle, φR is the azimuthal angle and ρ is the length of the displacement vector, , in spherical coordinates. According to the central section theorem, the conditional PDF, CPθR,φR(ρ), is the 1-D FT of the marginal function of q-space signals with the same orientation MQθR,φR(qr) where qr is the radial q-space coordinate. In addition, the line integral of CPθR,φR(ρ), i.e., (7), is the central ordinate value of MQθR,φR(qr = 0) (Fig. 1). Equation (7) may be rewritten as
| (8) |
MQθR,φR(qr) is the 3-D Radon transform along the direction (θR, φR), and its central ordinate value, MQθR,φR(qr = 0) is equal to the integration of the conditional q-space signal, CQ, in the plane normal to (θR,φR)) (Fig. 1). The formula relationships of these PDF measures using both conventional 3-D FT and new direct approaches are summarized in Table I.
Fig. 1.
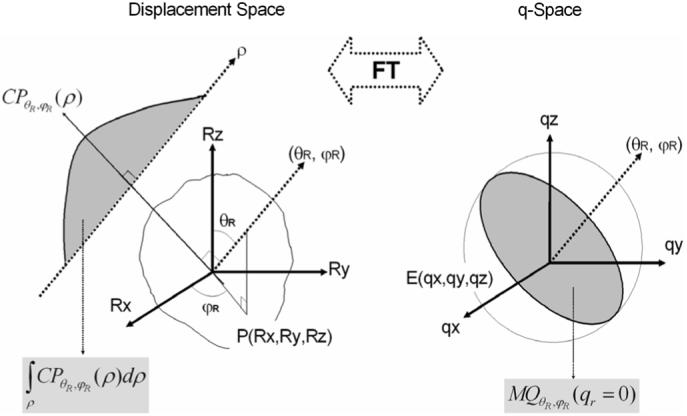
From the central section theorem, the conditional PDF, CPθR,φR(ρ), in the displacement space is the 1-D FT of marginal function, MQθR,φR(qr), in q-space. PDF, P(Rx, Ry, Rz), is the 3-D FT of q-space signals, E(qx, qy, qz). The line integral of the conditional PDF (gray shadow in upper-left) is equivalent to the central ordinate value (gray shadow in right) of the marginal q-space signal function. Central ordinate value of a marginal function is equal to the disc integration of the signal in the normal plane through the FT.
TABLE I.
Summary of Equations
| Measures | Conventional 3D FT | New direct approach |
|---|---|---|
| Po | ||
| MD = MSD/6Δ | MSD = Var{FT1D[GM(qr,S)]} | |
| ODF | ODF(θR,φR) = MQθR, φR (qr = 0). where MQθR,φR is the marginal function of the q-space signals along direction (θR, φR). |
III. Material and Methods
A. HYDI Acquisition
Hybrid diffusion imaging (HYDI) [29] was performed on a healthy 23-year-old male volunteer. Informed consent was obtained in compliance with the guidelines of the Institutional Review Board. MR images were acquired using a 3 T GE SIGNA whole body scanner (GE Healthcare, Waukesha, WI) with an 8-channel receive-only head coil and ASSET parallel imaging with a reduction factor of 2. The diffusion-weighting (DW) pulse sequence was a single-shot, spin-echo, echo-planar imaging (SS-SE-EPI) pulse sequence with diffusion gradient pulses, dual-echo gradient refocusing to minimize distortions from eddy currents, and cardiac gating (using a photo-plethysmograph) to minimize signal fluctuation from brain pulsations.
The HYDI q-space diffusion-encoding scheme is described in Table II. The maximum b-value was 9375 sec/mm2 with a maximum DW gradient of 40 mT/m and gradient duration (δ) and separation (Δ) of 45 and 56 ms, respectively. This sampling scheme corresponded to Δqr = 15.2 mm-1 and maximum q= 76.0 mm-1 (Table II). The field-of-view (FOVR = (Δqr)-1) and the resolution (ΔR = (2maxqr)-1) of the displacement density function of water molecular were 65.8 and 6.6 μm, respectively. Other imaging parameters included an in-plane voxel size = 2 mm (FOV = 25.6 cm and matrix size= 128 × 128), 30 slices with slice thickness = 3 mm covering most of the cerebrum, TE/TR = 122/11700 ms and a total scanning time of approximately 30 min. Signal-to-noise ratio (SNR) of each HYDI shell was calculated, as described in [29]. The mean and peak SNR of WM at the highest b-value were 2.85 ±0.70 and 8.33 ±2.59, respectively.
TABLE II.
HYDI q- Space Encoding Scheme
| Shell | Dir. # | Δqθ (°) | qr (1/mm) | Δqr (1/mm) | b value (sec/mm2) |
|---|---|---|---|---|---|
| 1 | 0 | ||||
| 1st | 3 | 15.2 | 15.2 | 375 | |
| 2nd | 12 | 48° | 30.4 | 15.2 | 1500 |
| 3rd | 12 | 48° | 45.6 | 15.2 | 3375 |
| 4th | 24 | 42° | 60.9 | 15.2 | 6000 |
| 5th | 50 | 30° | 76.0 | 15.2 | 9375 |
| Total 102 | Mean 40° | Max 76.0 | Mean 15.2 | Max 9375 |
B. HYDI Data Processing
First, to minimized overestimation of signals near the noise floor, q-space signals were set to zero if smaller than 2 times of the mean signal in air [22], [23], [27], [28]. PDF measures including Po, MSD, and ODF were computed using (4), (6), and (8) directly from whole q-space signals without the 3-D FT. Although no regridding was required in these computations, correction of the sampling density was performed. The density weighting wi of each q-space sample i was proportional to the relative volume Ai that a sample occupies wi = Ai/ΣiAi. The encoding directions for each shell (derived by an electrostatic repulsion algorithm) were uniformly distributed on a sphere. Thus, the samples on a single shell were assumed to have the same weighting and , where qr,s is the q-space radius of a shell and Ns is the shell number (the index starting from 0 at the center). The density weighting may be rewritten as
| (8) |
For the purpose of comparison, “conventional” PDF measures were computed from the PDF after 3-D FT [29]. In that approach, the nonuniform q-space signals were first regridded onto a 9 × 9 × 9 Cartesian lattice using a bilinear interpolation algorithm (MATLAB function “griddatan”) [37]. After sample interpolation, the PDF of the water diffusion displacement was calculated using 3-D FT of the normalized q-space signals. All data were processed using in-house MATLAB codes.
C. Computer Simulations
A Monte Carlo noise simulation was performed to investigate the effect of SNR on the Po and MSD measurements for both the conventional (3-D FT) and the new computation methods using the HYDI scheme in Table II. Six SNR levels (i.e., 10, 20, 30, 40, 50, and 100) were simulated by adding Gaussian random noise in quadrature to the diffusion-weighted signals of numerical phantoms [38]. Two simple isotropic diffusion numerical phantoms were used—fast diffusivity (D = 1.15 × 10⁻³ mm2/s) and slow diffusivity (D = 0.45 × 10⁻³ mm2/s). One hundred random trials were simulated for each SNR level.
The effects of q-space truncation were also investigated using the same simulated isotropic diffusion phantoms. Five maximum b-values (i.e., 2800, 4375, 6300, 8575, and 11200 s/mm2) were studied without adding noise. For each maximum b-value, the sampling intervals of HYDI schemes including the radial sampling interval, Δqr, and azimuthal sampling interval qr * Δqθ were set at the Nyquist limit of the fast diffusivity, i.e., 10 mm-1 [31].
Finally, the effects of the sampling interval (limited shell data) were also investigated with increasing both radial and azimuthal sampling interval (Δq) from 5, 10, 15, 18, 22.5 to 30 mm-1. Each Δq simulation had the same maximum b value of 14 200 s/mm2, which is adequate to avoid truncation effects, especially for slow diffusion. Therefore, as the sampling interval increases, the HYDI shell number decreases from 18, 9, 6, 5, 4 to 3. No noise was added and the same isotropic numerical phantoms were used in this simulation.
IV. Results
A. In Vivo Brain HYDI Data
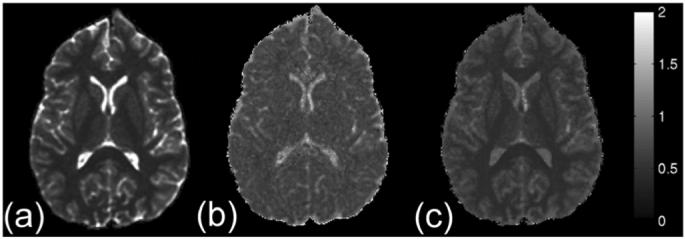
Maps of the PDF measures using the new and conventional computation methods are shown in the upper and bottom rows of Fig. 2, respectively. Both Po maps show high tissue contrast between WM and GM, though the conventional Po map has slightly lower intensity in WM [Fig. 2(a)]. The difference in Po maps appears to be caused by the q-space regridding method (Matlab function, griddatan) prior to FFT. The MD (MSD/6Δ) map estimated using conventional 3-D FT method was higher due to the truncation of slow diffusing components at high q. This artifact may be minimized by increasing the q-space sampling range (i.e., the maximum b-value) at the expense of scanning time. Similar results are shown in the computer simulation below.
Fig. 2.
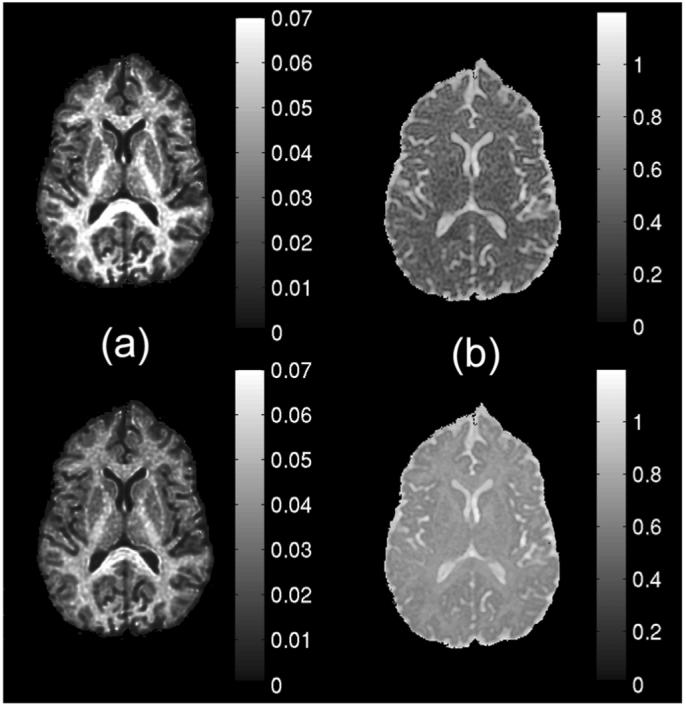
Maps of displacement PDF measures using the new direct method (upper row) and conventional 3-D FT approach (bottom row). (a) Po maps. (b) MD (MSD/6Δ), maps in units of 10- mm2/s.
ODF profiles estimated using both the normal disc integral (equivalent to the central ordinate value of the 3-D Radon transform) of q-space signals and the conventional radial integral of the PDF are shown in Fig. 3 at two anatomical locations, prefrontal WM [Fig. 3(a)] and the splenium of the corpus callosum [Fig. 3(b)]. The normalized ODF profiles using the new computation method appear sharper with fewer spikes and narrower waists [Fig. 3(b)].
Fig. 3.

ODF profiles of a human subject in (a) prefrontal WM, and (b) the splenium of the corpus callosum (b). Left column (pODF) was processed using the conventional 3-D FT method, i.e., the radial integral of the displacement PDF. Right column (qODF) was processed using the new direct method.
B. Simulations of SNR, Truncation, and Sampling Interval Effects
The effects of SNR on the Po and MSD measurements are shown in Fig. 4. Both Po and MD are overestimated with high variances at low SNR levels. Estimates of Po with the new direct computation method showed less variance although the values were slightly overestimated for the slow diffusivity model. The new method (MSD) has less overestimation of MD than the conventional FT method (MD=MSD/6Δ). The estimation variances are similar for both methods in MD.
Fig. 4.
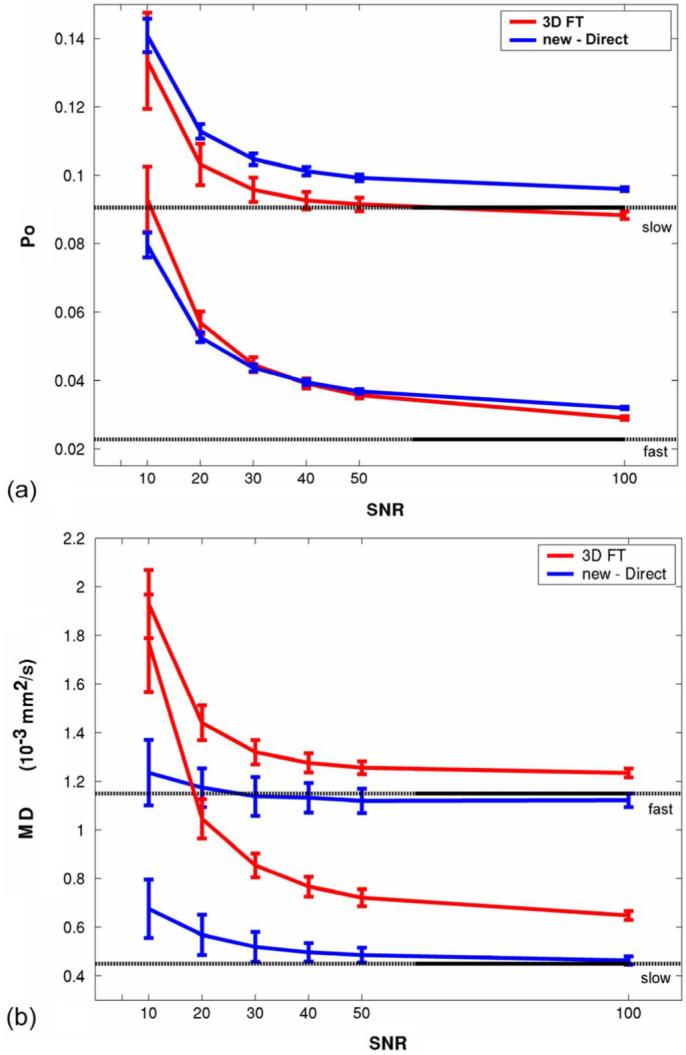
Monte Carlo simulation investigating the effects of noise on estimates of fast and slow isotropic diffusion distributions with D = 1.15 and 0.45 s/mm2, respectively. (a) Po versus SNR. (b) MD (MD = MSD=6Δ) versus SNR. Errorbars denote one standard deviation across 100 trials
The q-space truncation effects are described by the plots in Fig. 5. Obviously, the slow diffusivity signal is most sensitive to q-space truncation with underestimation of Po and overestimation of MSD. The estimation biases caused by truncation are less severe for new computation methods. For the human brain study, the maximum b value was 9375 s/mm2 (Table II) where the MD of slow diffusivity in WM should be more accurate using the new method.
Fig. 5.
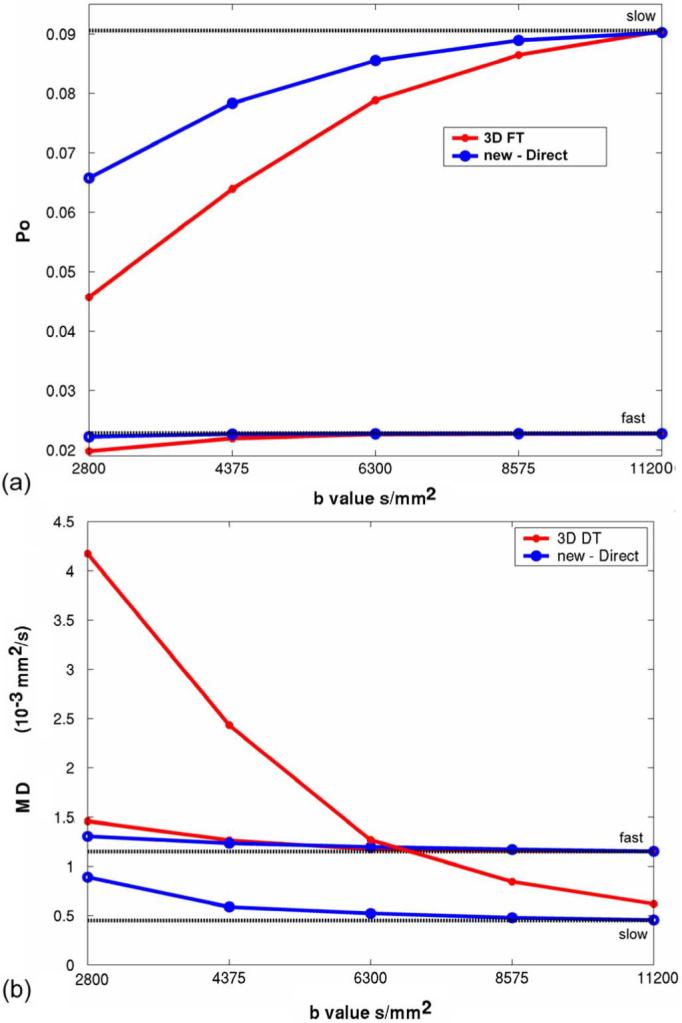
Computer simulation of q-space truncation effects on PDF measures. Diffusion models were simple fast and slow isotropic diffusion distributions with D = 1.15 and 0.45 s/mm2, respectively. No noise was added and both radial and azimuthal sampling intervals was set to be Δq = 10 mm-1. (a) Po versus maximum b-value. (b)(MD = MSD/6Δ) versus maximum b-value.
The effects of the sampling interval Δq (limited shell number) are shown in Fig. 6. As Δq is increased, both Po and MD are overestimated. For estimation of Po, the new computation method introduces larger errors with increasing Δq. However, for MD estimation, it performs better than the conventional FT method. In the human brain study, Δqr mm-1, which would suggest that both Po and MD will be slightly overestimated from their true values.
Fig. 6.
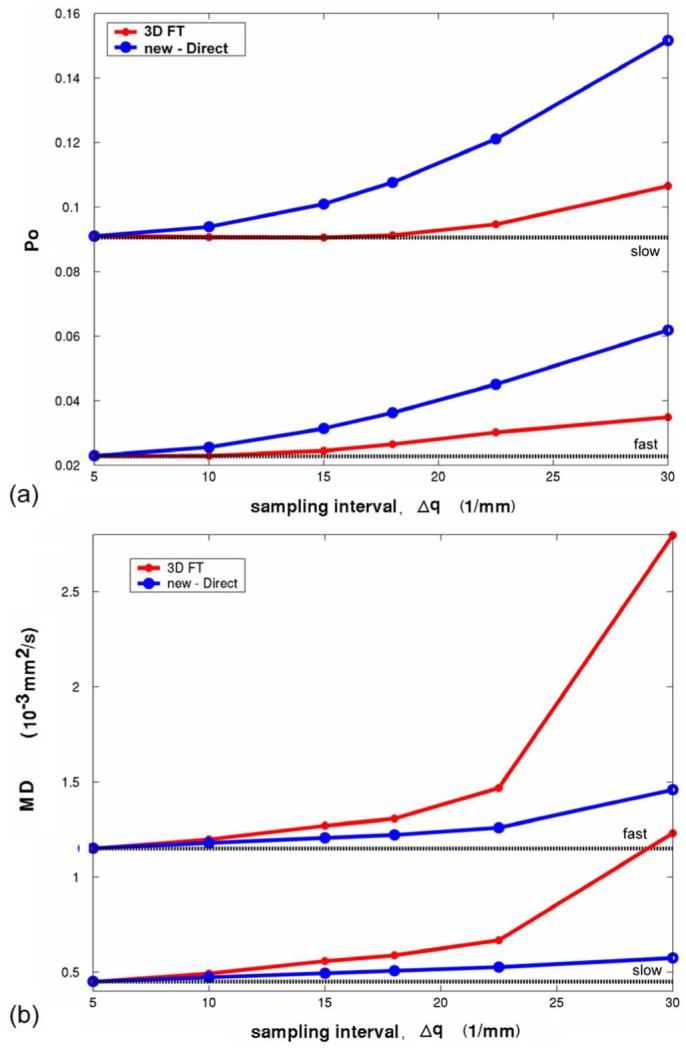
Computer simulation of q-space sampling interval effects on PDF measures. Diffusion models were simple fast and slow isotropic diffusion distributions with D = 1.15 and 0.45 s/mm2, respectively. No noise was added and the maximum b-value was 14200 s/mm2. The radial and azimuthal sampling intervals were increased identically. (a) Po versus Δq. (b) MD (MD = MSD/6Δ) versus Δq
V. Discussion
The main goal of this research is to develop a flexible, accurate, and efficient method for characterizing complex diffusion in the human brain. In this study, we developed a set of efficient computational methods to estimate measures of the diffusion PDF directly in q-space without 3-D FT. These methods were applied to data using HYDI, which is a non-Cartesian q-space sampling strategy that consists of concentric spherical shells of constant |q| radii [29]. The HYDI sampling strategy is similar to that used by the CHARMED model [22], [23] (concentric q-space spheres with increasing sample number with q radius). The main differences between the approaches are that CHARMED is model-based, whereas HYDI uses descriptive statistics. The non-Cartesian sampling of HYDI provides flexibility in the data analyses [29]. For example, the inner shells may be used to reconstruct diffusion tensor images, the outermost shell may be used for HARDI or q-ball imaging processing, and all shells may be used to estimate properties of the PDF [29]. The new estimation methods for Po and MD may easily be adapted to other q-space sampling schemes. The application to Cartesian q-space sampling (i.e., diffusion spectrum imaging) is trivial since the sampling density in q-space is uniform and measurements in the three orthogonal directions are available. Furthermore, q-space interpolation errors would not be present for Cartesian imaging. While we did address some of the sampling issues in our simulations, it is possible that certain q-space sampling schemes might make the estimated values either more or less accurate.
The new computation approach skips two steps used in the original HYDI paper, the regridding interpolation to Cartesian q-space and the 3-D FFT. Thus, it is more computationally efficient, particularly for the Po and MSD estimates. The computations are performed separately for each voxel. In our experience, the processing time for regridding interpolation and 3-D FFT of whole brain HYDI datasets with resultant image matrix of 256 × 256 and 30 slices using Matlab require about 120 h using a 3-GHz Pentium III server with a RAM size of 2 Gb. It is also not clear that the regridding algorithm, a bilinear interpolation (MATLAB built-in function “griddatan”), used in the original HYDI study [29] is optimum. The proposed estimation methods do not require q-space regridding.
The effects of q-space SNR and sampling properties (interval and extent) on Po and MD estimates were investigated using simulations. As a function of SNR, the new estimation methods were equally or more accurate than the 3-D FT method. In the SNR range of most q-space studies on clinical scanners (SNR ~ 20-30 for this study), both Po and MD were overestimated (Fig. 4); however, the bias was less for the new method than the 3-D FT approach. The new approach also appears to be less sensitive to the maximum diffusion-weighting (q-space extent) as shown in Fig. 5. The maximum b-value in this study was 9375s/mm2, which shows minimal bias effects for these diffusivities with the new method. However, the new method appears to be more sensitive to the sampling interval, particularly for estimating Po. In this study, the q-space sampling interval between shells was 15.2 mm-1, which will cause Po to be overestimated although the relative contrast between fast and slow diffusion is relatively unaffected.
The standard diffusion tensor model as well as the original implementations of HARDI methods [6], [7] are derived from the marginal PDF signals. One limitation of DTI and HARDI representations is that the peaks in the diffusivity profiles do not always correspond to the WM fiber direction, particularly in regions of crossing WM fibers. With constrained models, it may be possible to estimate directional diffusivity information of individual fiber components [6], [7], [17]-[20], [24]. However, modeling depends on the prior knowledge of the diffusion behavior in complex tissue structures. If the assumptions are incorrect, then the estimated fiber properties may be misleading.
Recently, HARDI approaches like q-ball imaging (QBI) approaches have been developed to estimate the fiber ODF [16], [30]. QBI uses the Funk-Radon transform, which is a circle integral about the equator normal to the ODF direction. For full q-space imaging (also called diffusion spectrum imaging), the ODF may be estimated by the radial integral of the displacement PDF [26]. In this study, the 3-D Radon transform was used to estimate the ODF by disc integration in the plane normal to the direction of interest. This new approach yielded sharper ODF profiles as evidenced by Fig. 3.
In this study, we used two scalar measures (Po and MSD) to describe properties of the PDF. These measures are rotationally invariant. The forms of the (4), (6) are independent of the coordinate axes. Po is a rotationally invariant measure because the 3-D volume integration in q-space (new computation method) and the central ordinate value of the displacement space (conventional method) are independent of the coordinates. In the MSD calculation, the geometric mean, which was averaged over all directions on a HYDI shell, depends only on the diffusion weighting. The ODF profiles describe intrinsic fiber orientations. Thus, if the coordinates are rotated with respect to the object, the ODF will similarly rotate, but otherwise be identical.
We also explored a new pseudo-diffusivity measure called the q-space inverse-variance (QIV) in Fig. 7(a). The directional information was compressed by taking the geometric mean of q-space signals of all directions on a HYDI shell (similar to the MSD estimation method used here). The QIV was defined as the inverse-variance of q-signal geometric means. One advantage of this approach is that it does not require any FTs. In the case of Gaussian diffusion, the QIV should be equivalent to the MSD, since the variances in q-space and the displacement PDF should be inversely related. However, for non-Gaussian diffusion, the QIV will be similar, but not equivalent to the MSD. This is the case particularly in WM where the QIV is less than GM whereas the MSD measures for both are similar (Fig. 2). The decreased QIV in WM is caused by the slow diffusion component in WM which is weighted more heavily in the QIV measure. Although the QIV is not equivalent to the MSD, it is a valid measure of diffusion behavior.
Fig. 7.
(a) Map of the QIV, a pseudo-diffusivity measure. Maps of (b) axial and (c) radial diffusivities estimated using QIV on the conditional functions of q-space signals (CQ) along the axial and radial directions of the ODF. Color bar units are 10-3 mm2 /s.
The QIV approach may also be exploited to estimate other diffusion features. One example is the estimation of the axial (parallel) and radial (perpendicular) diffusivities from q-space data. Recent studies in animal models have suggested that the axial diffusivity of the diffusion tensor is related to axonal integrity whereas the radial diffusivity is related to myelination [39], [40]. However, these measures will be erroneous in areas of crossing WM. In this case, the axial and radial diffusion may be better characterized using q-space measures. We also explored using the QIV method for estimating the radial and axial diffusivities. The axial and radial directions were defined as the directions of the maximum and the minimum ODF values [(8)], respectively. The radial direction was constrained on the plane perpendicular to the axial direction. The diffusivities in the specific directions were estimated using inverse variance of the q-space conditional function CQ in the specific directions. Maps of axial and radial diffusivities are shown in Fig. 7(b) and (c), respectively. The WM and GM have similar axial diffusivities of about 0.9 × 10⁻³ mm2/s [Fig. 7(b)]. GM has similar radial and axial diffusivities, whereas the WM has much smaller radial diffusivities of roughly 0.2×, 10-3 mm2/s [Fig. 7(c)].
Although promising and interesting, clinical applications of q-space imaging methods like HYDI have not been widely explored. Although recent studies have suggested that Po and MD may be more sensitive to brain pathology [40], more studies are necessary to determine whether these methods offer clear advantages over standard diffusion tensor imaging.
VI. Conclusion
In this study, we described the relationship of conditional and marginal functions between q-space and the displacement space. Based on this relationship and specific FT properties, we introduced a novel computation approach for PDF measures calculated directly from q-space signals, and demonstrated using both computer simulations and human brain experiments with hybrid diffusion imaging. This approach bypasses the regridding interpolation and 3-D FT process in HYDI data analysis. Results of the new approach, including the zero displacement probability and mean-squared displacement were comparable with the conventional calculation from PDF. Computer simulations showed that the new method is less sensitive to noise and q-space truncation effects. This approach may be expanded to other Cartesian or non-Cartesian q-space acquisition methods such as DSI and CHARMED.
Acknowledgment
The authors would like to thank Y.-M. Huang for very helpful discussions.
This work was supported in part by the National Institutes of Health (NIH) under Grant MH62015.
Footnotes
Color versions of one or more of the figures in this paper are available online at http://ieeexplore.ieee.org.
References
- [1].Basser PJ, Mattiello J, Le Bihan DL. Estimation of the effective self-diffusion tensor from the NMR spin echo. J. Magn. Reson. B. 1994;103:247–254. doi: 10.1006/jmrb.1994.1037. [DOI] [PubMed] [Google Scholar]
- [2].Callaghan PT. Principles of Nuclear Magnetic Resonance Microscopy. Clarendon; Oxford, U.K.: 1991. [Google Scholar]
- [3].Callaghan PT, Cory A, MacGowan D, Packer KJ, Zelaya FO. Diffraction-like effects in NMR diffusion studies of fluids in porous solids. Nature. 1991;351:467–469. [Google Scholar]
- [4].Basser PJ. Relationships between diffusion tensor and q-space MRI. Magn. Reson. Med. 2002;47:392–397. doi: 10.1002/mrm.10052. [DOI] [PubMed] [Google Scholar]
- [5].Alexander AL, Hasan KM, Lazar M, Tsuruda JS, Parker DL. Analysis of partial volume effects in Diffusion-Tensor MRI. Magn. Reson. Med. 2001;45:770–780. doi: 10.1002/mrm.1105. [DOI] [PubMed] [Google Scholar]
- [6].Alexander DC, Barker GJ, Arridge SR. Detection and modeling of non-gaussian apparent diffusion coefficient profiles in human brain data. Magn. Reson. Med. 2002;48:331–340. doi: 10.1002/mrm.10209. [DOI] [PubMed] [Google Scholar]
- [7].Frank LR. Characterization of anisotropy in high angular resolution diffusion-weighted MRI. Magn. Reson. Med. 2002;47:1083–1099. doi: 10.1002/mrm.10156. [DOI] [PubMed] [Google Scholar]
- [8].Assaf Y, Cohen Y. Non-mono-exponential attenuation of water and N-acetyl aspartate signals due to diffusion in brain tissue. J. Magn. Reson. 1998;131(1):69–85. doi: 10.1006/jmre.1997.1313. [DOI] [PubMed] [Google Scholar]
- [9].Assaf Y, Cohen Y. Assignment of the water slow-diffusing component in the central nervous system using q-space diffusion MRS: Implications for fiber tract imaging. Magn. Reson. Med. 2000;43(2):191–199. doi: 10.1002/(sici)1522-2594(200002)43:2<191::aid-mrm5>3.0.co;2-b. [DOI] [PubMed] [Google Scholar]
- [10].Clark CA, Le Bihan DL. Water diffusion compartmentation and anisotropy at high b values in the human brain. Magn. Reson. Med. 2000;44:852–859. doi: 10.1002/1522-2594(200012)44:6<852::aid-mrm5>3.0.co;2-a. [DOI] [PubMed] [Google Scholar]
- [11].Inglis BA, Bossart EL, Buckley DL, III, Wirth ED, Mareci TH. Visualization of neural tissue water compartments using biexponential diffusion tensor MRI. Magn. Reson. Med. 2001;45:580–587. doi: 10.1002/mrm.1079. [DOI] [PubMed] [Google Scholar]
- [12].Maier SE, Vajapeyam S, Mamata H, Westin CF, Jolesz FA, Mulkern RV. Biexponential diffusion tensor analysis of human brain diffusion data. Magn. Reson. Med. 2004;51:321–330. doi: 10.1002/mrm.10685. [DOI] [PubMed] [Google Scholar]
- [13].Mulkern RV, Gudbjartsson H, Westin C-F, Zengingonul HP, Gartner W, Guttmann CRG, Robertson RL, Kyriakos W, Schwarz R, Holtzman D, Jolesz FA, Mair SE. Multi-component apparent diffusion coefficients in human brain. NMR Biomed. 1999;12:51–62. doi: 10.1002/(sici)1099-1492(199902)12:1<51::aid-nbm546>3.0.co;2-e. [DOI] [PubMed] [Google Scholar]
- [14].Niendorf T, Dijkhuizen RM, Norris DG, van Lookeren MC, Nicolay K. Biexponential diffusion attenuation in various states of brain tissue: Implications for diffusion-weighted imaging. Magn. Reson. Med. 1996;36(6):847–857. doi: 10.1002/mrm.1910360607. [DOI] [PubMed] [Google Scholar]
- [15].Ronen I, Kim KH, Garwood M, Ugurbil K, Kim DS. Conventional DTI vs. slow and fast diffusion tensors in cat visual cortex. Magn. Reson. Med. 2003;49:785–790. doi: 10.1002/mrm.10431. [DOI] [PubMed] [Google Scholar]
- [16].Tuch DS. Q-Ball Imaging. Magn. Reson. Med. 2004;52:1358–1372. doi: 10.1002/mrm.20279. [DOI] [PubMed] [Google Scholar]
- [17].Liu C, Bammer R, Acar B, Moseley ME. Characterizing non-Gaussian diffusion by using generalized diffusion tensor. Magn. Reson. Med. 2004;51:924–937. doi: 10.1002/mrm.20071. [DOI] [PubMed] [Google Scholar]
- [18].Özarslan E, Mareci TH. Generalized diffusion tensor imaging and analytical relationships between diffusion tensor imaging and high angular resolution diffusion imaging. Magn. Reson. Med. 2003;50:955–965. doi: 10.1002/mrm.10596. [DOI] [PubMed] [Google Scholar]
- [19].Özarslan E, Shepherd TM, Vemuri BC, Blackband SJ, Mareci TH. Resolution of complex tissue microarchitecture using the diffusion orientation transform (DOT) Neuroimage. 2006;31:1086–1103. doi: 10.1016/j.neuroimage.2006.01.024. [DOI] [PubMed] [Google Scholar]
- [20].Anderson AW. Measurement of fiber orientation distributions using high angular resolution diffusion imaging. Magn. Reson. Med. 2005;54:1194–1206. doi: 10.1002/mrm.20667. [DOI] [PubMed] [Google Scholar]
- [21].Hess CP, Mukherjee P, Han ET, Xu D, Vigneron DB. Q-Ball reconstruction of Multimodal fiber orientations using the spherical harmonic basis. Megn. Reson Med. 2006;56:104–117. doi: 10.1002/mrm.20931. [DOI] [PubMed] [Google Scholar]
- [22].Assaf Y, Freidlin RZ, Rohde GK, Basser PJ. New modeling and experimental framework to characterize hindered and restricted water diffusion in brain white matter. Magn. Reson. Med. 2004;52(5):965–978. doi: 10.1002/mrm.20274. [DOI] [PubMed] [Google Scholar]
- [23].Assaf Y, Basser PJ. Composite hindered and restricted model of diffusion (CHARMED) MR imaging of the human brain. NeuroImage. 2005;27:48–58. doi: 10.1016/j.neuroimage.2005.03.042. [DOI] [PubMed] [Google Scholar]
- [24].Behrens TEJ, Woolrich MW, Jenkinson M, Johansen-Berg H, Nunes RG, Clare S, Matthews PM, Brady JM, Smith SM. Characterization and propagation of uncertainty in diffusion-weighted MR imaging. Magn. Reson. Med. 2003;50:1077–1088. doi: 10.1002/mrm.10609. [DOI] [PubMed] [Google Scholar]
- [25].Wedeen VJ, Reese TG, Tuch DS, Weigel MR, Dou J-G, Weiskoff RM, Chessler D. Mapping fiber orientation spectra in cerebral white matter with Fourier-transform diffusion MRI. 2000 Proc. ISMRM Conf..p. 82. [Google Scholar]
- [26].Wedeen VJ, Hagmann P, Tseng W-YJ, Reese TG, Weisskoff RM. Mapping complex tissue architecture with diffusion spectrum magnetic resonance imaging. Magn. Reson. Med. 2005;54:1377–1386. doi: 10.1002/mrm.20642. [DOI] [PubMed] [Google Scholar]
- [27].Assaf Y, Mayk A, Cohen Y. Displacement imaging of spinal cord using q-space diffusion-weighted MRI. Magn. Reson. Med. 2000;44(5):713–722. doi: 10.1002/1522-2594(200011)44:5<713::aid-mrm9>3.0.co;2-6. [DOI] [PubMed] [Google Scholar]
- [28].Assaf Y, Ben-Bashat D, Chapman J, Peled S, Biton IE, Kafri M, Segev Y, Hendler T, Korczyn AD, Graif M, Cohen Y. High b-value q-space analyzed diffusion-weighted MRI: Application to multiple sclerosis. Magn. Reson. Med. 2002;47:115–126. doi: 10.1002/mrm.10040. [DOI] [PubMed] [Google Scholar]
- [29].Wu Y-C, Alexander AL. Hybrid diffusion imaging. NeuroImage. 2007;36:617–629. doi: 10.1016/j.neuroimage.2007.02.050. [DOI] [PMC free article] [PubMed] [Google Scholar]
- [30].Tuch DS, Reese TG, Wiegell MR, Wedeen VJ. Diffusion MRI of complex neural architecture. Neuron. 2003;40:885–895. doi: 10.1016/s0896-6273(03)00758-x. [DOI] [PubMed] [Google Scholar]
- [31].Wu Y-C. Ph.D. dissertation. Dept. Med. Phys., Univ. Wisconsin-Madison; Madison: 2006. Diffusion MRI: Tensors and Beyond (Dissertation style) [Google Scholar]
- [32].Wu Y-C, Alexander AL. Effects of the Finite Q-Space Sampling in DSI. 2005 Proc. ISMRM Conf..pp. 576–0. [Google Scholar]
- [33].Gaskill JD. Linear System, Fourier Transforms and Optics. Wiley; New York: 1978. [Google Scholar]
- [34].Bracewell NR. The Fourier Transform and Its Application. McGraw-Hill; New York: 1986. [Google Scholar]
- [35].Kak AC, Slaney M. Principles of Computerized Tomographic Imaging. IEEE Press; Piscataway, NJ: 1988. [Google Scholar]
- [36].Radon J. Über die bestimmung von funktionen durch ihre integralwerte längs gewisser mannigfaltigkeiten. Math.-Phys. 1917;69:262–267. [Google Scholar]
- [37].Barber CB, Dopkin DP, Huhdanpaa HT. The Quickhull algorithm for convex hulls. ACM Trans. Math. Software. 1996;22(4):469–483. [Google Scholar]
- [38].Pierpaoli C, Basser PJ. Toward a quantitative assessment of diffusion anisptropy. Magn. Reson. Med. 1996;36:893–906. doi: 10.1002/mrm.1910360612. [DOI] [PubMed] [Google Scholar]
- [39].Song S-K, Sun S-W, Ramsbottom MJ, Chang C, Russell J, Cross AH. Dysmyelination revealed through MRI as increased radial (but unchanged axial) diffusion of water. NeuroImage. 2002;17:1429–1436. doi: 10.1006/nimg.2002.1267. [DOI] [PubMed] [Google Scholar]
- [40].Wu Y-C, Alexander AL, Duncan ID, Field AS. Hybrid diffusion imaging in a brain model of dysmyelination. 2007 Proc. ISMRM Conf..p. 318. [Google Scholar]