

Abstract
PDZ domains have long been thought to cluster into discrete functional classes defined by their peptide-binding preferences. We used protein microarrays and quantitative fluorescence polarization to characterize the binding selectivity of 157 mouse PDZ domains with respect to 217 genome-encoded peptides. We then trained a multidomain selectivity model to predict PDZ domain–peptide interactions across the mouse proteome with an accuracy that exceeds many large-scale, experimental investigations of protein-protein interactions. Contrary to the current paradigm, PDZ domains do not fall into discrete classes; instead, they are evenly distributed throughout selectivity space, which suggests that they have been optimized across the proteome to minimize cross-reactivity. We predict that focusing on families of interaction domains, which facilitates the integration of experimentation and modeling, will play an increasingly important role in future investigations of protein function.
Eukaryotic proteins are modular by nature, comprising both interaction and catalytic domains (1, 2). One of the most frequently encountered interaction domains, the PDZ domain, mediates protein-protein interactions by binding to the C termini of its target proteins (3-6). Previous studies of peptide-binding selectivity have placed PDZ domains into discrete functional categories: Class I domains recognize the consensus sequence Ser/Thr-X-ψ-COOH, where X is any amino acid and ψ is hydrophobic; class II domains prefer ψ-X-ψ-COOH; and class III domains prefer Asp/Glu-X-ψ-COOH (5, 7). More recent information has suggested that these designations are too restrictive and so additional classes have been proposed (8, 9). The idea that domains fall into discrete categories, however, raises questions about functional overlap: Domains within the same class are more likely to cross-react with each other’s ligands. To resolve this issue, we characterized and modeled PDZ domain selectivity on a genome-wide scale.
We began by cloning, expressing, and purifying most of the known PDZ domains encoded in the mouse genome (10-12) (table S1). Soluble protein of the correct molecular weight was obtained for 157 PDZ domains (fig. S1). Whereas previous efforts to characterize the selectivity of PDZ domains have relied on collections of peptides with randomized sequences (7, 9, 13, 14), our goal was to focus on genome-encoded sequences. We therefore synthesized and purified fluorescently labeled peptides derived from the 10 C-terminal residues of mouse proteins. In total, we synthesized 217 such peptides, which we termed our “training set” (table S2) (15). Although our training set is not guaranteed to contain ligands for every PDZ domain, it permitted us to obtain a broad view of binding selectivity.
To investigate biophysical interactions between the 157 well-behaved PDZ domains and each of the 217 fluorescent peptides, we devised a strategy that combines the throughput of protein microarrays and the fidelity of fluorescence polarization (FP) with predictive modeling (Fig. 1A). Microarrays of PDZ domains were prepared within individual wells of microtiter plates and probed, in triplicate, with a 1 μM solution of each peptide (Fig. 1B) (16). Interactions with a mean fluorescence that was at least three times the median fluorescence on the array were scored as “array positives” (17). This process yielded 1301 putative interactions involving 127 PDZ domains. Little can be concluded about the 30 domains for which no array positives were found. For domains that bound at least one peptide, however, the inability to bind other peptides provides important information: These noninteractions were scored as “array negatives.”
Fig. 1.
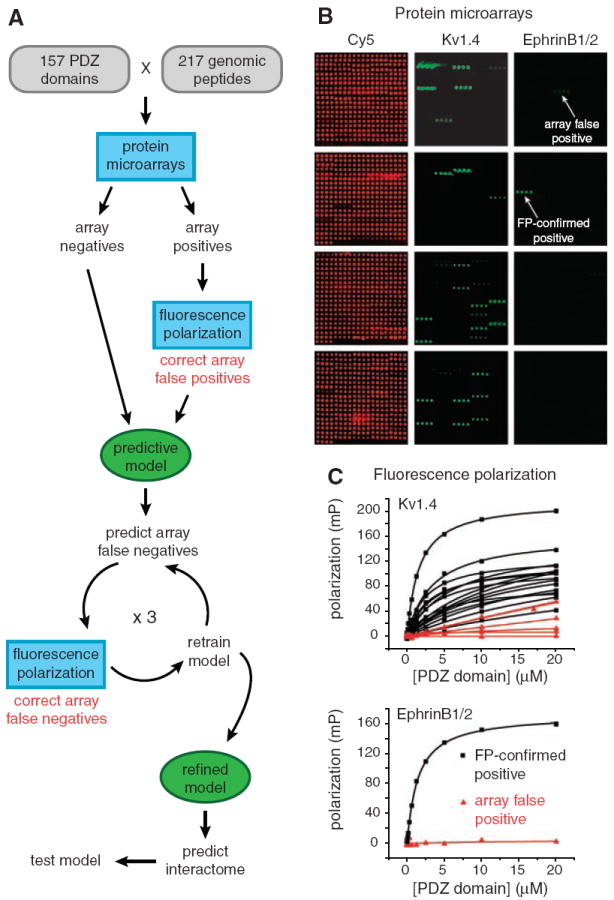
(A) Strategy for constructing a multidomain selectivity model for mouse PDZ domains. Protein microarrays were used to test all possible interactions between 157 mouse PDZ domains and 217 genome-encoded peptides. Array positives were retested and quantified by FP, thereby correcting array false positives. The resulting data were used to train a predictive model of PDZ domain selectivity. The model highlighted putative array false negatives, which were tested by FP, and the corrected data were used to retrain the model. After three cycles of prediction, testing, and retraining, the refined model was used to predict PDZ domain–protein interactions across the mouse proteome. (B) Representative images of protein microarrays, probed with fluorescently labeled peptides. PDZ domains were spotted in quadruplicate in individual wells of 96-well microtiter plates. (Four wells were required to accommodate all of the domains.) The red images (Cy5) show the location of the PDZ domain spots. The green images show arrays probed with a promiscuous peptide derived from Kv1.4 (left) and a selective peptide derived from ephrin B1/2 (right). (C) FP titration curves obtained for the array positives identified in (B).
As with any high-throughput method, there are error rates associated with identifying both positives and negatives. To eliminate array false positives, we retested and quantified every array positive with a solution-phase FP assay (Fig. 1C), which served as our “gold standard” (17). By measuring FP at 12 concentrations of PDZ domain, we determined the dissociation constant (Kd) for each of the 1301 array positives (table S3). Interactions that showed saturation binding (18) with a Kd < 100 μM were considered “positives”; those that did not were considered “negatives.” On the basis of these criteria, 85 PDZ domains bound at least one peptide in the training set. Although our Kd cutoff was high, ~90% of the interactions had a Kd < 50 μM, and ~60% of interactions had a Kd < 20 μM (fig. S2). In addition, FP assays revealed the false-negative rate of the protein microarray assay to be 6.6% (19).
To extract from our data the rules that govern the peptide-binding selectivity of PDZ domains, we built a model that predicts the PDZ domains to which a peptide will bind, given its sequence. Peptide recognition is often modeled with a position-specific scoring matrix (PSSM), Θ = {θp,q}, where θp,q is defined as the probability of observing amino acid q at position p in the subset of peptides that bind to that domain (20). This scoring approach is useful for predicting peptides that bind to a single domain, but it is not ideally suited to our purpose for two reasons. First, our peptide sequences are derived from the genome and thus are not random. Second, our goal is to learn how one domain differs from another, (i.e., how selectivity is achieved). This information is not captured in a traditional PSSM because peptide residues that contribute strongly to binding affinity, such as the C-terminal residue, dominate the model, even if they are not important in distinguishing one domain from another.
To construct a single model that includes many PDZ domains, we developed a variation of a PSSM in which a peptide is predicted to bind to PDZ domain i if
| (1) |
where φ is a binding score, A is an indicator of peptide sequence, (Ap,q = 1 if the amino acid at position p of the peptide is q and Ap,q = 0 otherwise), and τi is a scoring threshold, specific to each domain. To ensure that our model focuses on PDZ domain selectivity, we constrained to be 0 for every position p and every amino acid q. Thus, θi,p,q is positive if PDZ domain i prefers amino acid q at position p more than the other PDZ domains, negative if it prefers it less, and 0 if it has no bias relative to the other domains. To tailor the threshold appropriately for each domain, we defined τi to be the mth percentile of φi’s for all of the peptides in our training set that bound to PDZ domain i. Empirically, we found that setting m = 5 provides a good balance between false-positive predictions and false-negative predictions. Because this model is designed to highlight selectivity across many members of a domain family, we refer to it as a multidomain selectivity model (MDSM).
Our model takes into account the five C-terminal residues of the peptide ligand: positions −4, −3, −2, −1, and 0. Even with 217 data points for each domain, there is insufficient information to train such a high-dimensional model. To avoid overfitting, we implemented a smoothing technique. If two PDZ domains bind a similar subset of peptides, it is reasonable to expect that their θp,q’s are also similar, unless the data suggest otherwise. Likewise, if two amino acids have similar physicochemical properties, it is reasonable to expect that their θi,p’s will be similar. Smoothing requires a quantitative measure of pairwise distance. With PDZ domains, distance was defined as the Hamming distance of their binding vectors across the training-set peptides. With amino acids, we relied on previously reported “z scales” to capture their physicochemical properties, where z1 is considered a descriptor of hydrophilicity, z2 is a descriptor of molecular weight and surface area, and z3 is a descriptor of polarity and charge (21). We reduced the equivalent degrees of freedom in our model by smoothing over PDZ domains and over amino acids with a Gaussian kernel during regression (22).
We were able to model 74 of the 85 PDZ domains, which suggests that the majority of PDZ domains (87%) conform to the assumption that the contribution of each peptide position to selective binding is additive. Having trained the MDSM, we used it to predict false negatives in our microarray data (Fig. 1A). Predicted array false negatives were assayed experimentally by quantitative FP, and the MDSM was retrained using the updated information. This cycle of prediction, experimentation, and retraining was performed three times. In total, we tested 303 predicted array false negatives, of which 133 (44%) were found to be positives, yielding a high-quality, quantitative interaction matrix for mouse PDZ domains (Fig. 2A and table S3). Overall, we found that the average binding affinity of the array false negatives was slightly lower than that of the array true positives. The distributions of binding affinities, however, overlapped considerably (fig. S3).
Fig. 2.
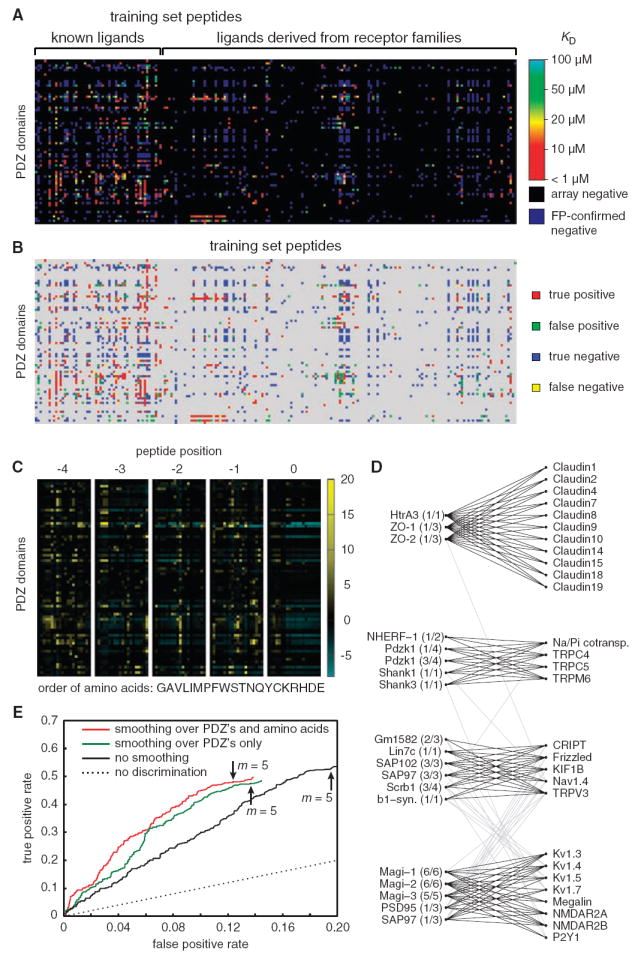
(A) Graphical view of the training-set data. Kd’s of FP-confirmed positives are represented by colors, ranging from high affinity (red) to low affinity (light blue). Array negatives are shown in black, and FP-confirmed negatives are shown in dark blue. Numerical values are provided in table S3. (B) Performance of the MDSM on the training set, with m set to 5. True positives are shown in red, false positives in green, true negatives in blue, and false negatives in yellow. (C) Graphical representation of the MDSM parameters, θi,p,q. Positive contributions to discriminative binding are graded from black to yellow, and negative contributions are graded from black to light blue. Numerical values are provided in table S4. Single-letter abbreviations for the amino acid residues are as follows: A, Ala; C, Cys; D, Asp; E, Glu; F, Phe; G, Gly; H, His; I, Ile; K, Lys; L, Leu; M, Met; N, Asn; P, Pro; Q, Gln; R, Arg; S, Ser; T, Thr; V, Val; W, Trp; and Y, Tyr. (D) Tight clusters embedded in the bipartite interaction network between the 74 PDZ domains and the 217 training-set peptides. (E) ROC curves for three versions of the MDSM, obtained with the test set of 48 peptides. The best performance was obtained after smoothing over both PDZ domains and amino acids. The performance of each version of the MDSM with m set to 5 is indicated with an arrow.
The refined model performs well on the updated data set, with a true-positive rate of 96% (it correctly identifies 515 of 536 FP-confirmed positives) and a false-positive rate of 15% (it predicts an interaction for 186 of 1229 FP-confirmed negatives) when m is set to 5 (Fig. 2B). The parameters of the MDSM are depicted as a heat map in Fig. 2C and are provided in table S4. As anticipated, position 0 does not contribute strongly to discriminative binding, but the four other positions contribute substantially (Fig. 2C).
To extract biophysical modules out of the resulting interaction network, we designed a modified version of the Markov cluster algorithm (23), tailored to the special situation of a bipartite network (22). The algorithm simulates a random walk on the graph and is based on the observation that random walks tend to be confined within “tight clusters” of nodes. The algorithm identified four tight clusters of PDZ domains and their binding partners (Fig. 2D). For example, the claudins (tight junction proteins) cluster with ZO-1 and ZO-2, whereas the N-methyl-d-aspartic acid (NMDA) receptor subunit isoforms NMDAR2A and NMDAR2B, as well as several voltage-gated potassium channels, cluster with PSD-95, SAP-97, Magi-1, Magi-2, and Magi-3.
Encouraged by the close agreement of our model with the training-set data, we used the MDSM to predict to which proteins in the mouse proteome each of the 74 PDZ domains are able to bind. In total, we surveyed 31,302 peptide sequences corresponding to the C termini of all translated open reading frames (24). We have previously shown that our domain-based in vitro strategy faithfully captures ~85% of the previously reported interactions involving PDZ domains (17). We therefore provide these predictions (18,149 PDZ domain–peptide interactions) as supplemental information (table S5) to help guide future biological investigations (25). We note, however, that not all interactions that are observed in vitro necessarily occur in vivo.
To further assess the accuracy of our model, we selected a “test set” of 48 proteins from the mouse proteome that were predicted to be highly connected to PDZ domains (table S6). We synthesized fluorescently labeled peptides corresponding to their C termini and assayed them for binding to the 74 PDZ domains in our MDSM with the use of a single-point FP assay (26). These peptides were not included in the training set and so offer a stringent test of our model. In total, 493 new interactions and 3059 noninteractions were identified. Our model predicted 48% (237) of the new interactions and 88% (2680) of the noninteractions when m was set to 5 (Fig. 2E), with a true-positive/false-positive (TP/FP) ratio of 0.63 (237/379). The TP/FP ratio of our model predictions exceeds by a factor of more than 20 the TP/FP ratio of a Bayesian model that integrates information from two large-scale yeast two-hybrid experiments and two large-scale in vivo pull-down experiments in Saccharomyces cerevisiae, while maintaining the same true-positive rate (27). We attribute the accuracy of our MDSM to its focus on a related family of domains, rather than on a broad collection of proteins with disparate properties. This argues strongly for a systematic but segmented effort to uncover protein-protein interactions by focusing on families of interaction modules.
We also observed a positive correlation between the model output (φi) and binding affinity (fig. S5). We found that smoothing over both PDZ domains and amino acids substantially contributes to the accuracy of the model, boosting the TP/FP ratio by 44% over the model constructed without smoothing, while maintaining the true-positive rate essentially the same (Fig. 2E). Most of the effect was derived from smoothing over PDZ domains, but smoothing over amino acids was also beneficial. To exclude the possibility that the model performance was due to chance correlation, we performed a Y-randomization test (28) in which the interaction data were shuffled. The resulting receiver operating characteristic (ROC) curve was indistinguishable from the no-discrimination line (fig. S6), indicating the effectiveness of our training and test sets.
Having established that the model accurately captures information about the binding selectivity of PDZ domains, we asked which physicochemical properties each domain uses at each position to define its selectivity. For example, if we look at the amino acid preferences of Dlgh3 (1/1) at position −4, we find that the 20 θ’s are positively correlated with z1 but are not correlated with z2 or z3 (Fig. 3A). In contrast, z2, but not z1 or z3, correlates with discriminative binding at position −4 for Magi-1 (4/6) (Fig. 3B), whereas z3, but not z1 or z2, correlates with discriminative binding at position −4 for MUPP1 (10/13) (Fig. 3C). These three examples are extremes; in general, PDZ domains rely on all three z scales for discriminative binding. To capture this information for all PDZ domains at all positions, we constructed a correlation matrix between the model parameters and the first three z scales of amino acids (Fig. 3D). Because the contribution to discriminative binding at position 0 is weak, we omitted this position from our analysis to avoid biasing our results with artificially amplified effects.
Fig. 3.
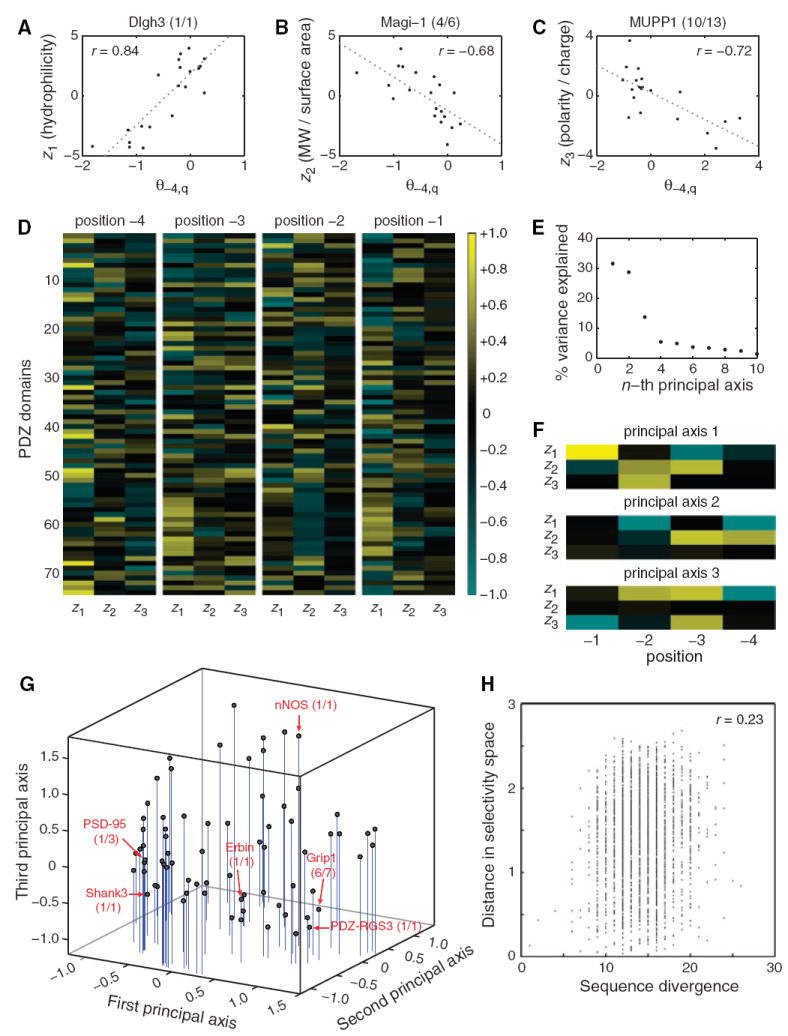
(A to C) Correlations between z scales and model parameters at position −4 for three PDZ domains. (A) z1 positively correlates with θ−4,q for Dlgh3 (1/1). (B) z2 negatively correlates with θ−4,q for Magi-1 (4/6). (C) z3 negatively correlates with θ−4,q for MUPP1 (10/13). (D) Correlation matrix between the model parameters for all 74 PDZ domains at positions −4, −3, −2, and −1 and the first three z scales of the amino acids. (E) Percentage of variance in the correlation matrix that is explained by the 12 principal axes identified through singular-value decomposition. (F) Graphical representation of the first three principal axes, used to define PDZ domain selectivity space. (G) Distribution of the 74 PDZ domains in selectivity space. Selected PDZ domains are shown, representing class I domains [PSD-95 (1/3) and Shank3 (1/1)], class II domains [Grip1 (6/7) and PDZ-RGS3 (1/1)], and class III domains [nNOS (1/1)]. Erbin (1/1), which has been described as a dual-specificity domain, lies between the class I and class II domains. (H) Correlation between pairwise sequence divergence of PDZ domains and their pairwise distances in selectivity space. Sequence divergence was obtained from pairwise alignments performed with Vector NTI version 8 (InforMax, Invitrogen Life Science Software, Frederick, Maryland), using the blosum62mt2 matrix. Pairwise distances in selectivity space are Euclidean distances obtained from the three-dimensional plot in (G).
To understand the organization of peptide-binding selectivity on a global level, we deconvoluted the correlation matrix through singular-value decomposition and found that the distribution of PDZ domain binding preferences can be largely explained by three principal axes. The space defined by these axes can be thought of as “PDZ domain selectivity space.” Each of the first two axes explains ~30% of the variance in the correlation matrix, whereas the third axis explains ~14% (Fig. 3E). The first axis (Fig. 3F) can distinguish canonical class I PDZ domains, which are preferred by peptides with a small, hydrophilic residue at position −2, from canonical class II domains, which are preferred by peptides with a large, hydrophobic residue at position −2. Thus, the class I domains PSD-95 (1/3) and Shank3 (1/1) lie at the negative end of the first principal axis (Fig. 3G), whereas the class II domains PDZ-RGS3 (1/1) and Grip1 (6/7) lie at the positive end. Erbin (1/1), which has been shown to bind both class I and class II peptides (28-31), lies between the two extremes. The second and third principal axes (Fig. 3F) add further resolution. In particular, the third axis distinguishes class III domains, such as neuronal nitric oxide synthase (nNOS) (1/1) (preferred by peptides with a negatively charged residue at position −2), from the other PDZ domains. The closer a PDZ domain lies to the positive end of the third principal axis, the more it falls into the class III designation.
There are, however, two important differences between the standard view of PDZ domain selectivity and the view that emerges from our broad investigation. First, positions −4, −3, −2, and −1 all contribute substantially to the definition of our three principal axes (Fig. 3F). This implies that selectivity is derived from interactions throughout the binding pocket, whereas peptide library screens have shown that affinity is derived largely from the recognition of amino acids at positions −2 and 0 (7). Second, and more importantly, PDZ domains do not fall into discrete classes but instead lie on a continuum. Indeed, the canonical classes lie only in select portions of this continuum (i.e., at the extremes of the first and third principal axes). Moreover, the PDZ domains represented in our model are evenly distributed throughout selectivity space (Fig. 3G). Zarrinpar et al. previously showed that the 23 Src homology 3 domains in S. cerevisiae are optimized to avoid cross-reactivity with the mitogen-activated protein kinase signaling protein Pbs2 (32). Here, we find on a much broader scale that a similar principle is in effect among mouse PDZ domains and their ligands. Although the selectivity of protein-protein interactions could, in a multicellular organism, be controlled at the level of gene coexpression and protein colocalization, our results indicate that the intrinsic selectivity of PDZ domains is tuned across the mouse proteome to minimize cross-reactivity.
Finally, we observed only a weak correlation (correlation coefficient r = 0.23) between the pairwise sequence divergence of PDZ domains and their distances in selectivity space (Fig. 3H). Similarity at the overall sequence level is thus a poor predictor of PDZ domain function. This low correlation suggests that most of the sequence variation among PDZ domains is neutral with respect to peptide-binding selectivity and that only a subset of residues—presumably in the binding pocket of the PDZ domain—is responsible for the distribution of PDZ domains in selectivity space.
Footnotes
Supporting Online Material
www.sciencemag.org/cgi/content/full/317/5836/364/DC1
Materials and Methods
Figs. S1 to S6
Tables S1 to S6
References
References and Notes
- 1.Pawson T. Nature. 1995;373:573. doi: 10.1038/373573a0. [DOI] [PubMed] [Google Scholar]
- 2.Pawson T, Nash P. Science. 2003;300:445. doi: 10.1126/science.1083653. [DOI] [PubMed] [Google Scholar]
- 3.Kim E, Niethammer M, Rothschild A, Jan YN, Sheng M. Nature. 1995;378:85. doi: 10.1038/378085a0. [DOI] [PubMed] [Google Scholar]
- 4.Kornau HC, Schenker LT, Kennedy MB, Seeburg PH. Science. 1995;269:1737. doi: 10.1126/science.7569905. [DOI] [PubMed] [Google Scholar]
- 5.Nourry C, Grant SGN, Borg J-P. Sci STKE. 2003;2003:re7. doi: 10.1126/stke.2003.179.re7. [DOI] [PubMed] [Google Scholar]
- 6.Harris BZ, Lau FW, Fujii N, Guy RK, Lim WA. Biochemistry. 2003;42:2797. doi: 10.1021/bi027061p. [DOI] [PubMed] [Google Scholar]
- 7.Songyang Z, et al. Science. 1997;275:73. doi: 10.1126/science.275.5296.73. [DOI] [PubMed] [Google Scholar]
- 8.Bezprozvanny I, Maximov A. FEBS Lett. 2001;509:457. doi: 10.1016/s0014-5793(01)03214-8. [DOI] [PubMed] [Google Scholar]
- 9.Song E, et al. Mol Cell Proteomics. 2006;5:1368. doi: 10.1074/mcp.M600072-MCP200. [DOI] [PubMed] [Google Scholar]
- 10.Letunic I, et al. Nucleic Acids Res. 2006;34:D257. doi: 10.1093/nar/gkj079. [DOI] [PMC free article] [PubMed] [Google Scholar]
- 11.Schultz J, Milpetz F, Bork P, Ponting CP. Proc Natl Acad Sci U S A. 1998;95:5857. doi: 10.1073/pnas.95.11.5857. [DOI] [PMC free article] [PubMed] [Google Scholar]
- 12.The “genomic” mode of the Simple Modular Architecture Research Tool (SMART) database (10, 11) currently lists 240 PDZ domains identified from the mouse genome sequence. We obtained sequence-verified clones for 203 of them. In addition, we cloned 18 PDZ domains that are listed only in the “normal” mode of the SMART database. Each domain was purified in a single step from a large-scale bacterial culture, its purity was assessed by SDS–polyacrylamide gel electrophoresis (fig. S1), and its aggregation state was assessed by analytical gel filtration (table S1). Soluble protein of the correct molecular weight was obtained for 157 PDZ domains. Of these, 151 were monomeric, 4 were dimeric, and 2 were a mixture of monomers and dimers (table S1).
- 13.Fuh G, et al. J Biol Chem. 2000;275:21486. doi: 10.1074/jbc.275.28.21486. [DOI] [PubMed] [Google Scholar]
- 14.Zhang Y, et al. J Biol Chem. 2006;281:22299. doi: 10.1074/jbc.M602902200. [DOI] [PubMed] [Google Scholar]
- 15.We derived 57 of the training-set peptides from proteins that had previously been shown to interact with PDZ domains. To allow for the possibility of discovering sequences that fall outside the established view of peptide-binding selectivity, we derived the other peptides from different members of 13 families of membrane proteins, regardless of whether their C termini feature canonical PDZ domain binding motifs (table S2).
- 16.Jones RB, Gordus A, Krall JA, MacBeath G. Nature. 2006;439:168. doi: 10.1038/nature04177. [DOI] [PubMed] [Google Scholar]
- 17.Stiffler MA, Grantcharova VP, Sevecka M, MacBeath G. J Am Chem Soc. 2006;128:5913. doi: 10.1021/ja060943h. [DOI] [PMC free article] [PubMed] [Google Scholar]
- 18.Data for each PDZ-peptide combination [FP, recorded as millipolarization (mP) units] were fit to an equation that describes saturation binding, as previously noted (17). Interactions were scored as “positive” if all three of the following criteria were met: (i) The data fit well to the equation (r2 > 0.95); (ii) the difference between FP at 20 μM PDZ domain and FP at 0 μM PDZ domain was >15 mP units; and (iii) the Kd was <100 μM.
- 19.To estimate the false-negative rate of our microarray assay, we randomly selected 32 PDZ domains and 32 peptides. We then screened all 1024 possible interactions with the use of a single-point FP assay and determined the Kd for all positive interactions. A comparison of the resulting interaction matrix with the microarray data showed a false-negative rate of 6.6%.
- 20.Obenauer JC, Cantley LC, Yaffe MB. Nucleic Acids Res. 2003;31:3635. doi: 10.1093/nar/gkg584. [DOI] [PMC free article] [PubMed] [Google Scholar]
- 21.Sandberg M, Eriksson L, Jonsson J, Sjostrom M, Wold S. J Med Chem. 1998;41:2481. doi: 10.1021/jm9700575. [DOI] [PubMed] [Google Scholar]
- 22.Materials and methods are available as supporting material on Science Online.
- 23.van Dongen S. thesis. University of Utrecht; Netherlands: 2000. [Google Scholar]
- 24.Full-length sequences of 31,302 unique mouse proteins (including splicing variants) were downloaded with BioMart from data set NCBIM36 (Mus musculus genes) of Ensembl 44. The C-terminal sequence of each entry was extracted using a Python script.
- 25.Interactions in table S5 are model predictions with m set to 20. On the basis of the results of our model validation efforts, we estimate these predictions to have a true-positive rate of 35%, a false-positive rate of 7%, and a TP/FP ratio of 0.83.
- 26.This single-point assay measures the difference between FP at 20 nM peptide, 20 μM PDZ domain and FP at 20 nM peptide, 0 μM PDZ domain. An analysis of 1710 FP titration curves shows that applying a threshold of 40 mP units to this single-point assay correctly identifies 91% of the positives and 96% of the negatives (fig. S3). Thus, instead of performing an additional 1170 titration curves, we used this single-point assay with a threshold of 40 mP units to evaluate interactions between the 48 test peptides and the 74 PDZ domains in the MDSM.
- 27.Jansen R, et al. Science. 2003;302:449. doi: 10.1126/science.1087361. [DOI] [PubMed] [Google Scholar]
- 28.Tropsha A. Annu Rep Comput Chem. 2006;2:113. doi: 10.1016/S1574-1400(06)02009-3. [DOI] [PMC free article] [PubMed] [Google Scholar]
- 29.Birrane G, Chung J, Ladias JA. J Biol Chem. 2003;278:1399. doi: 10.1074/jbc.C200571200. [DOI] [PubMed] [Google Scholar]
- 30.Jaulin-Bastard F, et al. J Biol Chem. 2002;277:2869. doi: 10.1074/jbc.M109652200. [DOI] [PubMed] [Google Scholar]
- 31.Jaulin-Bastard F, et al. J Biol Chem. 2001;276:15256. doi: 10.1074/jbc.M010032200. [DOI] [PubMed] [Google Scholar]
- 32.Zarrinpar A, Park SH, Lim WA. Nature. 2003;426:676. doi: 10.1038/nature02178. [DOI] [PubMed] [Google Scholar]
- 33.We thank A. Tropsha for valuable suggestions and the Faculty of Arts and Sciences Center for Systems Biology for support with instrumentation and automation. This work was supported by awards from the Smith Family Foundation, the Arnold and Mabel Beckman Foundation, and the W. M. Keck Foundation and by a grant from the NIH (1 RO1 GM072872-01). M.A.S. was supported in part by the NIH Molecular, Cellular, and Chemical Biology Training Grant (5 T32 GM07598-25), and J.R.C. was the recipient of a Corning CoStar fellowship.