

Abstract
Recent developments in MALDI have enabled direct detection of lipids as intact molecular species present within cellular membranes. Abundant lipid-related ions are produced from the direct analysis of thin tissue slices when sequential spectra are acquired across a tissue surface that has been coated with a MALDI matrix. The lipid-derived ions can often be distinguished from other biomolecules because of the significant mass defect that these ions present due to the large number of covalently bound hydrogen atoms in hydrophobic molecules such as lipids. Collisional activation of the molecular ions can be used to determine the lipid family and often structurally define the molecular species. Specific examples in the detection of phospholipids, sphingolipids, and glycerolipids are presented with images of mouse brain and kidney tissue slices. Regional distribution of many different lipid molecular species and Na+ and K+ attachment ions often define anatomical regions within the tissues.
Keywords: mass spectrometric imaging, tissue imaging, brain phospholipids, kidney phospholipids, kidney triacylglycerol
Lipids constitute a large proportion of all organic molecules present within a cell; however, lipids have considerable diversity in chemical structure and biological function (1). For example, cells contain phospholipids organized into a bilayer structure that defines the outside plasma membrane of the cell as well as subcellular organelles, including the mitochondria and a dual bilayer surrounding the nucleus. Cholesterol is found predominately in the plasma membrane bilayer, while triacylglycerols (TAGs) are found in specialized storage compartments termed lipid droplets. The exact composition of lipids present within the cell is dynamic because of numerous pathways involved in their biosynthesis and turnover, though the relative lipid composition is fairly tightly regulated. Neither the distribution of lipid classes within tissue regions nor the distribution of specific lipid molecular species within tissue compartments and cell types is well understood. This is due, in part, to a dearth of available techniques that localize specific lipids within tissues while not altering the chemical structure of the lipids being studied. For example, in the central nervous system, which is highly enriched in lipid molecules, little is known about the precise distribution of lipid classes, such as phospholipids, sphingolipids, and glycerolipids, let alone about the individual molecular species, in distinct brain regions, such as the cerebellum, hippocampus, striatum, and cortex. The techniques generally used to identify lipids involve extraction of the lipids prior to analysis, which destroys information relevant to tissue location. While there are powerful techniques based on mass spectrometry that can identify and characterize lipids, mass spectrometric imaging (MSI) is an emerging technology that has surprising power to fill the missing gap in finding the location of specific lipids in animal and plant tissues (Fig. 1). This image of a mouse brain (Fig. 1A) was generated entirely from mass spectral data of the abundance of a single ion (m/z 772.5) corresponding to a unique phospholipid molecular species (see below). All ions and their abundances generated during this experiment, from m/z 500–900, are presented in Fig. 1B, and any of these ions could be used to construct an image.
Fig. 1.

A: Extracted ion image of m/z 772.5 for 16:0a/16:0 PC + K+ from a sagittal section of mouse brain. Data acquisition and image processing are described in Ref. 9. B: Total ion mass spectrum of all ions obtained in the MSI analysis of the tissue in A.
Much of the early development of MSI involved the use of ion beams focused on an inorganic surface that caused secondary ions to be emitted from the surface and enter a mass spectrometer for mass measurement [secondary ion mass spectrometry (SIMS)]. These experiments involved highly energetic primary ion beams, which decomposed organic molecules on surfaces. More recent experiments have attenuated the ion energy in SIMS through the use of ion clusters (2), buckminsterfullerene ion beams (3), and matrix-assisted SIMS (4) so that now relatively intact biomolecules, including lipids, can be generated and desorbed from biological tissues.
A paradigm shift to generate secondary ions from surfaces, including biological tissue slices, evolved with the implementation of MALDI. Many of the advances in MALDI-MSI, developed by Caprioli and coworkers (5, 6), have been applied to localization of peptides and proteins within tissues. This technique has been shown to generate abundant secondary ions from proteins in tissues, though only after lipids, which in many cases generate the most abundant ion current, were removed from the tissue. The formation of both positive and negative ions at the site of the laser spot is the result of the generation of an energetic plasma in which protons, electrons, neutral matrix molecules, and biomolecules from the underlying tissue are lifted from the target surface. The mass spectra (mass-to-charge ratio and intensity information) at a specific X,Y-coordinate translate to pixels in an image. The size of a pixel is largely determined by the laser spot size and the MALDI matrix crystal size. By sequentially acquiring mass spectra across the entire tissue surface, a database that is an assembly of four-dimensional information (X,Y-coordinates, m/z, and ion abundance) is recorded. An image revealing the distribution of a specific lipid molecular ion can be generated where grayscale or colors are used to designate molecular ion abundance of a specific lipid, e.g., [M+H]+ abundance of one phospholipid at each X,Y-position.
Considerable attention has been given to sample preparation and methods by which the MALDI-matrix is applied, with the goal to maximize secondary ion generation (7). Various matrix application methods have been examined, including a dried droplet approach, inkjet application, electrospray application, airbrush application, and most recently a “dusting” of the dry matrix onto the tissue (8). We found that depositing the matrix onto the tissue by direct sublimation of an organic matrix, such a 2,5-dihydroxybenzoic acid (9), is advantageous over applying the matrix from an organic solution because no solvent, which could dissolve target lipids in the tissue, is employed and the crystal size of the deposited matrix is extremely small. This method also results in a substantial increase in sensitivity.
MASS SPECTROMETRIC INSTRUMENTATION AND PERFORMANCE
A critical feature of MSI has been the instruments employed, where the most frequently used mass analyzer has been the time-of-flight (TOF) mass spectrometer. Current TOF instruments have excellent mass resolution and mass accuracy so that mass-to-charge values of the MALDI-MSI generated ions can be measured with mass accuracies of 50 ppm or better. For MALDI ions below m/z 1000, this accurate mass measurement can be used to calculate possible elemental compositions for the observed ion (see below). Knowledge of the elemental composition can greatly assist in the precise identification of the desorbed ions. TOF instruments also operate at an extraordinarily rapid mass spectrum acquisition speed, but most importantly, all ions generated by the MALDI ionization event are collected during TOF measurement and are not lost as they are in a scanning mass spectrometer (quadrupole mass filter). Another important instrumental feature of many MALDI-MSI studies has been the use of tandem mass spectrometers where multiple sectors are available for collisional activation studies. This capability further enhances the analysis of lipid ions desorbed from tissue slices by being able to structurally characterize ions by unique ion chemical behavior after collisional activation. Thus, a widely used instrument has been the tandem quadrupole-TOF instrument, which combines high mass resolution product ion measurement with collision induced dissociation (CID) of precursor ions. This is an area where lipid analysis has an important advantage over analysis of high molecular mass proteins, in that the relatively low masses of most lipid molecular ions (<1500 Da) are amenable to CID and structurally specific generation of product ions. The field of lipid analysis by tandem mass spectrometry has been very active, and the behavior of most lipid-derived ions has been explored (10, 11). Even though most studies of the CID behavior of such ions are carried out using electrospray ionization, the gas-phase chemical behavior is largely independent of how the ion was generated.
LIPID-DERIVED IONS FROM MALDI-MSI OF TISSUES
MALDI-MSI usually involves the study of thin tissue sections (<15 μm thickness). Images are typically generated with a lateral resolution of 25–100 μm. An important advance has been the use of oversampling of the target (overlapping the laser beam), which effectively increases the lateral resolution over the true laser spot size (12). When all of the spectra from a MALDI-MSI experiment are averaged (total ionization), abundant ions between m/z 300 and 1000 are observed and most have a high mass defect (the difference between molecular masses calculated from nominal mass numbers and from exact monoisotopic masses for each element in a chemical formula), e.g., m/z 796.5 corresponding to 16:0a/18:2-PC+K+ (Fig. 2). Ions of somewhat lesser abundance are observed between m/z 1000 and 2000, and many of these are derived from complex lipids, such as sphingolipids (10). The ion at m/z 369.3 is a product of cholesterol dehydration during the MALDI process, and its high abundance relative to the phospholipids may be due to cholesterol being a single molecular species found in the plasma membrane at high concentration. The image of cholesterol in a mouse kidney is shown in Fig. 3A. However, the signal for phospholipids is divided into the hundreds of different molecular species that make up this class of lipid found in the same cellular compartment as the cholesterol. It is interesting to note that a decomposition ion from cholesterol is observed [M+H–H2O]+ rather than [M+H]+ or [M+Na]+ at m/z 387.3 or 409.3, respectively.
Fig. 2.

Total ion mass spectrum from MALDI-MSI experiment of mouse kidney section.
Fig. 3.

MALDI-MSI ion images from a section of mouse kidney. Data acquisition and image processing are described in Ref. 9. A: m/z 369.3, [M+H–H2O]+, cholesterol. B: m/z 796.6 [16:0a/18:2-PC+K]+. C: m/z 862.6 [40:6-PC+H]+. D: m/z 879.7 [16:0/20:4/18:1-TAG+H]+.
Any of the ions observed can be used to construct an image, where the abundance of the ion is extracted from the mass spectrum recorded at that pixel. A specific example is the image generated for the ion m/z 796.6, identified as the K+ adduct of 16:0/18:2-PC (Fig. 3B). In this case, it appears that the abundance of this specific ion is relatively higher in the cortex and pelvic regions of the mouse kidney when compared with the medulla.
The intensity of a single ion, such as m/z 862.6 for 40:6-PC (Fig. 3C), is more evenly distributed throughout the kidney medulla and cortex but is not present in the pelvic region. Such images are profiles of individual phospholipid molecular species that are unequivocally present in that region. Their intensity may not solely reflect concentration, but possibly the relative ease of removing the phospholipid from the local environment. Phospholipid ionization and ion formation are somewhat different in the MALDI-MSI experiment in that abundant alkali metal adduct ions are often observed when compared with the [M+H]+ ions observed in the MALDI of pure lipids. This is no doubt due to the local intracellular concentration of Na+ and K+ in the tissue slices. This can be observed in the averaged mass spectrum (Fig. 1B) from a mouse brain section for one of the most abundant phosphatidylcholine lipids (16:0/18:1-PC), in which H+ at m/z 760.6, the Na+ adduct at m/z 782.6, and the K+ adduct at m/z 798.5 are all present. The use of MALDI-MSI for absolute lipid quantitation is problematic because signal intensities depend on the concentrations of lipids and adducting species, local environment, and differential ion yields relative to the matrix employed. Further research is necessary to make this analytical method quantitative.
Collisional activation of PC-derived [M+H]+ ions typically yield a major product ion at m/z 184 corresponding to the phosphocholine headgroup (11). However, when a phosphatidylcholine molecular species is metalated with either Na+ or K+, closely related but structurally quite different ions at m/z 147 and 163, respectively, are observed. In fact, these product ions become a diagnostic means by which metalated PC can be identified.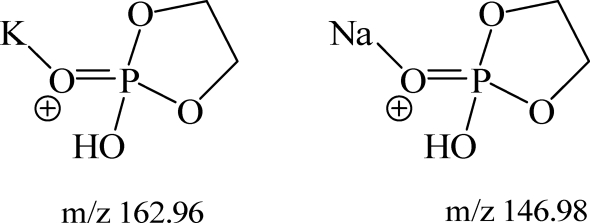
Another feature in the population of positive ions derived from phospholipids is the almost complete absence of [M+H]+ or alkali metal attachment ions from the other major phospholipid classes, such as phosphatidylethanolamine (PE), phosphatidylserine (PS) , phosphatidylinositol (PI), or phosphatidic acid (PA). While these species can be readily detected in the negative ion mode (see below), the positive ions are conspicuously absent. We think this is due to the facile decomposition of these phospholipid [M+H]+ ions to product ions that are observed between m/z 500 and 700. While it has been suggested that these ions may be derived from diacylglycerol (13), they could also be decomposition of phospholipids with the loss of the polar head group to form a “diglyceride” product ion during the MALDI process itself. In fact, these losses are quite abundant in the CID of PE, PS, phosphatidylglycerol (PG), and PA (14).
Glyceryl lipids can be observed in tissues, as exemplified by the abundant ions observed at higher masses. One example in the mouse kidney tissue is the image of m/z 879.7 (Fig. 3D). Collisional activation of this ion revealed product ions at m/z 623.5, 597.5, and 575.5, a behavior that was consistent with this ion being [M+H]+ from a triacylglycerol, and specifically 16:0/20:4/18:1-TAG (15). These TAG molecular species appeared to be outside the kidney itself and present as perirenal fat tissue.
LIPID CHARACTERIZATION IN MSI
A fundamental feature of most lipids, including phospholipids, is the relatively high mass defect that can be observed with an accurate mass measurement. This is due to the large number of hydrogen atoms that make up the fatty acyl chains of the esterified fatty acids. A commonly observed phospholipid in tissues is 16:0/18:1-PC with a [M+H]+ at m/z 760.5860 having the elemental composition of C42H83NO8P. Since there are 83 hydrogen atoms and each have an exact mass of 1.007825 Da, these 83 atoms contribute 83.6494 Da to the final mass of this ion. The 42 carbon atoms also add the interesting feature of the relatively high abundance of the ion observed at 1 Da higher in mass at m/z 761.5895 with an ion abundance of 47.1% compared with the abundance of the ion at m/z 760.5860 due to the abundance of carbon-13 found in nature (1.1% relative abundance).
It is of interest to find the possible number of elemental compositions for m/z 760.5860 within an error of 50 ppm in mass measurement (Table 1). If the calculation is restricted to limit composition and structure to at least one phosphorous atom and seven oxygen atoms, which are features of all phospholipids, only eight elemental compositions are within 50 ppm error. In this case, the correct calculated mass was within a 0.5 ppm error of the measured mass. The number of potential fits for the elemental composition is greatly reduced with higher mass accuracy (where accuracy is defined as the correctness of the measured mass to the actual mass of the ion), and for this reason high-performance mass spectrometers with sufficient mass resolution (where resolution is defined as the ability of the instrument to physically separate two ions from each other) to separate potentially interfering species can greatly improve the certainty of lipid characterization.
TABLE 1.
Possible elemental compositions for phospholipids observed as m/z 760.5860 listed as calculated mass, difference from the 760.5860 (mDa) and ppm Errora
| Formula | Calculated Mass | mDalton Error | ppm Error |
|---|---|---|---|
| C42H83NO8P | 760.5856 | 0.4 | 0.5 |
| C43H85O8P | 760.5982 | −12.2 | −16.0 |
| C41H81N2O8P | 760.5731 | 12.9 | 17.0 |
| C42H85N2O7P | 760.6094 | −23.4 | −30.8 |
| C42H81O9P | 760.5618 | 24.2 | 31.8 |
| C42H82O7P2 | 760.5536 | 32.4 | 42.6 |
| C43H87NO7P | 760.6220 | −36.0 | −47.3 |
| C41H79NO9P | 760.5492 | 36.7 | 48.3 |
Phospholipids have at least seven oxygen atoms and one phosphorus atom.
Lipids generate abundant negative ions during the MALDI-MSI experiment. For phospholipids, this is due the presence of the phosphodiester moiety that can exist as a very stable gas phase anion, especially for the acidic phospholipids PI, PA, PG, and PS. Other lipids, such as sphingomyelin (phosphodiester), sulfatides (sulfuric acid ester), and bacterial lipids related to lipid A (phosphate esters) yield quite abundant molecular anions [M–H]−. For some polyphosphate esters, doubly charged [M–2H]2− can also be observed.
The use of CID to identify lipids can be exemplified by the detection of two very different lipids (as negative ions) in the cerebellum of the mouse. The ion at m/z 888.6 appears to have a different, in fact opposite, intensity in the white versus the gray matter of the cerebellum (Fig. 4A). CID of m/z 888.6 revealed a product ion at m/z 97 (HSO3−) characteristic of sphingolipids of the sulfatide class (16). This species was identified from the accurate mass measurement and marked similarity of the observed CID mass spectrum to that previously published for the [M–H]− of d18:0/24:1-sufatide (ST). Another abundant negative ion in the cerebellum is m/z 885.6, which upon collisional activation (Fig. 4B) yielded product ions at m/z 303, 283, and 241, which were the expected ions formed following the CID of 18:0a/20:4-PI (17). Interestingly, the regional distribution of intensity of the PI molecular species was higher in the gray matter when compared with the white matter, and the relative abundance of the sulfatide was exactly opposite to that of the PI. MSI and TOF-SIMS have been used previously to generate images of sulfatide molecular species in the cerebellum (10, 18).
Fig. 4.

MALDI-MSI negative ion images and CID spectrum of selected ion from a sagittal section of mouse brain. A: CID spectrum of m/z 888.6 [d18:0/24:1-ST – H]−; the corresponding image for this ion is right of the mass spectrum. B: CID mass spectrum of m/z 885.6 [18:0a/20:4-PI – H]− and corresponding image of this ion.
CONCLUSIONS AND FUTURE DIRECTIONS
MALDI-MSI has emerged as a powerful technique that is particularly useful in the detection of a wide variety of lipids as they exist within tissues. Images suggest that regional differences in concentrations for specific molecular species are present in some tissues, although additional work is needed to determine if ion abundances truly reflect local concentrations or if other factors, such as cellular location and environment, play a significant role in secondary ion emission during the MALDI event. Further development of this approach may increase lateral resolution and mass spectrometric sensitivity so that lipids within the cell can be studied directly.
Abbreviations
CID, collision induced decomposition
MSI, mass spectrometric imaging
PC, phosphatidylcholine
PE, phosphatidylethanolamine
PI, phosphatidylinositol
PA, phosphatidic acid
PG, phosphatidylglycerol
PS, phosphatidylserine
SIMS, secondary ion mass spectrometry
ST, sufatide
TAG, triacylglycerol
TOF, time-of-flight mass spectrometry
This work was supported in part by the Lipid MAPS Large Scale Collaborative Grant from the National Institutes of Health (GM-069338).
Published, JLR Papers in Press, December 2, 2008.
References
- 1.Fahy E., S. Subramaniam, H. A. Brown, C. K. Glass, A. H. Merrill, Jr., R. C. Murphy, C. R. H. Raetz, D. W. Russell, Y. Seyama, W. Shaw, et al. 2005. A comprehensive classification system for lipids. J. Lipid Res. 46 839–862. [DOI] [PubMed] [Google Scholar]
- 2.Winograd N. 2005. The magic of cluster SIMS. Anal. Chem. 77 143A–149A. [Google Scholar]
- 3.Wucher A., J. Cheng, and N. Winograd. 2007. Protocols for three-dimensional molecular imaging using mass spectrometry. Anal. Chem. 79 5529–5539. [DOI] [PubMed] [Google Scholar]
- 4.McDonnell L. A., and R. M. Heeren. 2007. Imaging mass spectrometry. Mass Spectrom. Rev. 26 606–643. [DOI] [PubMed] [Google Scholar]
- 5.Hardesty W. M., and R. M. Caprioli. 2008. In situ molecular imaging of proteins in tissues using mass spectrometry. Anal. Bioanal. Chem. 391 899–903. [DOI] [PMC free article] [PubMed] [Google Scholar]
- 6.Cornett D. S., M. L. Reyzer, P. Chaurand, and R. M. Caprioli. 2007. MALDI imaging mass spectrometry: molecular snapshots of biochemical systems. Nat. Methods. 4 828–833. [DOI] [PubMed] [Google Scholar]
- 7.Chaurand P., J. L. Norris, D. S. Cornett, J. A. Mobley, and R. M. Caprioli. 2006. New developments in profiling and imaging of proteins from tissue sections by MALDI mass spectrometry. J. Proteome Res. 5 2889–2900. [DOI] [PubMed] [Google Scholar]
- 8.Puolitaival S. M., K. E. Burnum, D. S. Cornett, and R. M. Caprioli. 2008. Solvent-free matrix dry-coating for MALDI imaging of phospholipids. J. Am. Soc. Mass Spectrom. 19 882–886. [DOI] [PMC free article] [PubMed] [Google Scholar]
- 9.Hankin J. A., R. M. Barkley, and R. C. Murphy. 2007. Sublimation as a method of matrix application for mass spectrometric imaging. J. Am. Soc. Mass Spectrom. 18 1646–1652. [DOI] [PMC free article] [PubMed] [Google Scholar]
- 10.Chen Y., J. Allegood, Y. Liu, E. Wang, B. Cachón-Gonzalez, T. M. Cox, A. H. Merrill, Jr., and M. C. Sullards. 2008. Imaging MALDI mass spectrometry using an oscillating capillary nebulizer matrix coating system and its application to analysis of lipids in brain from a mouse model of Tay-Sachs/Sandhoff disease. Anal. Chem. 80 2780–2788. [DOI] [PubMed] [Google Scholar]
- 11.Murphy R. C., J. Fiedler, and J. Hevko. 2001. Analysis of nonvolatile lipids by mass spectrometry. Chem. Rev. 101 479–526. [DOI] [PubMed] [Google Scholar]
- 12.Jurchen J. C., S. S. Rubakhin, and J. V. Sweedler. 2005. MALDI-MS imaging of features smaller than the size of the laser beam. J. Am. Soc. Mass Spectrom. 16 1654–1659. [DOI] [PubMed] [Google Scholar]
- 13.Malmberg P., K. Borner, U. Chen, P. Friberg, B. Hagenhoff, J-E., Mansson, and H. Nygren. 2007. Localization of lipids in the aortic wall with imaging TOF-SIMS. Biochim. Biophys. Acta. 1771 185–195. [DOI] [PubMed] [Google Scholar]
- 14.Pulfer M., and R. C. Murphy. 2003. Electrospray mass spectrometry of phospholipids. Mass Spectrom. Rev. 22 332–364. [DOI] [PubMed] [Google Scholar]
- 15.McAnoy A. M., C. C. Wu, and R. C. Murphy. 2005. Direct qualitative analysis of triacylglycerols by electrospray mass spectrometry using a linear ion trap. J. Am. Soc. Mass Spectrom. 16 1498–1509. [DOI] [PubMed] [Google Scholar]
- 16.Hsu F. F., and J. Turk. 2004. Studies on sulfatides by quadrupole ion-trap mass spectrometry with electrospray ionization: structural characterization and the fragmentation processes that include an unusual internal galactose residue loss and the classical charge-remote fragmentation. J. Am. Soc. Mass Spectrom. 15 536–546. [DOI] [PubMed] [Google Scholar]
- 17.Hsu F. F., and J. Turk. 2000. Characterization of phosphatidylinositol, phosphatidylinositol-4-phosphate, and phosphatidylinositol-4,5-bisphosphate by electrospray ionization tandem mass spectrometry: a mechanistic study. J. Am. Soc. Mass Spectrom. 11 986–999. [DOI] [PubMed] [Google Scholar]
- 18.Pernber Z., K. Richter, J. E. Mansson, and H. Nygren. 2007. Sulfatide with different fatty acids has unique distributions in cerebellum as imaged by time-of-flight secondary ion mass spectrometry (TOF-SIMS). Biochim. Biophys. Acta. 1771 202–209. [DOI] [PubMed] [Google Scholar]