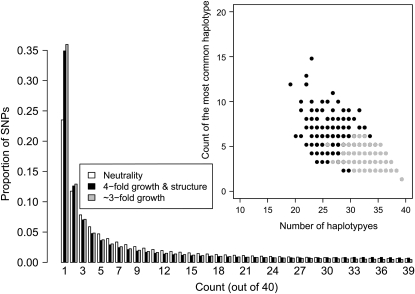
Figure 7.—
Comparison of the expected SFS for population growth with ancestral structure to that expected with just population growth. The inset shows the frequency of the most common haplotype vs. the number of haplotypes for each simulated window for the same two demographic models. Note that the SFSs for the two models appear similar, but that there is an excess of windows with fewer haplotypes and where the most common haplotype is at high frequency in the growth with ancestral structure model (see discussion).

