

Abstract
Direct regulation of T cell function by microbial ligands through Toll-like receptors (TLR) is an emerging area of T cell biology. Currently either immunomagnetic cell sorting (IMACS) or fluorescence-activated cell sorting (FACS), are utilized to isolate T-cell subsets for such studies. However, it is unknown to what extent differences in T cell purity between these isolation techniques influence T cell functional assays. We compared the purity, response to mitogen, activation requirements, and response to TLR ligands between human CD4+ T cells isolated either by IMACS (IMACS-CD4+) or by IMACS followed by FACS (IMACS/FACS-CD4+). As expected, IMACS-CD4+ were less pure than IMACS/FACS-CD4+ (92.5% +/− 1.4% versus 99.7% +/− 0.2%, respectively). Consequently, IMACS-CD4+ proliferated and produced cytokines in response to mitogen alone and had lower activation requirements compared to IMACS/FACS-CD4+. In addition IMACS-CD4+ but not IMACS/FACS-CD4+ responses were upregulated by the TLR-4 ligand lipopolysaccharide (LPS). On the other hand, TLR-2 and TLR-5 engagement induced costimulation in both IMACS-CD4+ and highly purified IMACS-/FACS-CD4+. Altogether these results indicate that small differences in cell purity can significantly alter T cell responses to TLR ligands. This study stresses the importance of a stringent purification method when investigating the role of microbial ligands in T cell function.
Keywords: CD4+ T cell purification, Cellular activation, Toll like receptors
Introduction
Isolation of human or mouse T cell subsets from peripheral blood can be carried out by two mainstream methods: immunomagnetic cell sorting (IMACS) and fluorescence-activated cell sorting (FACS). Immunomagnetic cell sorting is fast, relatively inexpensive and does not require state of the art technology (Miltenyi et al., 1990). On the other hand, FACS requires sophisticated technology, highly trained personnel, is time consuming and expensive, and may result in significant cell loss.
For most studies of T cell function, IMACS renders considerably pure T cell preparations (Semple et al., 1993; Stanciu et al., 1996). However, some experimental systems may require a degree of T cell purity unattainable with IMACS. Currently, there are at least two areas of T cell biology where stringent purification of primary T cells may be necessary: a) analysis of regulatory T cell (Treg) function; b) studies of direct effects of microbial molecules, such as Toll-like receptor (TLR) ligands, on T cell function. Baecher-Allan et al., (2005) for example, demonstrated important functional differences between IMACS- and FACS- isolated human Tregs. Expression and function of specific TLRs has been reported in mouse and human T cells; however the type of TLR expressed and their functional relevance in T cells is controversial (Babu et al., 2006; Caron et al., 2005; Crellin et al., 2005; Gelman et al., 2004; Hornung, et al., 2002; Imanishi et al., 2007; Komai-Koma et al., 2004; Peng et al., 2005). These controversies may arise from differences in T cell purification strategies. In these studies, contaminating antigen presenting cells (APC) and other accessory cells may drastically affect T cell function and response to TLR agonists by providing costimulation or secreting cytokines. In studies of TLR expression, contaminating cells can cause false positive results.
Despite the potential impact of cell purity on T cell studies, systematic comparisons of T cell function following different purification methods are scarce. To address this, we purified human CD4+ T cells by IMACS alone (IMACS-CD4+) or IMACS followed by FACS (IMACS/FACS-CD4+) and compared activation requirements, i.e. TCR signal strength and costimulation, of the two resulting populations. In addition, we studied the effect of ligands for TLR-2, TLR-3, TLR-4, TLR-5, TLR-7/8, and TLR-9 on the proliferation and cytokine secretion of CD4+ T cells obtained by these two methods. We found that IMACS-CD4+ responded to phytohemagglutinin (PHA) and to anti-CD3 monoclonal antibody (mAb) alone while IMACS/FACS-CD4+ required an exogenous costimulatory signal. IMACS-CD4+ responses to anti-CD3/anti-CD28 were upregulated by TLR-2, TLR-4, and TLR-5 ligands. On the other hand, TLR-2 and TLR-5 engagement but not TLR-4 engagement provided costimulatory signals for IMACS/FACS-CD4+. This study demonstrates that small differences in accessory cell contamination between IMACS-CD4+ and IMACS/FACS-CD4+ significantly affect their response to polyclonal stimulation and TLR ligands.
Materials & Methods
Cell isolation and culture
Human peripheral blood mononuclear cells (PBMC) were isolated from 180cc of blood from 8 healthy donors (18– 45 year old) recruited among laboratory staff. All protocols were approved by Case Western Reserve University’s institutional review board. Informed written consent was obtained from all participants. PBMC were isolated by density gradient centrifugation over sodium diatrizoate/hypaque (GE HealthCare, Uppsala, Sweden).
CD4+ T cells were isolated from PBMC using a magnetic CD4 negative selection kit and LS columns, with strict adherence to the manufacturer’s instructions (Miltenyi Biotec Inc, Auburn, CA). CD4+ T cells obtained by magnetic sorting were divided in 3 groups, one that was directly used in the T cell assays (IMACS-CD4+) and two that were subjected to further isolation with two different FACS protocols (FACS-1 and FACS-2). For FACS-1 protocol, IMACS-CD4+ were labeled with allophycocyanin (APC)- conjugated anti-CD4 and phycoerythrin (PE)-conjugated anti-CD3 (clone SK7); FSC/SSC gates were drawn on intact lymphocytes and CD4+CD3+ cells were sorted (IMACS/FACS-1-CD4+). For FACS-2 protocol IMACS-CD4+ were labeled with APC- conjugated anti-CD4 plus a cocktail of PE labeled mAbs (anti-CD19, anti-CD123, anti-CD1c, anti-CD14 and anti-CD56); FSC/SSC gates were drawn on intact lymphocytes and CD4+ (CD19, CD123, CD1c, CD14, CD56)negative cells were sorted (IMACS/FACS-2-CD4+). Anti-CD4 APC, anti-CD3 PE, anti-CD14 PE, anti-CD56 were purchased from BD Biosciences, San Jose, CA; anti-CD19 PE, anti-CD123 PE were from eBioscience, San Diego, CA; anti-CD1c PE was from Miltenyi Biotec Inc. FACS sorting was performed using a BD FACSAria Cell-Sorting System (BD Biosciences). Monocytes were isolated by negative selection using the pan CD14+ cell isolation kit II (Miltenyi Biotec Inc).
Cells were cultured in serum free medium (X-VIVO 15, Lonza, Walkersville, MD) supplemented with 20 mM HEPES, 2 mM L-glutamine, 1 mM sodium pyruvate, 0.1 mM non-essential amino acids (BioWhittaker, Walkersville, MD), 100 U/ml penicillin and 100 μg/ml streptomycin, (Lonza, Walkersville, MD) in 96-well flat-bottom plates (Becton Dickinson, Franklin Lakes, NJ) at 37°C in 5% CO2.
Flow cytometric analysis of cell surface markers
Lymphocyte subsets, NK cells, B cells, monocytes and dendritic cells were assessed at baseline in PBMCs and after cell sorting with the following mAbs: anti-CD3-PE (IMACS-CD4+, IMACS/FACS-1-CD4+, PBMC), anti-CD3-FITC (IMACS/FACS-2-CD4+), anti-CD4-APC, anti-Vδ2 FITC, anti-CD8 FITC, anti-CD56 FITC, anti-CD19 FITC, anti-CD19 PerCP, anti-CD14 PE, anti-CD1c PE, anti-CD123 PE and anti-HLA-DR APC (anti-CD3 FITC, anti-Vδ2 FITC, anti-CD8 FITC, anti-CD56 FITC from BD Biosciences; anti-HLA-DR APC, anti-CD19 FITC, anti-CD19 PerCP from Caltag, Burlingame, CA). Cell surface expression of TLR-2 and TLR-4 was assessed immediately following T cell isolation with IMACS-CD4+ and IMACS/FACS-2-CD4+ protocols with anti-TLR-4-PE or anti-TLR-2.5-PE (eBioscience). Expression of CD25 (anti-CD25-FITC, BD Biosciences) was assessed at two time-points: 1) immediately following T cell isolation with IMACS or IMACS/FACS protocols (baseline); 2) following 18 h rest in cell culture medium with or without 10 μg/ml of PHA (Sigma-Aldrich, St. Louis, MO) at 37°C in 5% CO2. Cells were acquired using a FACSCalibur flow cytometer (BD Bioscience) using Cellquest software(BD Bioscience). Ten thousand events were recorded for each cell surface marker. The cutoff lines for positive and negative fluorescence were set manually based on the distribution of cells stained with APC, FITC and PE- conjugated isotype controls, and was kept constant within each experiment. Further analysis was performed using FlowJo Software (Tree Stop, Stanford University, CA).
Assessment of cell viability
Non-viable cells were detected following each isolation protocol by propidium iodide incorporation using the dead cell discriminator kit (Caltag, Invitrogen, Carlsbad, CA) and by trypan blue exclusion method.
T cell stimulation and proliferation assay
CD4+ T cells (105/well) were cultured in the presence of medium alone or 10 μg/ml PHA in presence or absence of 3 × 10³, 12 × 103, or 48 × 103 autologous CD14+ cells. Alternatively, CD4+ T cells (105/well) were stimulated with 1 to 10 μg/ml of plate-bound anti-CD3 mAb (clone HIT3a, BD Bioscience) with or without 5 μg/ml soluble anti-CD28 mAb (clone CD28.2, BD Bioscience). In selected experiments, anti-CD3/anti-CD28 stimulated- CD4+ T cells were treated with or without 0.625–10 μg/ml of Pam3Cys-ser-Lys4 (Pam3cys) (EMC Microcollections GmbH, Tuebingen, Germany), 0.125–2 μg/ml of lipopolysaccharide (LPS), 5 μg/ml of Poly (I:C), 5 μg/ml of CpG, 1 μg/ml of flagellin, or 1 μg/ml of thiazoloquinoline (Invivogen, San Diego, CA). All conditions were performed in triplicate. CD4+ T cells were incubated for 72–120 hours in 96-well flat-bottom plates (Becton Dickinson). Cell-free culture supernatants (100 μl) were collected at 18 h (interleukin-2, IL-2) and 72–120 h (interferon-gamma, IFN-γ) for cytokine quantification by enzyme-linked immunosorbent assay (ELISA). Cells were pulsed during final 16 hours of culture with 1 μCi/well [3H]thymidine (Amersham Pharmacia Biotech). [3H]thymidine incorporation was measured by liquid scintillation counting, and results expressed as mean counts per minute (CPM) of triplicate values.
Cytokine quantification
IL-2 was measured using a commercial kit following manufacturer’s instructions (“Ready-set-go human IL-2 detection kit”, eBioscience). IFN-γ was determined in culture supernatants by sandwich ELISA with the anti- IFN-γ Ab pairs M-700A and biotinylated M-701B (Thermo Scientific, Rockford, IL).
Statistical analysis
Statistical analyses were performed using the paired Student’s t test. P values <0.05 were considered significant. Results are expressed as means ± SEM. For the analysis of data from multiple donors, the data underwent logarithmic transformation due to the non-normal distribution of values.
Results
Comparison of CD4+ T cell yield and purity between IMACS and IMACS/FACS
CD4+ T cells were isolated by IMACS alone or IMACS followed by FACS. Because anti-CD3 mAb have the potential to either activate or block T cells, FACS purifications were done with or without anti-CD3 mAb. CD4 mAb was used for both FACS protocols and either anti-CD3 mAb (FACS-1) or a cocktail of mAbs directed to APCs and other accessory cells (FACS-2). CD4+ T cell percent yield and purity were compared among the three different isolation methods, i.e. IMACS, IMACS/FACS-1 and IMACS/FACS-2. The percentage of CD3+CD4+ T cells in PBMC and purified populations was determined by flow cytometry and viable cell numbers were determined by trypan blue exclusion method. Cell viability was also assessed by propidium iodide incorporation. No differences in cell viability were detected after isolation with different protocols. Percent CD3+CD4+ T cell yield was calculated as follows: (number of CD3+CD4+ in purified preparation/number of CD3+CD4+ in PBMC) x 100. IMACS alone resulted in a significantly higher yield of CD3+CD4+ T cells from PBMC compared to IMACS/FACS, with an average CD4+ T cell recovery of 61.4% ± 12 and 29.3% ± 9.3, respectively (Table I). FACS isolation after IMACS with either FACS protocol yielded 52% ± 16 of the CD3+ CD4+ T cells present in the starting IMACS samples.
Table I.
Percent yield and purity of CD3+CD4+ T cells isolated with three different protocols
| IMACS | IMACS/FACS-1 | IMACS/FACS-2 | ||||||
|---|---|---|---|---|---|---|---|---|
| Yield | Purity | Yield | Purity | Yield | Purity | |||
| PBMC* | CD3+ CD4+ | PBMC* | IMACS** | CD3+CD4+ | PBMC* | IMACS** | CD3+CD4+ | |
| Donor 1 | 44.8% | 92.6% | 30.6% | 76.1% | 99.4% | 30.6% | 76.1% | 99.7% |
| Donor 2 | 60.0% | 94.6% | 19.6% | 33.6% | 99.8% | 17.4% | 29.8% | 99.7% |
| Donor 3 | 71.2% | 93.4% | 29.1% | 43.0% | 100% | 35.6% | 52.4% | 99.6% |
| Donor 4 | 78.0% | 90.8% | 46.0% | 64.4% | 99.8% | 42.5% | 59.4% | 99.5% |
| Donor 5 | 53.2% | 91.3% | 20.6% | 42.8% | 99.4% | 20.6% | 42.8% | 99.4% |
| Mean ± SD† | 61.4 %± 12 | 92.5% ± 1.4 | 29.2% ± 9.5 | 52% ± 15.7 | 99.7% ± 0.2 ‡ | 29.3% ± 9.3 | 52.1% ± 15.6 | 99.6% ± 0.1‡ |
Yield PBMC= (number purified CD3+CD4+/number CD4+CD3+ in PBMC) x 100
Yield IMACS= (number CD3+CD4+ isolated by FACS/number of CD3+CD4+ in IMACS) x 100
SD= standard deviation
p<0.001 IMACS vs. IMACS/FACS-1 or IMACS vs. IMACS/FACS-2.
T cells isolated by IMACS followed by either FACS protocol were significantly more pure (99.7% ± 0.2 and 99.6% ± 0.1; n= 5) than cells isolated by IMACS alone (92.5% ± 1.4, n=5; p <0.001; Table I, Figure 1). There was no significant difference in cell purity between the two FACS protocols (Table I). Our data indicates that FACS isolation following IMACS decreases the CD4+ T cell yield but significantly increases cell purity and this may have an impact in T cell activation assays.
Figure 1. Isolation of CD3+CD4+ T cells by IMACS followed by FACS.

CD4+ T cells were purified from PBMC of healthy donors using negative selection by IMACS followed by one of two different FACS protocols, IMACS/FACS-1 and IMACS/FACS-2. IMACS-FACS-1 isolated CD3+CD4+ cells. IMACS/FACS-2 isolated CD4+ cells and excluded CD19+, CD123+, CD1c+, CD14+ and CD56+ cells. Following each purification step, cells were labeled with anti-CD3 and anti-CD4 mAbs and percent CD3+CD4+ cells was calculated in PBMC (52.2%, A), IMACS (94.7%, B) IMACS/FACS-1 (99.8%, C) and IMACS/FACS-2 (99.7%, D). One representative experiment of five using PBMC isolated from separate donors is shown.
Identification of contaminating cells within IMACS purified population
Flow cytometry analysis of cells obtained by IMACS was performed to identify contaminating cell populations (data not shown). CD14+ cells were identified consistently among IMACS-CD4+ from 5 different donors (2.4% ± 1.4). Gamma-delta T cells (Vδ2+ T cells) represented 1.3% ± 0.4 of IMACS isolated cells (n=3). Other cell subsets including NK cells (CD56+), plasmacytoid dentritic cells(CD123 + HLA DR+ CD14− CD19−), myeloid dendritic cells (CD1c + HLA DR+ CD14− CD19−), CD8 + T cells, and B cells (CD19+) represented 0.7% or less of IMACS-CD4+ (n=3). Overall, there was a high level of variability in the type and percentage of contaminating cells among donors.
Proliferation, cytokine secretion, and CD25 expression in IMACS-CD4+ and IMACS/FACS-CD4+ in response to mitogen
PHA is a mitogen that requires accessory cells to induce T cell activation (de Vries, et al., 1979; Kern et al., 1985; Kern et al., 1986; Rosenstreich, et al., 1976). CD14+ cells were the most common contaminant of IMACS-CD4+ preparations. Therefore we compared proliferation, cytokine secretion, and expression of CD25 between cells isolated by IMACS, IMACS/FACS-1 and IMACS/FACS-2 in response to PHA to evaluate the functional relevance of CD14+ contamination in IMACS-CD4+. IMACS-CD4+ had strong proliferation and secreted IL-2 and high levels of IFN-γ in response to PHA, whereas IMACS/FACS-CD4+ did not secrete either cytokine and did not proliferate in response to PHA (n=5, Figure 2). Expression of CD25 was assessed at two time points: 1) immediately following T cell isolation with IMACS or IMACS/FACS protocols (baseline); 2) following 18 h rest in cell culture medium with or without 10 μg/ml of PHA. At baseline, expression of CD25 was comparable in IMACS-CD4+ and IMACS/FACS cells (2.2% ± 0.6% versus 0.97% ± 0.4%, respectively). As shown in Table-II, PHA induced upregulation of CD25 in IMACS-CD4+ (no PHA= 5.2% ± 1.9% versus PHA= 31.6% ± 16%) but not in IMACS/FACS-CD4+ (no PHA= 8.2% ± 1.7% versus PHA= 8.6% ± 2.2%). This difference in PHA induced- upregulation of CD25 expression between the two populations was statistically significant (p<0.05, n=3). We found no significant difference in responses to PHA between IMACS/FACS-1-CD4+ and IMACS/FACS-2-CD4+ (data not shown) and thus these results were combined for statistical analysis.
Figure 2. In absence of exogenously added accessory cells, PHA induces proliferation and cytokine secretion in IMACS-CD4+ but not in IMACS/FACS- CD4+T cells.

CD4+ T cells were purified by IMACS (IMACS) or by IMACS followed by FACS (IMACS/FACS). CD4+ T cells (105 cells/well) were stimulated with medium alone (white bars) or PHA (10 μg/ml, grey bars) in flat bottom 96 well plates. (A) IL-2 was quantified in cell-free culture supernatants (18h) by ELISA. (B) IFN-γ was quantified in cell-free culture supernatants (72h) by ELISA. (C) Proliferation was measured at 72 h by [3H] thymidine incorporation and results expressed as counts per minute (CPM). Mean values ± SEM of 5 experiments with separate donors are shown.
We next determined the number of exogenous CD14+ cells required to restore IMACS/FACS-CD4+ responses to PHA to the levels of IMACS-CD4+. We found that addition of 3 × 10³ CD14+ cells per 1 × 10⁵ IMACS/FACS-CD4+ nearly restored their proliferation and cytokine secretion to that of IMACS-CD4+ (n=2, Figure 3). The restoration of IMACS/FACS-CD4+ T cell proliferation and cytokine secretion with the addition of exogenous CD14+ cells indicated that T cells retain viability and function after purification. Our data demonstrate that as little as 3% CD14+ cell contamination confers purified T cells the ability to respond to PHA. Therefore minimal contamination of T cell preparations with CD14+ cells can significantly alter T cell activation and downstream functions such as proliferation and cytokine secretion. Interestingly, maximum CD4+ T cell proliferation is reached with re-addition of low number of accessory cells while maximum cytokine secretion requires the presence of high numbers of accessory cells. This indicates that T cell division in response to mitogen requires lower levels of costimulation than cytokine secretion.
Figure 3. Addition of CD14+ cells restores PHA- induced proliferation and cytokine secretion in IMACS/FACS-CD4+.

CD4+ T cells were purified by IMACS (IMACS) or by IMACS followed by FACS (IMACS/FACS). CD4+ T cells (105 cells/well) were stimulated with PHA (10 μg/ml) with or without addition of increasing numbers of autologous monocytes (CD14+) in flat bottom 96 well plates. (A) IL-2 was quantified in cell-free culture supernatants (18h) by ELISA. (B) IFN-γ was measured in cell-free culture supernatants (72h) by ELISA. (C) Proliferation was measured at 72h by [3H] thymidine incorporation and results expressed as CPM. Mean values ± SD of triplicates from a representative experiment of two are shown.
Proliferation and cytokine secretion profiles of IMACS-CD4+ and IMACS/FACS-CD4+ in response to anti-CD3 stimulation
To determine if IMACS-CD4+ and IMACS/FACS-CD4+ have different T cell receptor (TCR) signal strength and exogenous costimulation requirements for activation, we stimulated cells with increasing amounts of plate bound anti-CD3 mAb with or without soluble anti-CD28 mAb. Because there was no statistically significant difference in response to any amount of anti-CD3 mAb between IMACS/FACS-1-CD4+ and IMACS/FACS-2-CD4+ (p>0.05, data not shown) these results were combined for statistical analysis. We found that IMACS-CD4+ proliferated and secreted low but detectable levels of IL-2 and IFN-γ in response to anti-CD3 in absence of anti-CD28. On the other hand, IMACS/FACS-CD4+ did not respond to anti-CD3 stimulation in absence of costimulatory stimulus (Figure 4A, B, C).
Figure 4. IMACS-CD4+ produce cytokines and proliferate in response to anti-CD3 mAb in absence of exogenously added costimulation.

CD4+ T cells were purified by IMACS (IMACS) or IMACS followed by FACS (IMACS/FACS) and cultured (105 cells/well) in anti-CD3 coated- flat-bottom 96 well plates (10 μg/ml). ( IL-2 was quantified in cell- A) free culture supernatants (18h) by ELISA. (B) IFN-γ was measured in cell-free culture supernatants (120h) by ELISA. (C) Proliferation was determined in 120h cultures by [3H] thymidine incorporation and results expressed as CPM. Mean values ± SEM of 5 experiments with separate donors are shown.
In presence of exogenous costimulation (anti-CD28, 5 μg/ml), the TCR signal strength required to trigger maximum proliferation was 3 times lower for IMACS-CD4+ compared to IMACS/FACS-CD4+ (Figure 5C). IMACS/FACS-CD4+ proliferative response was restored to the levels of IMACS-CD4+ with high concentrations of anti-CD3 plus anti-CD28 (Figure 5C). On the other hand, even with a strong TCR signal (anti-CD3, 10 μg/ml) plus exogenous costimulation (anti-CD28, 5 μg/ml), IMACS/FACS-CD4+ displayed much lower cytokine responses compared to IMACS-CD4+ (Figure 5A, B). These results suggest that cytokine secretion by resting human CD4+ T cells requires additional costimulatory signals besides anti-CD28 that are not present in a highly purified T cell population.
Figure 5. IMACS- and IMACS/FACS- CD4+ T cells differ in their costimulation requirements for proliferation and cytokine secretion.
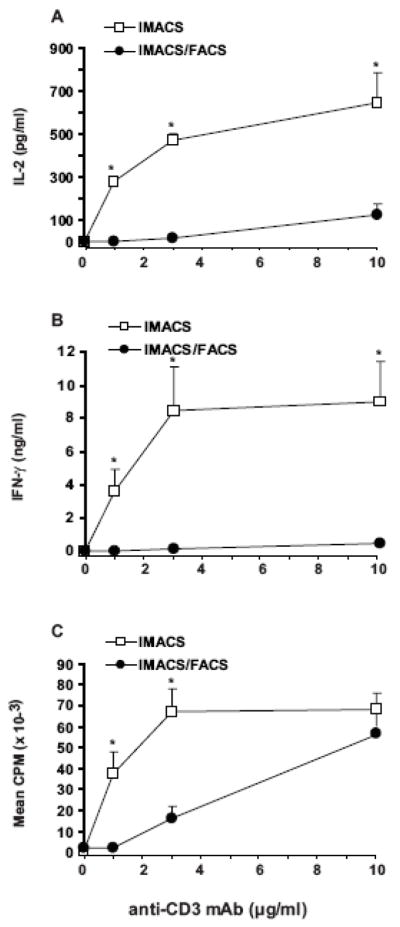
CD4+ T cells were purified by IMACS or IMACS/FACS and cultured (105cells/well) in anti-CD3 coated (1–10 μg/ml) flat-bottom 96 well plates with soluble anti-CD28 (5 μg/ml). (A) IL-2 was quantified in cell-free culture supernatants (18h) by ELISA. (B) IFN-γ was quantified in cell-free culture supernatants (120h) by ELISA. (C) Proliferation was measured at 120h by [3H] thymidine incorporation and results expressed as CPM. Mean values ± SEM of four experiments with separate donors are shown. Statistically significant differences between IMACS and IMACS/FACS values are indicated (*p <0.05).
Our data demonstrate that highly purified resting human CD4+ T cells have stringent costimulation requirements. These requirements could be underestimated in presence of contaminating accessory cells in magnetically sorted T cell preparations.
Effect of the TLR-4 agonist LPS on costimulation of IMACS-CD4+ and IMACS/FACS-CD4+
TLRs are expressed on cells of the innate immune system such as macrophages and dendritic cells (Brightbill et al., 1999; Gehring et al, 2003; Kodowaki et al., 2001; Pecora et al, 2006; Scanga et al., 2002). Recent evidence suggests that T cells also express and respond to selective TLRs when combined with a TCR stimulus (Iho et al., 1999; Komai-Koma, et al, 2004; Babu et al., 2006; Caron et al., 2005). However, because different isolation techniques are used, T cell purity varies across studies. Therefore is not clear if TLR ligands affect T cells directly or indirectly through effects on contaminating accessory cells. We investigated the effects of the TLR-4 ligand LPS in CD4+ T cells isolated by IMACS or by IMACS/FACS. We compared cell surface expression of TLR-4, as well as proliferation and cytokine secretion of IMACS-CD4+ and IMACS/FACS-CD4+ stimulated with plate bound anti-CD3 mAb (10 μg/ml) with or without suboptimal concentrations of anti-CD28 mAb (1 μg/ml) plus LPS (0.125–2 μg/ml). TLR-4 expression was significantly higher on cell isolated by IMACS compared to IMACS/FACS (2.3% ± 0.5% versus 0.3% ± 0.1%; p<0.05, n=3). TLR-4 expression on T cells was not altered by the isolation procedure and differences in TLR-4 expression between the two populations were secondary to presence of contaminating accessory cells present in IMACS-CD4+ preparations (data not shown). In the absence of anti-CD28, LPS upregulated IMACS-CD4+ responses to anti-CD3 but had no effect on IMACS/FACS-CD4+ responses (Figure 6A–C). Moreover, we found that LPS significantly increased proliferation and cytokine responses to anti-CD3 plus anti-CD28 by IMACS-CD4+, while it had no effect on IMACS/FACS-CD4+ responses (Figure 6D–F). Taken together these data indicates that LPS has no direct effect on CD4+ T cell proliferation or cytokine production. Instead, LPS likely upregulates activation of magnetically purified CD4+ T cells indirectly, by increasing the costimulatory function of contaminating accessory cells.
Figure 6. TLR-4 ligand LPS increases proliferation and cytokine secretion in IMACS- CD4+ but has no effect on IMACS/FACS-CD4+.

CD4 + T cells were purified by IMACS or IMACS/FACS and cultured (105 cells/well) in anti-CD3 coated- flat-bottom 96 well plates without (A–C) or with (D–F) soluble anti-CD28 (1 μg/ml) and different concentrations of LPS. (A, D) IL-2 was quantified in cell-free culture supernatants (18h) by ELISA. (B, E) IFN-γ was quantified in cell-free culture supernatants (72h) by ELISA. (C, F) Proliferation was measured at 72 hours by [3H]thymidine incorporation and results expressed as CPM. Mean values ± SD of triplicates from a representative experiment of two are shown.
Effect of the TLR-2 agonist Pam3cys on costimulation of IMACS-CD4+ and IMACS/FACS-CD4+
Recent evidence supports a role for TLR-2 signaling in human T cell costimulation (Komai-Koma et al., 2004; Caron et al., 2005; Babu et al., 2006). Therefore we compared cell surface expression of TLR-2, as well as the effect of the TLR-2 ligand Pam3cys on anti-CD3 ± anti-CD28 induced-proliferation and cytokine secretion between IMACS-CD4+ and IMACS/FACS-CD4+. Both cell populations demonstrate low TLR-2 expression immediately following isolation; differences between IMACS-CD4+ and IMACS/FACS-CD4+ were small and not statistically significant (2.9% ± 0.8% versus 1.5% ± 0.2%, p>0.05, n=3). This small difference was secondary to TLR-2 expression on contaminating accessory cells present in IMACS-CD4+ preparations (data not shown). In the absence of anti-CD28, Pam3cys upregulated anti-CD3 triggered proliferation and cytokine production in IMACS-CD4+ (Figure 7A–C). On the other hand, Pam3cys increased IMACS/FACS-CD4+ proliferation in response to anti-CD3 but had no effect on cytokine production (Figure 7A–C). When T cell responses to anti-CD3 plus suboptimal concentrations of anti-CD28 were tested, Pam3cys upregulated both IMACS-CD4+ and IMACS/FACS-CD4+ proliferation, IL-2 and IFN-γ secretion (Figure 7E–G). Taken together these data indicate that TLR-2 functions as a costimulatory receptor in human CD4+ T cells. However, CD4+ T cell costimulation by TLR-2 may require secondary costimulatory stimuli to trigger cytokine production. These additional costimulatory signals may be generated by contaminating accessory cells in IMACS-CD4+ that express TLR-2.
Figure 7. TLR-2 ligand Pam3cys upregulates proliferation and cytokine secretion of both IMACS-CD4+and IMACS/FACS-CD4+.

CD4+ T cells were purified by IMACS or IMACS/FACS and cultured (105 cells/well) in anti-CD3 coated- flat-bottom 96 well plates without (A–C) or with (D–F) soluble anti-CD28 (1 μg/ml) and different concentrations of Pam3cys. (A, D) IL-2 was quantified in cell-free culture supernatants (18h) by ELISA. (B, E) IFN-γ was measured in cell-free culture supernatants (72h) by ELISA. (C, F) Proliferation was measured at 72 hours by [3H] thymidine incorporation and results expressed as CPM. Mean values ± SD of triplicates from one representative experiment of two are shown.
Effect of TLR-3, TLR-5, TLR-7/8, and TLR-9 agonists on costimulation of IMACS-CD4+ and IMACS/FACS-CD4+
In addition to TLR-2, TLR-5 and TLR-7/8 (Caron et al., 2005) and TLR-9 (Iho et al., 1999, Hornung et al., 2002) have been shown to deliver costimulatory signals to T cells. We compared the effects of poly I:C (TLR-3), flagellin (TLR-5), thiazoloquinoline (TLR-7/8) and CPG (TLR-9) on anti-CD3 ± anti-CD28 induced-proliferation and cytokine secretion between IMACS-CD4+ and IMACS/FACS-CD4+. TLR-3, TLR-7/8, and TLR-9 ligation had no costimulatory effects on either IMACS-CD4+ or IMACS/FACS-CD4+ (n=2, data not shown). On the contrary, the TLR-5 agonist flagellin had costimulatory effects comparable to the TLR-2 ligand Pam3Cys. Treatment of both IMACS-CD4+ and IMACS/FACS-CD4+ with flagellin triggered upregulation of anti-CD3 + anti-CD28 induced- proliferation and cytokine secretion. Proliferative responses to anti-CD3 alone were upregulated by flagellin in both IMACS/FACS-CD4+ and IMACS-CD4+ while cytokine responses were increased in IMACS-CD4+ but not in IMACS/FACS-CD4+ (data not shown, n=2). As observed with TLR-2, our data suggests that CD4+ T cell costimulation by TLR-5 may require secondary costimulatory stimuli to trigger cytokine production.
Discussion
Direct regulation of T cell function by microbial molecules is a developing field of T cell biology (Rojas et al., 2006; Shabaana et al., 2005; Gerke et al., 2005; Sloan et al., 2006). Recently TLR expression has been reported on human and mouse primary T cells. However, significant variability in both expression and function of different TLRs has been reported across different studies (Babu et al., 2006; Caron et al., 2005; Crellin et al., 2005; Gelman et al., 2004; Hornung, et al., 2002; Iho et al., 1999; Imanishi et al., 2007; Komai-Koma et al., 2004; Peng et al., 2005; Thibault et al., 2007; Mansson eet al., 2006). This variability has been attributed to differences in T cell isolation techniques, i.e. IMACS versus FACS (Kabelitz et al., 2007). However, the link between use of different T cell isolation techniques and T cell functional variability has not been formally demonstrated.
We demonstrated that using FACS to further purify IMACS-isolated human primary CD4+ T cells significantly increases T cell purity. Importantly, differences in T cell purity between IMACS-CD4+ and IMACS/FACS-CD4+ had significant impact on downstream studies of T cell function. The presence of contaminating accessory cells such as CD14+ monocytes in IMACS-CD4+ was associated with responses to the mitogen PHA. Unlike other mitogens, lectins such as PHA require the presence of accessory cells bearing HLA-class II to induce T cell proliferation (de Vries, et al., 1979; Kern et al., 1985; Kern et al., 1986; Rosenstreich, et al., 1976). The role of the accessory cell is not well understood but appears to involve the delivery of costimulatory signals to the mitogen stimulated T cell (Kern et al., 1986). IMACS/FACS-CD4+ responses to PHA were restored by re-addition of low number of monocytes, equivalent to the estimated number of contaminating cells in IMACS-CD4+. This underlines the impact of contaminating accessory cells in T cell functional assays.
T cell activation, proliferation and cytokine secretion requires both CD3/TCR complex ligation (signal 1) and additional costimulatory signals (signal 2) (Watts 2005). CD28 is still the most important and best characterized costimulatory receptor for the initiation and maintenance of the T cell response (Rogers et al., 2000; Rogers et al., 2005; Lenschow et al., 1996). In our experimental system, signal 1 is provided by immobilized anti-CD3 mAb and signal 2 by soluble anti-CD28 mAb. Our results demonstrate that IMACS cells proliferate and produce low but detectable levels of cytokines in response to anti-CD3 stimulation in the absence of an exogenous costimulatory signal. On the other hand, no responses to anti-CD3 were detected in IMACS/FACS-CD4+ in the absence of a costimulatory signal. These data suggest that costimulation is generated by the contaminating accessory cells within the IMACS-CD4+ population. The stringent costimulatory requirements for cytokine secretion of resting CD4+ T cells are often overlooked due to the presence of serum in the medium. We deliberately avoided the use of serum in our system. Among other factors, serum proteins such as fibronectin and complement fragments can deliver costimulatory signals to T cells(Davis et al., 1990; Billiard et al., 2008; Strainic et al., 2008).
Recent studies have shown that TLRs are expressed by T cells in both mice and humans (Babu et al., 2006; Caron et al., 2005; Crellin et al., 2005; Gelman et al., 2004; Hornung, et al., 2002; Imanishi et al., 2007; Komai-Koma et al., 2004; Peng et al., 2005; Thibault et al., 2007; Mansson eet al., 2006). However the type of TLR expressed and their functional relevance in different T cells subsets is controversial. According to Hornung et al. (2002) human T cells expressed TLR 1–6, 8 and 9, whereas Caron et al. (2005) demonstrated expression of TLR 1–5 but not TLR-6 or TLR-8. This and other controversial results are likely associated to the different methods used to purify T cells, variable T cell purity and confounding effects arising from contaminating cells (Kabelitz 2007). In humans, CD4+ T cell cytokine production and proliferation have been shown to be upregulated by TLR-2 and TLR-5 but not TLR-4 agonists in the absence of accessory cells (Komai-Koma, et al., 2004; Caron et al., 2005). In agreement with these reports, we found that LPS failed to costimulate highly pure IMACS/FACS-CD4+. This confirms that TLR-4 engagement does not directly trigger costimulation on primary human CD4+ T cells. On the other hand, both Pam3cys and flagellin induced upregulation of proliferative responses to immobilized anti-CD3 in highly pure IMACS/FACS-CD4+, confirming the role of TLR-2 and TLR-5 in direct costimulation of primary human CD4+ T cells (Komai-Koma, et al., 2004; Caron et al., 2005). Interestingly, high concentrations of Pam3cys had lower costimulatory effect than low concentrations and this could be due to toxicity. In magnetically sorted cells (IMACS-CD4+) Pam3cys and flagellin induced stronger upregulation of proliferation and cytokine secretion when compared to cells purified by IMACS/FACS. This is likely explained by additive effects of these ligands on both T cells and contaminating accessory cells in IMACS-CD4+ (Tsuji et al., 2000; Hertz et al., 2001; Weight et al., 2003). Together this data highlights the importance of the purity of T cells when analyzing the role of TLR on T cell function.
T cell purification protocols have improved considerably in the last 15 years with the development of antibody coated magnetic beads and FACS. For most studies these two methods can be used interchangeably. However, studies of microbial ligand interactions with primary T cells require a high degree of T cell purity unattainable with IMACS for which further purification with FACS is necessary.
Table II.
PHA- induced CD25 expression in IMACS-CD4+ and IMACS/FACS-CD4+
| IMACS-CD4+ | IMACS/FACS-CD4+ | |||||
|---|---|---|---|---|---|---|
| Baseline | 18 h rest | 18 h PHA | Baseline | 18 h rest | 18 h PHA | |
| Donor 1 | 1.6% | 7% | 54% | 0.6% | 8.9% | 10.4% |
| Donor 2 | 2.7% | 6% | 22% | 1.4% | 11.4% | 6% |
| Donor 3 | 1.8% | 2.6% | 18.9% | 0.9% | 4.2% | 9.5% |
| Mean ± SD* | 2.2% ± 0.6 | 5.2% ± 1.9 | 31.6% ± 16† | 0.97% ± 0.4 | 8.2% ± 1.7 | 8.6% ± 2.2† |
SD= Standard Deviation
= IMACS vs. IMACS/FACS, p<0.05
Acknowledgments
We thank Dr. W. H. Boom for his review of this manuscript.
C.L.L was supported by: National Institutes of Health AI07024
J.J.T was supported by: National Institutes of Health AI27243, RG48786N
R.E.R was supported by: National Institutes of Health AI AI2724, AI70022, and Contract No. HHSN266200700022C/NO1-AI-70022 for the Tuberculosis Research Unit (TBRU); American Lung Association: RG48786N
Abbreviations
- IMACS
immunomagnetic cell sorting
- LPS
lipopolysaccharide
- Pam3cys
Pam3Cys-ser-Lys4
- IFN-γ
interferon-gamma
- TLR
Toll-like receptor
- FACS
fluorescence-activated cell sorting
- Treg
regulatory T cell
- APC
antigen presenting cells
- mAb
monoclonal antibody
- PBMC
peripheral blood mononuclear cells
- PHA
phytohemagglutinin
- ELISA
enzyme-linked immunosorbent assay
- IL-2
interleukin-2
- CPM
counts per minute
- TCR
T cell receptor
Footnotes
Conflicts of Interest
No conflicts of interest for C. L. Lancioni, J. J. Thomas, or R. E. Rojas
Publisher's Disclaimer: This is a PDF file of an unedited manuscript that has been accepted for publication. As a service to our customers we are providing this early version of the manuscript. The manuscript will undergo copyediting, typesetting, and review of the resulting proof before it is published in its final citable form. Please note that during the production process errors may be discovered which could affect the content, and all legal disclaimers that apply to the journal pertain.
References
- Babu S, Blauvelt C, Kumaraswami V, Nutman TB. Dimished T cell TLR expression and function modulates the immune response in human filarial infection. J Immunol. 2006;76:3885. doi: 10.4049/jimmunol.176.7.3885. [DOI] [PubMed] [Google Scholar]
- Baecher-Allen C, Wolf E, Hafler D. Functional analysis of highly defined, FACS-isolated populations of human regulatory CD4+ CD25+ T cells. Clin Immunol. 2005;115:10. doi: 10.1016/j.clim.2005.02.018. [DOI] [PubMed] [Google Scholar]
- Billiard MJ, McIntyre BW. CD45RA T-cell activation without proliferation by a partial agonist monoclonal antibody to β-1 integrin. Immunol Cell Bio. 2008;86:381. doi: 10.1038/sj.icb.7100165. [DOI] [PubMed] [Google Scholar]
- Brightbill HD, Libraty DH, Krutzik SR, Yang RB, Belisle JT, Bleharski JR, et al. Host defense mechanisms triggered by microbial lipoproteins through Toll-like receptors. Science. 1999;285:732. doi: 10.1126/science.285.5428.732. [DOI] [PubMed] [Google Scholar]
- Caron G, Duluc D, Frémaux I, Jeannin P, David C, Gascan H, Delneste Y. Direct stimulation of human T cells via TLR5 and TLR7/8: Flagellin and R-848 up-regulate proliferation and IFN-gamma production by memory CD4+ T cells. J Immunol. 2005;175:1551. doi: 10.4049/jimmunol.175.3.1551. [DOI] [PubMed] [Google Scholar]
- Crellin NK, Garcia RV, Hadisfar O, Allan SE, Steiner TS, Levings MK. Human CD4+ T cells express TLR5 and its ligand flagellin enhances the suppressive capacity and expression of FOXP3 in CD4+CD25+ T regulatory cells. J Immunol. 2005;175:8051. doi: 10.4049/jimmunol.175.12.8051. [DOI] [PubMed] [Google Scholar]
- Davis L, Oppenheimer-Marks N, Bednarczyk JL, McIntyre BW, Lipsky PE. Fibronectin promotes proliferation of naive and memory T cells by signaling through both the VLA-4 and VLA-5 integrin molecules. J Immunol. 1990;145:785. [PubMed] [Google Scholar]
- de Vries JE, Caviles AP, Bont WS, Mendelsohn J. The role of monocytes in human lymphocyte activation by mitogens. J Immunol. 1979;122:1099. [PubMed] [Google Scholar]
- Gelman AE, Zhang J, Choi Y, Turka LA. Toll-like receptor ligands directly promote activated CD4+ T cell survival. J Immunol. 2004;172:6065. doi: 10.4049/jimmunol.172.10.6065. [DOI] [PMC free article] [PubMed] [Google Scholar]
- Gehring AJ, Rojas RE, Canaday DH, Lakey DL, Harding CV, Boom WH. The Mycobacterium tuberculosis 19-Kilodalton lipoprotein inhibits gamma interferon-regulated HLA-DR and FcγR1 on human macrophages through Toll-like receptor 2. Infec Immun. 2003;71:4487. doi: 10.1128/IAI.71.8.4487-4497.2003. [DOI] [PMC free article] [PubMed] [Google Scholar]
- Gerke C, Falkow S, Chien YH. The adaptor molecules LAT and SLP-76 are specifically targeting by Yersinia to inhibit T cell activation. J Exp Med. 2005;201:361. doi: 10.1084/jem.20041120. [DOI] [PMC free article] [PubMed] [Google Scholar]
- Hertz CJ, Kiertscher SM, Godowski PJ, Bouis DA, Norgard MV, Roth MD, Modlin RL. Microbial lipopeptides stimulate dendritic cell maturation via Toll-like receptor 2. J Immunol. 2001;166:2444. doi: 10.4049/jimmunol.166.4.2444. [DOI] [PubMed] [Google Scholar]
- Hornung V, Rothenfusser S, Britsch S, Krug A, Jahrsdörfer B, Giese T, Endres S, Hartmann G. Quantitative expression of Toll-like receptor 1–10 mRNA in cellular subsets of human peripheral blood mononuclear cells and sensitivity to CpG oligodeoxynucleotides. J Immunol. 2002;168:4531. doi: 10.4049/jimmunol.168.9.4531. [DOI] [PubMed] [Google Scholar]
- Iho S, Yamamoto T, Takahashi T, Yamamoto S. Oligodeoxynucleotides containing palindrome sequences with internal 5′-CpG-3′ act directly on human NK and activated T cells to induce IFN-g production in vitro. J Immunol. 1999;163:3642. [PubMed] [Google Scholar]
- Imanishi T, Hara H, Suzuki S, Suzuki N, Akira S, Saito T. Cutting edge: TLR2 directly triggers Th1 effector functions. J Immunol. 2007;178:6715. doi: 10.4049/jimmunol.178.11.6715. [DOI] [PubMed] [Google Scholar]
- Kabelitz D. Expression and function of Toll-like receptors in T lymphocytes. Curr Opin Immunol. 2007;19:39. doi: 10.1016/j.coi.2006.11.007. [DOI] [PubMed] [Google Scholar]
- Kern JA, Daniele RP, Nowell PC. Accessory cells provide more than one signal for lectin mitogen-stimulated proliferation of human lymphocytes. J Leuk Bio. 1985;38:495. doi: 10.1002/jlb.38.4.495. [DOI] [PubMed] [Google Scholar]
- Kern JA, Reed JC, Daniele RP, Nowell PC. The role of the accessory cell in mitogen-stimulated human T cell gene expression. J Immunol. 1986;137:764. [PubMed] [Google Scholar]
- Kodowaki N, Ho S, Antonenko S, Malefyt RW, Kastelein RA, Bazan F, Liu YJ. Subsets of human dendritic cell precursors express different toll-like receptors and respond to different microbial antigens. J Exp Med. 2001;194:863. doi: 10.1084/jem.194.6.863. [DOI] [PMC free article] [PubMed] [Google Scholar]
- Komai-Koma M, Jones L, Ogg GS, Xu D, Liew FY. TLR-2 is expressed on activated T cells as a costimulatory receptor. Proc Nat Acad Sci. 2004;101:3029. doi: 10.1073/pnas.0400171101. [DOI] [PMC free article] [PubMed] [Google Scholar]
- Lenschow DJ, Walunas TL, Bluestone JA. CD28/B7 system of T cell costimulation. Annu Rev Immunol. 1996;14:233. doi: 10.1146/annurev.immunol.14.1.233. [DOI] [PubMed] [Google Scholar]
- Mansson A, Adner M, Cardell LO. Toll-like receptors in cellular subsets of human tonsil T cells: altered expression during recurrent tonsillitis. Resp Research. 2006;7:36. doi: 10.1186/1465-9921-7-36. [DOI] [PMC free article] [PubMed] [Google Scholar]
- Miltenyi S, Müller W, Weichel W, Radbruch A. High gradient magnetic separation with MACS. Cytometry. 1990;11:231. doi: 10.1002/cyto.990110203. [DOI] [PubMed] [Google Scholar]
- Pecora ND, Gehring AJ, Canaday DH, Boom WH, Harding CV. Mycobacterium tuberculosis LprA is a lipoprotein agonist of TLR2 that regulated innate immunity and APC function. J Immunol. 2006;177:422. doi: 10.4049/jimmunol.177.1.422. [DOI] [PubMed] [Google Scholar]
- Peng G, Guo Z, Kiniwa Y, Voo KS, Peng W, Fu T, Wang DY, et al. Toll-like receptor 8-mediated reversal of CD4+ regulatory T cell function. Science. 2005;309:1380. doi: 10.1126/science.1113401. [DOI] [PubMed] [Google Scholar]
- Rogers NJ, Mirenda V, Jackson I, Dorling A, Lechler RI. Costimulatory blockade by the induction of an endogenous xenospecific antibody response. Nat Immunol. 2000;1:163. doi: 10.1038/77853. [DOI] [PubMed] [Google Scholar]
- Rogers NJ, Game DD, Camara NO, Jackson IM, Lombardi G, Lechler RI. Distinct effects of CD86-mediated costimulation on resting versus activated human CD4+ T cells. Eur J Immunol. 2005;35:2909. doi: 10.1002/eji.200526199. [DOI] [PubMed] [Google Scholar]
- Rojas RE, Thomas JT, Gehring AJ, Hill PJ, Belisle JT, Harding CV, Boom WH. Phosphatidylinositol mannoside from Mycobacterium tuberculosis binds α5β1 integrin (VLA-5) on CD4+ T cells and induces adhesion to firbonectin. J Immunol. 2006;177:2959. doi: 10.4049/jimmunol.177.5.2959. [DOI] [PubMed] [Google Scholar]
- Rosenstreich DL, Farrar JL, Dougherty S. Absolute macrophage dependency of T lymphocyte activation by mitogens. J Immunol. 1976;116:131. [PubMed] [Google Scholar]
- Scanga CA, Aliberti J, Jankovic D, Tilloy F, Bennouna S, Denkers EY, Medzhitov R, et al. Cutting edge: MyD88 is required for resistance to Toxoplasma gondii infection and regulated parasite-induced IL-12 production by dendritic cells. J Immnunol. 2002;168:5997. doi: 10.4049/jimmunol.168.12.5997. [DOI] [PubMed] [Google Scholar]
- Semple JW, Allen D, Chang W, Castaldi P, Freedman J. Rapid separation of CD4+ and CD19+ lymphocyte populations from human peripheral blood by a magnetic activated cell sorter (MACS) Cytometry. 1994;14:955. doi: 10.1002/cyto.990140816. [DOI] [PubMed] [Google Scholar]
- Shabaana AK, Kulangara K, Semac I, Parel Y, Ilangumaran S, Dharmalingam K, Chizzolini C, Hoessli DC. Mycobacterial lipoarabinomannans modulate cytokine production in human T helper cells by interfering with raft/microdomain signaling. Cell Mol Life Sci. 2005;62:179. doi: 10.1007/s00018-004-4404-5. [DOI] [PubMed] [Google Scholar]
- Sloan DD, Han JY, Sandifer TK, Stewart M, Hinz AJ, Yoon M, Johnson DC, et al. Inhibition of TCR signaling by herpes simplex virus. J Immunol. 2006;176:1825. doi: 10.4049/jimmunol.176.3.1825. [DOI] [PubMed] [Google Scholar]
- Stanciu LA, Shute J, Holgate ST, Djukanovi Production of IL-8 and IL-4 by positively and negatively selected CD4+ and CD8+ human T cells following a four-step cell separation method including magnetic cell sorting (MACS) J Immunol Methods. 1996;189:107. doi: 10.1016/0022-1759(95)00240-5. [DOI] [PubMed] [Google Scholar]
- Strainic MG, Liu J, Huang D, An F, Lalli PN, Muqim N, Shapiro VS, et al. Locally produced complement fragments C5a and C3a provide both cotimulatory and survival signals to naive CD4+ T cells. Immunity. 2008;28:425. doi: 10.1016/j.immuni.2008.02.001. [DOI] [PMC free article] [PubMed] [Google Scholar]
- Tsuji S, Matsumoto M, Takeuchi O, Akira S, Azuma I, Hayashi A, Toyoshima K, et al. Maturation of human dendritic cells by cell wall skeleton of Mycobacterium bovis Bacillus Calmette-Guerin: Involvement of Toll-lie receptors. Infec Immun. 2000;68:6883. doi: 10.1128/iai.68.12.6883-6890.2000. [DOI] [PMC free article] [PubMed] [Google Scholar]
- Thibault S, Tardif MR, Barat C, Tremblay MJ. TLR2 signaling renders quiescent naive and memory CD4+ T cells more susceptible to productive infection with X4 and R5 HIV-Type 1. J Immunol. 2007;179:4357. doi: 10.4049/jimmunol.179.7.4357. [DOI] [PubMed] [Google Scholar]
- Watts TH. TNF/TNFR family members in costimulation of T cell responses. Annu Rev Immunol. 2005;23:23. doi: 10.1146/annurev.immunol.23.021704.115839. [DOI] [PubMed] [Google Scholar]
- Weight H, Muhlradt PF, Emmendorffer A, Krung N, Braun A. Synthetic mycoplasma-derived lipopeptides MALP-2 induces maturation and function of dendritic cells. Immunobiology. 2003;207:223. doi: 10.1078/0171-2985-00234. [DOI] [PubMed] [Google Scholar]