

Abstract
The niche microenvironment in which cancer cells reside plays a prominent role in the growth of cancer. It is therefore imperative to mimic the in vivo tumor niche in vitro to better understand cancer and enhance development of therapeutics. Here, we engineer a 3D metastatic prostate cancer model that includes the types of surrounding cells in the bone microenvironment that the metastatic prostate cancer cells reside in. Specifically, we used a two-layer microfluidic system to culture 3D multi-cell type spheroids of fluorescently labeled metastatic prostate cancer cells (PC-3 cell line), osteoblasts and endothelial cells. This method ensures uniform incorporation of all co-culture cell types into each spheroid and keeps the spheroids stationary for easy tracking of individual spheroids and the PC-3's residing inside them over the course of at least a week. This culture system greatly decreased the proliferation rate of PC-3 cells without reducing viability and may more faithfully recapitulate the in vivo growth behavior of malignant cancer cells within the bone metastatic prostate cancer microenvironment.
Keywords: spheroid, prostate cancer, 3D co-culture, microfluidics, cancer stem cell
Introduction
Cancer stem cells (CSCs) are postulated to be central to establishment of metastases and the main challenge to the cure of cancer [1-3]. Currently, however, the use of CSCs in research is limited by the small number of CSCs that can be isolated, and the spontaneous differentiation in in vitro cultures. The challenge of in vitro CSC culture is likely due, at least in part, to the lack of supportive microenvironmental niches [1-5] in conventional two-dimensional (2D) cultures. Bone metastasis, which is the most severe complication and leading cause of morbidity and ultimately mortality in prostate cancer [6,7], provides clues for recreating a supporting CSC niche environment for prostate cancer cells. Recent data from our group suggests that prostate cancer utilizes the hematopoietic stem cell (HSC) homing mechanisms to metastasize to the bone marrow and thrive in the niche [8,9]. Based on this hypothesis that cancers parasitize the niche, we have developed microscale 3D spheroid culture of prostate cancer cells supported by cells from the HSC niche. Here, we describe a microfluidic 3D culture system that recapitulates the in vivo growth behavior of malignant prostate cancer cells, specifically PC-3 cells, through construction of an in vitro bone metastatic prostate cancer microenvironment.
To develop a supportive metastatic prostate cancer model, we hypothesized that it would be crucial to culture the cells in 3D along with the surrounding cells in the microenvironment that the metastatic prostate cancer cells reside in [10-12]. For example, cells are known to proliferate at a much slower rate that is more physiological when cultured in 3D than 2D [13-15]. It is also known that prostate cancer cells not only proliferate differently when co-cultured with other stromal cells or fibroblasts, but can also affect the proliferation rates of the other cell types under various in vitro and in vivo models [16-18]. We adopted co-culture spheroids as a 3D prostate cancer niche model.
Spheroids are sphere-shaped cell colonies formed by self-assembly that allow various growth and functional studies of diverse tissues [19]. Spheroids serve as excellent physiologic tumor models as they mimic avascular tumors and micrometastases [20] and are known to provide more reliable and meaningful therapeutic readouts [21]. Although these advantages of tumor spheroids has been widely recognized [22], challenges involved in the tedious procedures required for formation, maintenance, solution exchange, and microscale cell and fluid manipulation are still holding back the industry from using the well-validated spheroid tissue model more widely.
Formation of spheroids occurs spontaneously, in environments where cell-cell interaction dominates over cell-substrate interactions. Typical methods for spheroid generation include hanging drops, culture of cells on non-adherent surfaces, spinner flask cultures, and NASA rotary cell culture systems [23,24]. Recently, various groups have also developed spheroids on a chip works utilizing microscale technologies such as microwell arrays and microfluidic devices [25-31]. There have also been spheroid co-culture works including co-culture of endothelial cells with fibroblasts and smooth muscle cells using hanging drops [22,32,33]. Metastatic prostate cancer cell line PC-3 cells have been co-cultured with fibroblasts using the NASA rotary cell culture system [19]. Many of these techniques, however, suffer from problems such as efficiency of forming spheroids, long-term culture, control of spheroid size, and uniform distribution of small numbers of co-culture cell types across all spheroids. Here, we apply a microfluidic spheroid formation technology used previously to form embryoid bodies [34] to the formation of heterogeneous co-culture spheroids of PC-3's supported by osteoblasts and endothelial cells as a model of the niche microenvironment for prostate cancer metastasis to the bone.
Materials and Methods
General Cell Culture
The PC-3 prostate cancer cells originally isolated from vertebral metastases in prostate cancer patient were obtained from ATCC (Rockville, MD). PC-3 cells were stably transfected via DsRed lentivirus (LG501, Biogenova, Rockville, MD) following manufacturers protocol. After transfection cells were sorted by flow cytometry for the brightest 10% of the population. PC-3 cells that stably express the DsRed protein are denoted as PC-3DsRed cells. PC-3DsRed cells were compared to PC-3 cells for several passages and were shown to behave normally. PC-3DsRed cells were cultured in T-25 flasks (Corning, Acton, MA) and maintained in complete media consisting of RPMI-1640 (61870; Gibco) supplemented with 10% (v/v) fetal bovine serum (FBS; 10082; Gibco), and 1% (v/v) penicillin-streptomycin (Invitrogen). The PC-3DsRed cells were routinely passaged at 70-90% confluence. Human umbilical vein endothelial cells (HUVECs, Lonza) passage number 2-6 were cultured in endothelial growth medium-2 (EGM-2, Lonza) in T-25 flasks. The HUVECs were collected by washing and detaching with 0.25% trypsin/EDTA (Invitrogen). The trypsin solution was neutralized with 10% FBS in DMEM (Invitrogen) and spun down with a centrifuge (ThermoForma, Marietta, OH) for 5 min at 4°C and resuspended in EGM-2. The spin and resuspension in EGM-2 were repeated to ensure removal of trypsin. MC3T3-E1 cells are pre-osteoblasts derived from murine calvarias. When treated with ascorbate, these cells express osteoblast-specific markers and are capable of producing a mineralized matrix [35,36]. These cells were routinely maintained in α-MEM (Alpha Minimum Essential Medium; Gibco) supplemented with 15% (v/v) FBS, and 1% (v/v) penicillin-streptomycin. Differentiation of MC3T3-E1 cells into osteoblasts was only induced when cultured as spheroids by addition of 50 μg/ml ascorbic acid. All cultures were maintained in a humidified incubator at 37°C, 5% CO2, and 100% humidity.
Fabrication of Microfluidic Devices and Cell Seeding
The microfluidic device consists of a two-layer poly(dimethylsiloxane) (PDMS) device with two microchannels separated by a semi-permeable polycarbonate membrane (Fig. 1). The upper channel consists of 28 side-chambers and is a dead-end designed to facilitate cell capture, whereas the lower channel is continuous to allow for media perfusion. The semi-permeable polycarbonate membrane was 10 μm thick with 5 μm pores with low cellular attachment (TMP04700; Fisher). Spheroids are cultured on the upper channel while the lower channel contains cell culture media. The fabrication of the device is as previously described [34]. The lower channel is 100 μm in height and 2 mm in width. The dimensions of each cuboidal shaped side-chamber in the upper channel are 200 × 200 × 200 μm, while the central microchannel cross sectional area is 200 μm in height and 50 μm in width. Microchannel and membrane surfaces are treated with 1% w/v Pluronic F108 (BASF) overnight to be resistant to cell adhesion. Before seeding cells, co-culture media consisting of PC-3 complete growth media and 50 μg/ml ascorbic acid was introduced into the device and incubated for 1 hr. Pre-mixed heterogeneous cell suspensions at 1:50:50 PC-3DsRed:HUVEC:MC3T3-E1 ratio were then introduced into the upper channel using gravity-driven flow. Specifically, the tube connected to the outlet of the lower channel was lowered to approximately 15 cm below the inlet reservoir during the cell seeding process. Consequently, gravity resulted from this height difference between the reservoirs created a suction force through the lower channel that facilitates uniform seeding of a confluent monolayer of cells in the upper channel. The cells were cultured under static conditions with daily media exchange through the lower channel.
FIGURE 1.
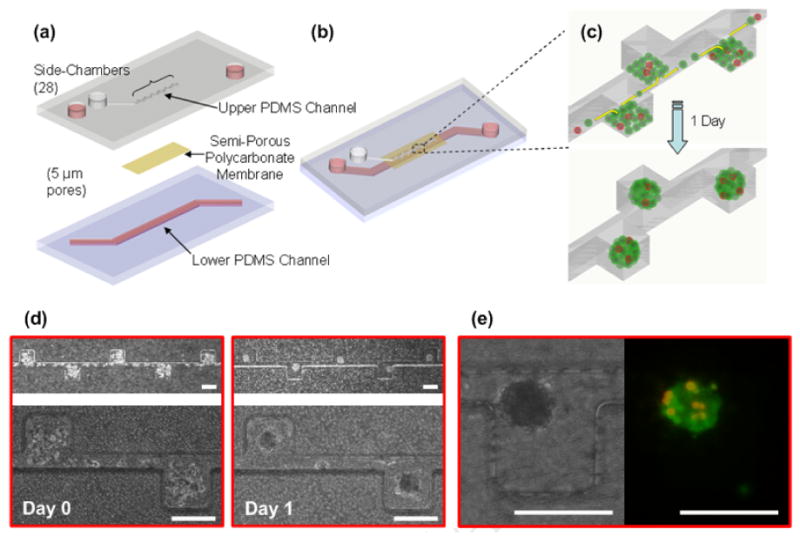
Schematic illustrations of the microfluidic spheroid formation device design (a-b) and PC-3DsRed co-culture spheroid formation process (c). The device consists of two PDMS microchannels separated by a semi-permeable polycarbonate membrane with 5 μm pores. The upper channel is a dead end channel with 28 side-chambers to culture spheroids, and the lower channel has flow through capability for culture medium. Before seeding cells, the channel and membrane surfaces are rendered resistant to cell adhesion. The heterogeneous mixture of PC-3DsRed and support cells (MC3T3-E1 and HUVEC) at 1:100 co-culture ratio are introduced into the upper channel as a confluent monolayer. The cells preferentially settle inside the side-chambers and self-aggregate to form PC-3DsRed co-culture spheroids within 1 day of culture. (d) Actual time-lapse images of PC-3DsRed co-culture spheroid formation within microchannel (side-chambers: 200 × 200 × 200 μm, central microchannel: 50 μm width, 200 μm height). Optical images were taken immediately after seeding and 1 day after introducing the cells. (e) Optical and fluorescent images of a PC-3DsRed co-culture spheroid after 1 day of cultlure in the microfluidic device. Red = PC-3DsRed cells, Green = MC3T3 and HUVEC (support cells). Scale bar is 200 μm.
PC-3DsRed Proliferation Tracking and Evaluation of Viability
Co-culture spheroids that formed in the microchannel were imaged by phase contrast microscopy as well as fluorescence microscopy (Nikon TE-300). The number of PC-3DsRed cells within each spheroid was tracked by fluorescence everyday for a total of 7 days. On the last day (day 7) of culture, the spheroids were stained with calcein-AM (Invitrogen) to evaluate cellular viability. Calcein-AM dissolved in PBS to a final concentration of 1μg/ml was introduced into both the upper and lower channels and incubated for 30 min at 37°C. Cross-sections of the co-culture spheroids were subsequently imaged by confocal microscopy.
Doubling Time Calculation
PC-3DsRed doubling time calculation for the co-culture spheroids inside devices (3D co-culture in device) was calculated by first fitting an exponential-fit line through the average data points from the PC-3DsRed proliferation graph (Figure 2e, average number of PC-3DsRed cells/spheroid vs. time). The equation obtained from the fit was y = 3.1679(e0.0707t) with r2 = 0.9041. We subsequently set y = 6 (two times the initial average of PC-3DsRed cells per spheroid on day 1) and solved for t (for the time it takes for the initial number of PC-3DsRed cells at day 1 to double). The final doubling time equals t − 24 (the time it takes for the PC-3DsRed cells present at day 1 to double). The same method was used to calculate the doubling time of PC-3DsRed co-culture spheroids cultured on 96 well plates (3D co-culture in dish). For PC-3 doubling time calculation under 2D monoculture in dish, 2D co-culture in dish, and 3D mono-culture in dish (non-adherent culture), the initial and final number of cells were counted and the doubling time was solved from the equation N(t) = N(t0) 2[(t-t0)/D] where N(t) = number of cells at time t (final number of cells), N(t0) = number of cells at time to (initial number of cells), t = harvesting time, t0 = plating time, t-t0 = time the cells have had to grow, and D = doubling time. The doubling time is reported in hours.
FIGURE 2.
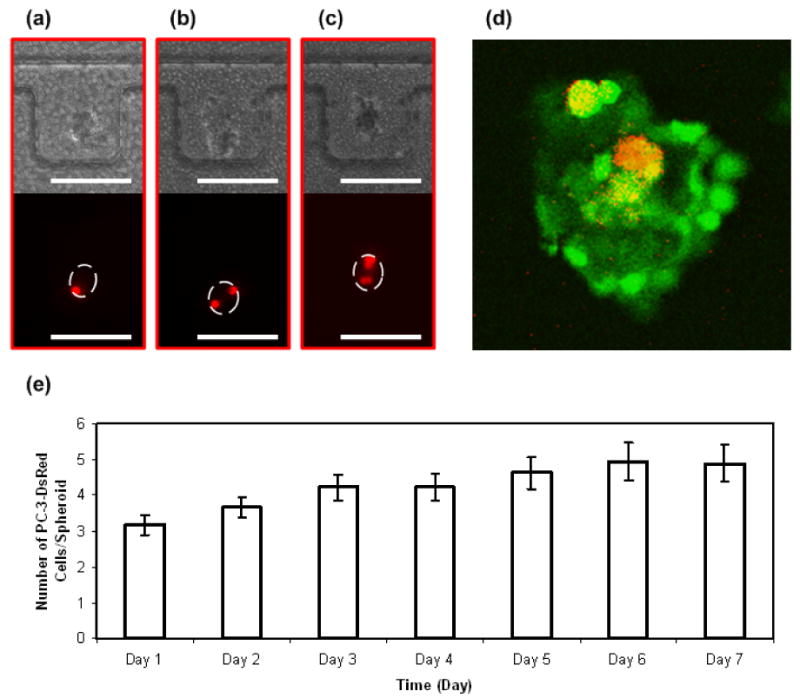
Time-lapse images of PC-3DsRed proliferation within HUVEC and MC3T3-E1 co-culture spheroid in side-chambers of the microfluidic device. Optical images of the co-culture spheroids and fluorescent images of PC-3DsRed cells on day 1 (a), day 4 (b), and day 7 (c) of culture. (d) A confocal section of PC-3DsRed co-culture spheroid illustrating the viability of PC-3DsRed cells. Red = PC-3DsRed cells, Green = Live cells (Calcein-AM stain), Yellow = Live PC-3DsRed cells. (e) Graph of PC-3DsRed proliferation pattern inside co-culture spheroids over a course of 1 week. Y-axis shows the average number of PC-3DsRed cells per spheroid (error bars are standard error), x-axis is the time in days. Scale bar is 200 μm.
Spheroid Size Measurements
The size of the co-culture spheroids formed within the microchannel was determined by measuring their diameters as previously described [34]. Co-culture spheroids that formed in the microchannel were imaged by phase contrast microscopy as described above. The mean diameter (d) of the co-culture spheroids was determined using the following equation: d = (a × b)1/2, where a and b are orthogonal diameters of the spheroid [37]. The average size of the co-culture spheroids was reported as mean diameter ± standard deviation.
2D Co-culture, 3D Mono-culture, and 3D Co-culture in Dish
For the 2D co-culture experiment, HUVEC and MC3T3-E1 cell suspensions were pre-mixed at a 1:1 ratio. The heterogeneous cell mixture of HUVEC and MC3T3-E1 cells (support cells) were subsequently plated as a confluent monolayer on a tissue culture dish. 24 hours later when HUVEC and MC3T3-E1 cells had already attached to the tissue culture dish, PC-3DsRed cells were added on top of the confluent monolayer of support cells at a co-culture ratio of 1 PC-3DsRed to 100 support cells. The cells were maintained in co-culture media consisting of PC-3 complete growth media and 50 μg/ml ascorbic acid. Culture media were changed daily as in our co-culture spheroid system. The 2D co-culture system was monitored everyday for a total of 6 days. On the last day of culture (day 6), live stain (Calcein-AM dissolved in PBS to a final concentration of 1μg/ml) was performed to determine the viability of the PC-3DsRed cells.
For the culture of PC-3 cells on non-adherent surface as a model for closely aggregated 3D mono-culture, PC-3 cells were seeded in ultra-low attachment 96-well plates (Corning Costar) at a density of 5000 cells/well. PC-3 cells were maintained in PC-3 complete growth media and monitored for a total of 5 days.
For the culture of PC-3DsRed co-culture spheroids on non-adherent dish, pre-mixed heterogeneous cell suspensions at 1:50:50 PC-3DsRed:HUVEC:MC3T3-E1 ratio were first formed into 30 μl hanging drops with ∼500 cells/drop. After 1 day in culture when PC-3DsRed co-culture spheroids were formed, each spheroid was then transferred to each well in a non-adherent 96-well plate. PC-3DsRed co-culture spheroids were maintained in co-culture media consisting of PC-3 complete growth media and 50 μg/ml ascorbic acid and monitored over 7 days. Half of the total volume of culture media was exchanged by fresh media daily.
PC-3DsRed CD133+ Cell Sorting
PC-3DsRed CD133+ cells were isolated using CD133 Cell isolation kit, according to the manufacturer's protocol (Miltenyl Biotec). Briefly cells were made into single cell suspension by using cellstripper (Mediatech, Inc., VA), washed with PBS and resuspended into Macs Buffer supplemented with 0.5% BSA. The cells were labeled with CD133 microbeads for 30 minutes after blocking Fc receptors with FcR Blocking reagent. After labeling, the cells were washed with MACS buffer. Magnetically labeled CD133 positive cells were passed through LS columns (Miltenyl Biotech). Cells were eluted with MACS buffer.
Results and Discussion
Formation of PC-3DsRed Co-culture Spheroids within Microchannel (Spheroid Size, Media exchange, Distribution of PC-3DsRed Cells)
A schematic of the microfluidic device comprised of two microchannels separated by a semi-permeable membrane is shown in Figure 1a-b. The PC-3DsRed co-culture spheroids form through a process shown in Figure 1c. Heterogeneous cell mixture of PC-3DsRed, MC3T3, and HUVEC cells at 1:100 PC-3DsRed to support cells ratio was introduced into the upper channel as a monolayer. Since the microchannel surfaces were rendered resistant to cell adhesion, the cells self-aggregated to form co-culture spheroids within 1 day in culture. Figure 1d shows the actual images of the co-culture spheroid formation process. Despite the dead-end upper channel, cells could still be introduced into the upper channel through gravity-driven seeding with suction from the lower channel through the semi-permeable membrane. Furthermore, due to the circular flow pattern inside the cuboidal-shaped side-chambers (Figure 1c), the cells preferentially settled into the side chambers and tended to aggregate into circular shapes during seeding. Such automatic formation of semi-aggregated cellular mass during the seeding process facilitated the subsequent spheroid formation. The sizes of the spheroids were relatively uniform and synchronous in their formation. The area of each side chamber as dictated by the microchannel size specification provided control of uniformly-sized spheroids. In our device, the area of each side chamber (200 μm by 200 μm) was 4 × 104 μm2. Since the size of each cell was about 10 μm in height, the estimated volume of a confluent monolayer of rounded, unattached cells in each chamber was approximately 4 × 105 μm3. To achieve this volume, the estimated diameter of each spheroid would have to be 90 μm, which was approximately the size of the spheroids that we consistently obtained in our experiments (86 ± 12 μm). The microchannel size specifications can easily be adjusted to allow uniform spheroid formation of various other sizes [34]. In addition, the compartmentalization afforded by the 5 μm semi-permeable polycarbonate membrane allowed convenient exchange of media from the bottom channel while non-attached spheroids were cultured on the top channel without perturbation of the spheroid positions and convective washout. The side-chamber design further introduced compartmentalization to keep co-culture spheroids stationary for easy continuous PC-3DsRed cell tracking despite daily culture media exchange.
In order to track and monitor the small number of prostate cancer cells within co-culture spheroids, we used PC-3 cells stably transfected with the fluorescent protein DsRed (PC-3DsRed). PC-3DsRed cells were co-cultured with osteoblasts (MC3T3-E1), and endothelial cells (HUVEC) in the microfluidic device to mimic a “niche”-like microenvironment. The choice of support cells was based on the fact that PC-3 cells were first isolated from prostate cancer metastasis to the bone. Furthermore, it has been suggested that the process of prostate cancer metastasis to the bone is similar to the homing of HSC's to the bone marrow [6,8,9]. Prostate cancer cells that successfully established metastasis at the bone marrow seem to parasitize the HSC niche and harvest the normal machinery from the niche microenvironment to facilitate growth and survival [6,8,9]. To mimic this HSC niche for prostate cancer cell culture, we chose a co-culture cell ratio of 1:100 PC-3DsRed to support cells, which had previously been shown to yield the best supporting niche microenvironment for HSC's (unpublished results). Figure 1e shows an image of PC-3DsRed co-culture spheroid. The PC-3DsRed cells were red while green represented live cells (Calcein-AM live stain). The PC-3DsRed cells were clearly distinguished from all the other support cells by its red fluorescence. The spatial arrangement of the PC-3DsRed cells within the spheroid was relatively random, with PC-3DsRed cells located everywhere throughout the spheroids. Our microfluidic device was able to ensure the incorporation of small numbers of PC-3DsRed cells inside co-culture spheroids with intimate contact with the support cells. In addition, the distribution of PC-3DsRed's across all spheroids in the device was relatively uniform. Since 10,000 cells were introduced into the device that consists of 28 side-chambers, the initial number of cells in each chamber was about 350 cells/chamber. At the co-culture ratio of 1 PC-3DsRed to 100 support cells, the theoretical number of PC-3DsRed's was 3.5 cells/chamber. This was in good agreement with the number we obtained in our experiments with an average of 3 ± 2 cells/spheroid on day 1 in culture. Except the three chambers at the dead-end of the device in which there were fewer cells seeded overall, PC-3DsRed cells were uniformly distributed along the length of the device at the consistent co-culture ratio of 1 percent. Uniform distribution of the PC-3DsRed cells across all co-culture spheroids allows for a consistent pool of 3D tissue samples for a wide variety of applications such as anti-cancer drug sensitivity testing experiments.
PC-3DsRed Proliferation and Viability (2D vs. 3D, Co-culture vs. Mono-culture)
The PC-3DsRed cells were tracked for their proliferation within each spheroid by their fluorescence everyday for a total of 7 days. The growth pattern and viability of the PC-3DsRed cells within the 3D co-culture environment over the course of 1 week is shown in Figure 2. Figure 2a-c show the optical and fluorescent time-lapse images of PC-3DsRed cells cultured within MC3T3 and HUVEC co-culture spheroids. In this particular co-culture spheroid, there was only one PC-3DsRed cell on day 1 of culture, which gradually proliferated into two cells by day 4, and again doubled to four cells by day 7. This showed that PC-3DsRed cells were still able to proliferate inside co-culture spheroids. PC-3DsRed cells were still alive after 7 days in culture inside spheroids as shown in Figure 2d with a representative section of the PC-3DsRed co-culture spheroid obtained using confocal microscopy. Live cells were stained with Calcein-AM and appeared to be green while PC-3DsRed cells expressed red fluorescence. Since all the red cells co-localize with the viable green color, all the PC-3DsRed cells were able to survive under the 3D co-culture environment after 7 days in culture. Together, these results demonstrated that PC-3DsRed cells were able to survive and proliferate inside osteoblast and endothelial cell co-culture spheroids. As shown in Figure 2e, PC-3DsRed's mainly remained quiescent and proliferated at a relatively slow rate in 3D co-culture environment. PC-3DsRed cells merely proliferated from an average of 3 cells/spheroid to an average of 5 cells/spheroid. The doubling time of the PC-3DsRed cells under the 3D co-culture environment was estimated to be 212 h (about 9 days). Such proliferation rate of PC-3DsRed cells inside spheroids is much slower than the traditional 2D mono-culture (doubling time ≈ 24 h). Although the in vivo metastatic prostate cancer cell proliferation rate is not exactly known, we believe that our prostate cancer cell co-culture spheroid system mimicking the in vivo prostate cancer cell niche microenvironment more faithfully recapitulated a reasonable physiologic growth pattern of prostate cancer cells in vitro. The in vivo doubling time of PC-3 cells was roughly determined to be between 1 to 2 weeks from various PC-3 in vivo culture experiments [38-40], which was in good agreement with the observed PC-3DsRed doubling time in our in vitro microfluidic 3D spheroid co-culture system.
Since we have previously demonstrated that cells can be cultured normally inside a membrane-type device [34,41], the device should not affect cellular proliferation. We cultured PC-3DsRed co-culture spheroids on non-adherent dishes to confirm their proliferation behavior. Proliferation rate of PC-3DsRed cells cultured on non-adherent dishes (doubling time ≈ 205 hrs) was very similar to that cultured inside devices. Since a hanging drop method is difficult to culture spheroids for a week because of difficulty of changing culture media, and also non-adherent dish culture is difficult to monitor each spheroid because of aggregation of spheroids, spheroids were made by the hanging drop method and each spheroid was then transferred to each well in a non-adherent 96-well plate. The fact that the PC-3DsRed cells proliferated at a considerably slower rate inside the co-culture spheroids was not device-dependent. Rather, the proliferation of cells inside these two-layer semi-permeable membrane devices seem to be cell type-dependent as other cell types cultured under both 2D and 3D conditions were still able to proliferate inside the devices.
We compared PC-3DsRed proliferation in our co-culture spheroid system to 2D co-culture in dishes. PC-3DsRed, HUVEC and MC3T3-E1 cells were co-cultured under 2D dish environment at 1:100 PC-3DsRed to support cells ratio and PC-3DsRed proliferation was monitored everyday for a total of 6 days. On day 1 of culture, there were very few PC-3DsRed cells present (Figure 3a-b). But by day 6, it was clear that the PC-3DsRed cells had proliferated extensively (Figure 3e-f), with an estimated doubling time of ≈ 29 hrs. Furthermore, viability experiments confirmed that most of these actively proliferating PC-3DsRed cells were still alive on day 6 (data not shown). These results demonstrated that the complex interplay of various soluble factors involved in prostate cancer and support cells co-culture was not enough to mimic the physiologic microenvironment. This finding also implied that mere cell-cell interaction in a 2D context between PC-3DsRed cells and support cells was not sufficient to recapitulate a physiologic proliferation rate of the prostate cancer cells. Therefore, a physiologic microenvironment not only involves cell-cell interaction, but 3D environment is also a critical factor.
FIGURE 3.
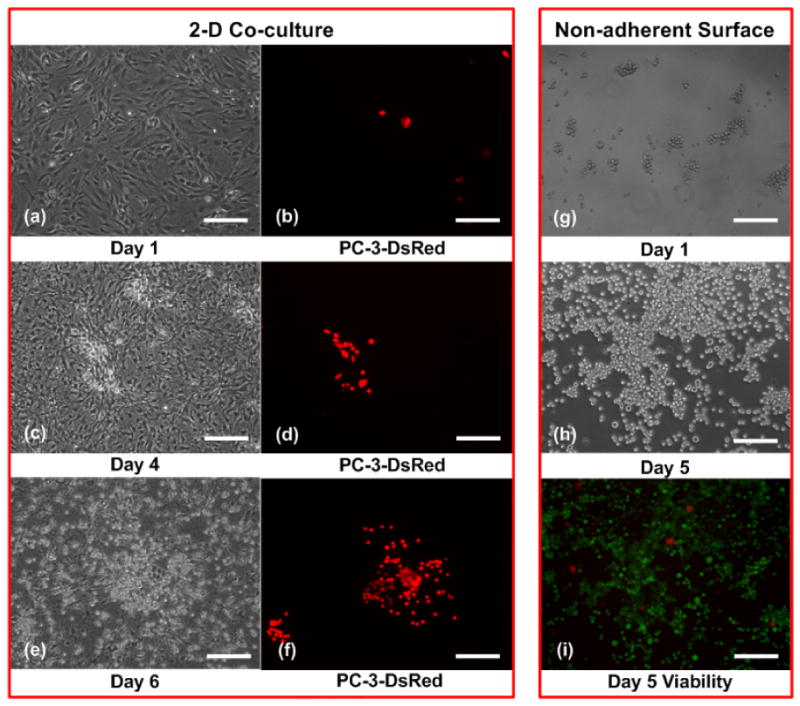
Time-lapse images of PC-3DsRed proliferation under 2D co-culture with MC3T3-E1 and HUVEC (a-f). Red = PC-3DsRed cells. Time-lapse images of PC-3 proliferation on non-adherent surface (g-h) and day 5 viability (i). Red = dead cells, Green = live cells. Scale bar is 200 μm.
We also compared PC-3DsRed 3D co-culture spheroid inside the device to PC-3DsRed 3D mono-culture inside the same device. Instead of introducing heterogeneous mixture of the co-culture cells into the device, pure PC-3DsRed cells were seeded. PC-3DsRed cells did not form spheroids but quickly aggregated into cell clusters within one day of culture. Over 7 days of culture, it was clear that the PC-3DsRed cells proliferated under such 3D mono-culture environment inside the device (data not shown). However, because it is difficult to quantify the number of PC-3DsRed cells inside the device, we estimated the PC-3DsRed doubling time under 3D mono-culture condition by investigating the effect of blocking cell-substrate attachment on PC-3 cells. Initially, PC-3 cells were seeded in ultra-low attachment 96-well plates at a density of 5000 cells/well. PC-3 cells quickly aggregated into cell clusters of various sizes within 1 day in culture (Figure 3g), but they did not form spheroids. Nevertheless, such close-packed, non-adherent culture condition resembled PC-3 3D mono-culture in dish. Over the 5 days of culture, PC-3 cells still proliferated at a comparative rate (doubling time ≈ 36 h) as the normal 2D mono-culture condition (Figure 3h). In addition, almost all PC-3 cells were still alive after 5 days in culture as demonstrated by live/dead stain (Figure 3i). This showed that PC-3 mono-culture under such closely-aggregated 3D-like environment was still not sufficient in recapitulating a more physiological growth rate of prostate cancer cells. Various PC-3-support cells interaction may be imperative in inducing the more physiological proliferation of PC-3DsRed cells under the 3D co-culture spheroid condition. One other interesting characteristic of our co-culture spheroids was that the support cell did not seem to be proliferating. This was a desired characteristic as the endothelial cells and osteoblasts mainly function to support the PC-3DsRed cells without depleting the nutrients in the microenvironment.
In summary, under normal 2D mono-cultures, PC-3DsRed, HUVEC, and MC3T3-E1 cells all proliferated at a relatively fast rate. When grown as 3D mono-cultures, PC-3DsRed, HUVEC, and MC3T3-E1 cells proliferated, died, and stayed relatively quiescent, respectively. When all three cell types are co-cultured in 2D, there seemed to be proliferation of all three cell types. But interestingly, co-culture of all three cell types in 3D seemed to be no death of the HUVECs, quiescence of the MC3T3-E1 cells, and slow proliferation of the PC-3DsRed cells. These non-additive synergistic effects of co-culture contributed to a stable co-culture system, which contrasts with rapid proliferation of PC-3 cell mono-cultures in 2D and 3D, with the rapid proliferation in 2D but death of 3D spheroids of endothelial cell mono-cultures, and with rapid proliferation in 2D but slow growth of 3D spheroids of osteoblasts. Such cellular behavior may be a combination of effects from various soluble and insoluble factors, direct heterotypic cell-cell interactions between PC-3DsRed and support cells in a semi-confined 3D context, and the unique extracellular matrix (ECM) composition contributed by all co-culture cell types leading to various proliferation inhibitory and survival effects through integrin signaling. Various other co-culture examples also exhibit promoting effects from support cells as well as synergistic cross-talk between co-culture cell types [16,32-33]. The results highlight the importance of culturing cells not only in 3D but also with appropriate co-culture of cells.
CD133+ PC-3DsRed Co-culture Spheroids
CD133 is a potential marker for prostate cancer stem cell (CSC), and therefore the CD133+ population is believed to be enriched for CSCs. The 3D co-culture spheroid system was therefore also applied to CD133+ PC-3DsRed cells. Figure 4a-c shows the time-lapse images of CD133+ PC-3DsRed cell co-culture spheroids with MC3T3-E1 and HUVEC at 1:100 CD133+ PC-3DsRed cells to support cells ratio. In this particular co-culture spheroid, the only CD133+ PC-3DsRed cell present on day 1 (Figure 4a) did not proliferate inside the spheroid throughout the 7 days of culture (Figure 4b-c). The same cell was kept alive but quiescent inside the spheroid for a week. Figure 4d shows the graph of the overall CD133+ PC-3DsRed cell proliferation pattern inside co-culture spheroids over 7 days. There seemed to be a slight decreasing trend in the average number of CD133+ PC-3DsRed cells per spheroid over the first 4 days. This might be due to the fact that a greater number of cells were dying in the first few days as these CD133+ PC-3DsRed cells might have been stressed more during the sorting process. The remaining viable cells seemed to stay quiescent or start to proliferate slowly. The greater variability in the CD133+ PC-3DsRed cell proliferation and survival between different spheroids also explains the larger standard deviation seen on day 4 and day 7 of culture. Overall, the CD133+ PC-3DsRed cells cultured inside co-culture spheroids supported by HUVEC and MC3T3-E1 cells were able to survive but did not proliferate much over the course of 1 week.
FIGURE 4.
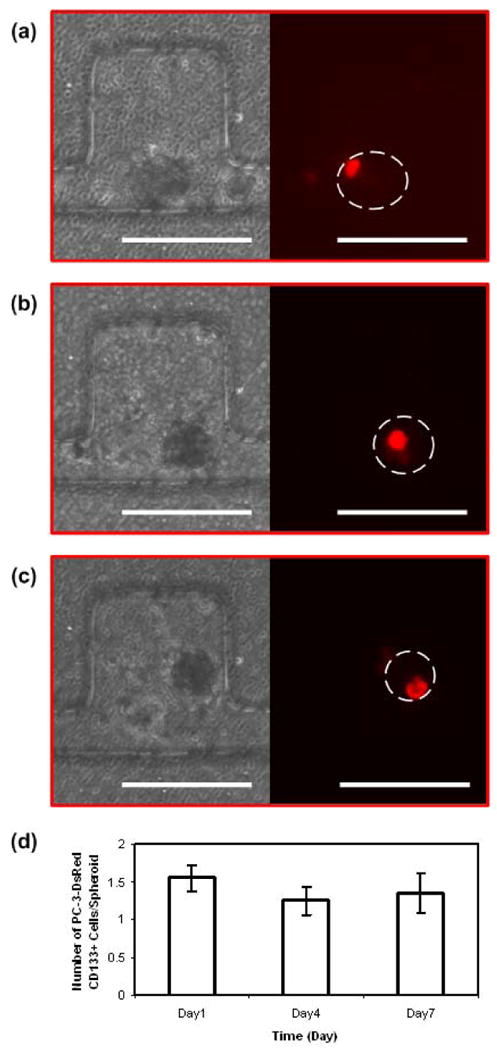
Time-lapse images of PC-3DsRed CD133+ cell proliferation within HUVEC and MC3T3-E1 co-culture spheroid in side-chambers of the microfluidic device. Optical images of the co-culture spheroids and fluorescent images of PC-3DsRed CD133+ cells on day 1 (a), day 4 (b), and day 7 (c) of culture. (d) Graph of PC-3DsRed CD133+ cell proliferation pattern inside co-culture spheroids over a course of 1 week. Y-axis shows the average number of PC-3DsRed CD133+ cells per spheroid (error bars are standard error), x-axis is the time in days. Scale bar is 200 μm.
Under traditional 2D mono-culture condition, these CD133+ PC-3DsRed cells can easily differentiate to loose their cell surface marker. In our 3D co-culture spheroid system, the CD133+ PC-3DsRed cells remained mostly quiescent without much proliferation. Further experiments are needed to characterize in more detail the survival, proliferation, and the maintenance of the CD133 marker in these cells. The type and ratio of supporting cells used may also be critical for maintaining the cell surface marker of these cells. Nevertheless, our system demonstrated a unique culture method that may be able to capture the CD133+ population of PC-3's at the quiescent stage. Such model would be suitable for the development of anti-cancer drugs that target CSCs. As mentioned earlier, new therapeutics that specifically target CSCs are much needed, but currently it has been extremely difficult to maintain and culture CSCs in vitro. Our microfluidic 3D co-culture spheroids system efficiently provides physiologic 3D prostate cancer and CSC tissue constructs as models for anti-cancer drug sensitivity testing on the general tumor population as well as CSCs.
Conclusion
We describe the design and fabrication of a platform for efficient microfluidic 3D co-culture of metastatic prostate cancer cells within a “niche”-like construct. In addition to promoting reliable formation of uniformly-sized spheroids, our system also ensures uniform distribution of the small number of PC-3 cells as well as the other co-culture cell types across all spheroids within the device. In addition, the side-chamber microchannel design keeps the spheroids stationary during media exchange for easy tracking of the PC-3's during extended longer term cultures. Using these capabilities, we created 3D cancer “niche”-like microenvironments with high cell viability and a more physiological slower growth behavior of prostate cancer cells. The microscale 3D tumor tissue constructs may be valuable as a model for testing drugs that target the cancer microenvironment as well as the cancer cells themselves in their more quiescent state in the niche. Although this paper focused on prostate cancer cells and their niche, the technology described is versatile and should be readily applicable for culture of various other types of cells in a physiological 3D setting.
Acknowledgments
We thank the Wilson Foundation, Coulter Foundation, NIH (HL-084370), and the UMCCC Prostate SPORE P50 CA69568 pilot grant for financial support. A.Y. Hsiao acknowledges the support of NIH's Microfluidics in Biomedical Sciences Training Program: NIH NIBIB T32 EB005582. K.J. Pienta and R.S. Taichman are supported by NIH grant CA093900. K.J. Pienta is also supported by an American Cancer Society Clinical Research Professorship, Cancer Center support grant P30 CA 46592, NIH ICMIC P50 CA93990, NIH SAIRP U24 CA083099, the Southwest Oncology Group CA32102, and the Prostate Cancer Foundation.
Footnotes
Publisher's Disclaimer: This is a PDF file of an unedited manuscript that has been accepted for publication. As a service to our customers we are providing this early version of the manuscript. The manuscript will undergo copyediting, typesetting, and review of the resulting proof before it is published in its final citable form. Please note that during the production process errors may be discovered which could affect the content, and all legal disclaimers that apply to the journal pertain.
References
- 1.Li F, Tiede B, Massague J, Kang Y. Beyond tumorigenesis: cancer stem cells in metastasis. Cell Res. 2007;17(1):3–14. doi: 10.1038/sj.cr.7310118. [DOI] [PubMed] [Google Scholar]
- 2.Croker AK, Allan AL. Cancer stem cells: implications for the progression and treatment of metastatic disease. J Cell Mol Med. 2008;12(2):374–90. doi: 10.1111/j.1582-4934.2007.00211.x. [DOI] [PMC free article] [PubMed] [Google Scholar]
- 3.Kelly K, Yin JJ. Prostate cancer and metastasis initiating stem cells. Cell Res. 2008;18(5):528–37. doi: 10.1038/cr.2008.50. [DOI] [PubMed] [Google Scholar]
- 4.Dontu G, Liu S, Wicha MS. Stem cells in mammary development and carcinogenesis: implications for prevention and treatment. Stem Cell Rev. 2005;1(3):207–13. doi: 10.1385/SCR:1:3:207. [DOI] [PubMed] [Google Scholar]
- 5.Li L, Neaves WB. Normal stem cells and cancer stem cells: the niche matters. Cancer Res. 2006;66(9):4553–7. doi: 10.1158/0008-5472.CAN-05-3986. [DOI] [PubMed] [Google Scholar]
- 6.Taichman RS, Loberg RD, Mehra R, Pienta KJ. The evolving biology and treatment of prostate cancer. J Clin Invest. 2007;117(9):2351–61. doi: 10.1172/JCI31791. [DOI] [PMC free article] [PubMed] [Google Scholar]
- 7.Sun YX, Fang M, Wang J, Cooper CR, Pienta KJ, Taichman RS. Expression and activation of αvβ3 integrins by SDF-1/CXC12 increases the aggressiveness of prostate cancer cells. Prostate. 2007;67(1):61–73. doi: 10.1002/pros.20500. [DOI] [PubMed] [Google Scholar]
- 8.Shiozawa Y, Havens AM, Pienta KJ, Taichman RS. The bone marrow niche: habitat to hematopoietic and mesenchymal stem cells, and unwitting host to molecular parasites. Leukemia. 2008;22(5):941–50. doi: 10.1038/leu.2008.48. [DOI] [PMC free article] [PubMed] [Google Scholar]
- 9.Shiozawa Y, Havens AM, Jung Y, Ziegler AM, Pedersen EA, Wang J, et al. Annexin II/Annexin II receptor axis regulates adhesion, migration, homing, and growth of prostate cancer. J Cell Biochem. 2008;105(2):370–80. doi: 10.1002/jcb.21835. [DOI] [PMC free article] [PubMed] [Google Scholar]
- 10.Abbott A. Cell culture: biology's new dimension. Nature. 2003;424(6951):870–2. doi: 10.1038/424870a. [DOI] [PubMed] [Google Scholar]
- 11.Griffith LG, Swartz MA. Capturing complex 3D tissue physiology in vitro. Nat Rev Mol Cell Biol. 2006;7(3):211–24. doi: 10.1038/nrm1858. [DOI] [PubMed] [Google Scholar]
- 12.Yamada KM, Cukierman E. Modeling tissue morphogenesis and cancer in 3D. Cell. 2007;130(4):601–10. doi: 10.1016/j.cell.2007.08.006. [DOI] [PubMed] [Google Scholar]
- 13.Mueller-Klieser W. Three-dimensional cell cultures: from molecular mechanisms to clinical applications. Am J Physiol. 1997;273(4 Pt 1):C1109–23. doi: 10.1152/ajpcell.1997.273.4.C1109. [DOI] [PubMed] [Google Scholar]
- 14.Torisawa Y, Takagi A, Shiku H, Yasukawa T, Matsue T. A multicelluar spheroid-based drug sensitivity test by scanning electrochemical microscopy. Oncol Rep. 2005;13(6):1107–12. [PubMed] [Google Scholar]
- 15.Hotary KB, Allen ED, Brooks PC, Datta NS, Long MW, Weiss SJ. Membrane type I matrix metalloproteinase usurps tumor growth control imposed by the three-dimensional extracellular matrix. Cell. 2003;114(1):33–45. doi: 10.1016/s0092-8674(03)00513-0. [DOI] [PubMed] [Google Scholar]
- 16.Camps JL, Chang SM, Hsu TC, Freeman MR, Hong SJ, Zhau HE, et al. Fibroblast-mediated acceleration of human epithelial tumor growth in vivo. Proc Natl Acad Sci USA. 1990;87(1):75–9. doi: 10.1073/pnas.87.1.75. [DOI] [PMC free article] [PubMed] [Google Scholar]
- 17.Yang J, Fizazi K, Peleg S, Sikes CR, Raymond AK, Jamal N, et al. Prostate cancer cells induce osteoblast differentiation through a Cbfa1-dependent pathway. Cancer Res. 2001;61(14):5652–9. [PubMed] [Google Scholar]
- 18.Barrett JM, Mangold KA, Jilling T, Kaul KL. Bi-directional interactions of prostate cancer cells and bone marrow endothelial cells in three-dimensional culture. Prostate. 2005;64(1):75–82. doi: 10.1002/pros.20206. [DOI] [PubMed] [Google Scholar]
- 19.Ingram M, Techy GB, Saroufeem R, Yazan O, Narayan KS, Goodwin TJ, et al. Three-dimensional growth patterns of various human tumor cell lines in simulated microgravity of a NASA bioreactor. In Vitro Cell Dev Biol Anim. 1997;33(6):459–66. doi: 10.1007/s11626-997-0064-8. [DOI] [PubMed] [Google Scholar]
- 20.Klob D, Fischer M, Rothermel A, Simon JC, Robitzki AA. Drug testing on 3D in vitro tissues trapped on a microcavity chip. Lab Chip. 2008;8(6):879–84. doi: 10.1039/b800394g. [DOI] [PubMed] [Google Scholar]
- 21.Kunz-Schughart LA, Freyer JP, Hofstaedter F, Ebner R. The use of 3-D cultures for high-throughput screening: the multicellular spheroid model. J Biomol Screen. 2004;9(4):273–85. doi: 10.1177/1087057104265040. [DOI] [PubMed] [Google Scholar]
- 22.Kelm JM, Fussenegger M. Microscale tissue engineering using gravity-enforced cell assembly. Trends Biotechnol. 2004;22(4):195–202. doi: 10.1016/j.tibtech.2004.02.002. [DOI] [PubMed] [Google Scholar]
- 23.Lin RZ, Chang HY. Recent advances in three-dimensional multicellular spheroid culture for biomedical research. Biotechnol J. 2008;3(910):1172–84. doi: 10.1002/biot.200700228. [DOI] [PubMed] [Google Scholar]
- 24.Friedrich J, Ebner R, Kunz-Schughart LA. Experimental anti-tumor therapy in 3-D: spheroids-old hat or new challenge. Int J Radiat Biol. 2007;83(1112):849–71. doi: 10.1080/09553000701727531. [DOI] [PubMed] [Google Scholar]
- 25.Torisawa Y, Takagi A, Nahimoto Y, Yasukawa T, Shiku H, Matsue T. A multicellular spheroid array to realize spheroid formation, culture, and viability assay on a chip. Biomaterials. 2007;28(3):559–66. doi: 10.1016/j.biomaterials.2006.08.054. [DOI] [PubMed] [Google Scholar]
- 26.Wu LY, DiCarlo D, Lee LP. Microfluidic self-assembly of tumor spheroids for anticancer drug discovery. Biomed Microdev. 2008;10(2):197–202. doi: 10.1007/s10544-007-9125-8. [DOI] [PubMed] [Google Scholar]
- 27.Toh YC, Zhang C, Zhang J, Khong YM, Chang S, Samper VD, et al. A novel 3D mammalian cell perfusion-culture system in microfluidic channels. Lab Chip. 2007;7(3):302–9. doi: 10.1039/b614872g. [DOI] [PubMed] [Google Scholar]
- 28.Fukuda J, Khademhosseini A, Yeo Y, Yang X, Yeh J, Eng G, et al. Micromolding of photocrosslinkable chitosan hydrogel for spheroid microarray and co-cultures. Biomaterials. 2006;27(30):5259–67. doi: 10.1016/j.biomaterials.2006.05.044. [DOI] [PubMed] [Google Scholar]
- 29.Ungrin MD, Joshi C, Nica A, Bauwens C, Zandstra PW. Reproducible, ultra high-throughput formation of multicellular organization from single cell suspension-derived human embryonic stem cell aggregates. PLoS ONE. 2008;3(2):e1565. doi: 10.1371/journal.pone.0001565. [DOI] [PMC free article] [PubMed] [Google Scholar]
- 30.Leclerc E, Sakai Y, Fujii T. Microfluidic PDMS (polydimethylsiloxane) bioreactor for large-scale culture of hepatocytes. Biotechnol Prog. 2004;20(3):750–5. doi: 10.1021/bp0300568. [DOI] [PubMed] [Google Scholar]
- 31.Mori R, Sakai Y, Nakazawa K. Micropatterned organoid culture of rat hepatocytes and HepG2 cells. J Biosci Bioeng. 2008;106(3):237–42. doi: 10.1263/jbb.106.237. [DOI] [PubMed] [Google Scholar]
- 32.Korff T, Kimmina S, Martiny-Baron G, Augustin HG. Blood vessel maturation in a 3-dimensional spheroidal coculture model: direct contact with smooth muscle cells regulates endothelial cell quiescence and abrogates VEGF responsiveness. FASEB J. 2001;15(2):447–57. doi: 10.1096/fj.00-0139com. [DOI] [PubMed] [Google Scholar]
- 33.Kelm JM, Sanchez-Bustamante CD, Ehler E, Hoerstrup SP, Djonov V, Ittner L, et al. VEGF profiling and angiogenesis in human microtissues. J Biotechnol. 2005;118(2):213–29. doi: 10.1016/j.jbiotec.2005.03.016. [DOI] [PubMed] [Google Scholar]
- 34.Torisawa Y, Chueh BH, Huh D, Ramamurthy P, Roth TM, Barald KF, et al. Efficient synchronous formation of uniform-sized embryoid bodies using a compartmentalized microchannel device. Lab Chip. 2007;7(6):770–6. doi: 10.1039/b618439a. [DOI] [PubMed] [Google Scholar]
- 35.Franceschi RT, Iyer BS. Relationship between collagen synthesis and expression of the osteoblast phenotype in MC3T3-E1 cells. J Bone Miner Res. 1992;7(2):235–46. doi: 10.1002/jbmr.5650070216. [DOI] [PubMed] [Google Scholar]
- 36.Franceschi RT, Iyer BS, Chi Y. Effects of ascorbic acid on collagen matrix formation and osteoblast differentiation in murine MC3T3-E1 cells. J Bone Miner Res. 1994;9(6):843–54. doi: 10.1002/jbmr.5650090610. [DOI] [PubMed] [Google Scholar]
- 37.Kelm JM, Timmins NE, Brown CJ, Fussenegger M, Nielsen LK. Method for generation of homogeneous multicellular tumor spheroids applicable to a wide variety of cell types. Biotechnol Bioeng. 2003;83(2):173–80. doi: 10.1002/bit.10655. [DOI] [PubMed] [Google Scholar]
- 38.Nakanishi H, Mazda O, Satoh E, Asada H, Morioka H, Kishida T, et al. Nonviral genetic transfer of Fas ligand induced significant growth suppression and apoptotic tumor cell death in prostate cancer in vivo. Gene Ther. 2003;10(5):434–42. doi: 10.1038/sj.gt.3301912. [DOI] [PubMed] [Google Scholar]
- 39.Singh AV, Xiao D, Lew KL, Dhir R, Singh SV. Sulforaphane induces caspase-mediated apoptosis in cultured PC-3 human prostate cancer cells and retards growth of PC-3 xenografts in vivo. Carcinogenesis. 2004;25(1):83–90. doi: 10.1093/carcin/bgg178. [DOI] [PubMed] [Google Scholar]
- 40.Li Y, Li CX, Ye H, Chen F, Melamed J, Yi P, et al. Decrease in stromal androgen receptor associates with androgen-independent disease and promotes prostate cancer cell proliferation and invasion. J Cell Mol Med. 2008 doi: 10.1111/j.1582-4934.2008.00279.x. Published Online. [DOI] [PMC free article] [PubMed] [Google Scholar]
- 41.Huh D, Fujioka H, Tung YC, Futai N, Paine R, III, Grotberg JB, et al. Acoustically detectable cellular-level lung injury induced by fluid mechanical stresses in microfluidic airway systems. Proc Natl Acad Sci USA. 2007;104(48):18886–91. doi: 10.1073/pnas.0610868104. [DOI] [PMC free article] [PubMed] [Google Scholar]