Abstract
Objective
To describe the visual functions and relate them to MRI findings and the intellectual level in adolescents born with very low birth weight (VLBW).
Design
Population‐based case–control study.
Patients
59 15‐year‐old VLBW adolescents and 55 sex and age‐matched controls with normal birth weight.
Main outcome measures
Objective clinical findings (visual acuity, stereo acuity and cycloplegic refraction) were recorded. Structured history taking was used to identify visual difficulties. The intellectual level was assessed with the Wechsler Intelligence Scale for Children (WISC). All VLBW adolescents underwent MRI of the brain.
Results
Significant differences were found between the VLBW adolescents and controls regarding visual acuity (median −0.11 and −0.2, respectively; p = 0.004), stereo acuity (median 60″ and 30″, respectively; p<0.001), prevalence of astigmatism (11/58 and 0/55, respectively; p<0.001) and in full‐scale IQ (mean IQ 85 and 97, respectively; p<0.001) and performance IQ (mean 87 and 99, respectively; p = 0.002). The structured history also revealed a borderline significant difference between the groups (mean problems 0.46 and 0.15 respectively; p = 0.051). 30% (17/57) of the VLBW adolescents had abnormal MRI findings and performed worse in all tests, compared with both the VLBW adolescents without MRI pathology and the normal controls.
Conclusion
This study confirms previous observations that VLBW adolescents are at a disadvantage regarding visual outcome compared with those with normal birth weight. In 47%, visual dysfunction was associated with abnormal MRI findings and in 33% with learning disabilities. The adolescents with abnormal MRI findings had more pronounced visual and cognitive dysfunction. The findings indicate a cerebral causative component for the visual dysfunction seen in the present study.
Keywords: visual function, very low birth weight, white matter damage of immaturity, adolescents, magnetic resonance imaging
Children with very low birth weight (VLBW), ⩽1500 g, constitute a heterogeneous group of premature children born small for gestational age or with a birth weight appropriate for gestational age. Within this group different mechanisms of visual disturbance have been reported. Retinopathy of prematurity (ROP) is closely related to the degree of prematurity and may cause visual impairment and blindness.1 Other complications of VLBW, not related to ROP, are subnormal visual acuity, stereopsis, and an increased prevalence of strabismus and refractive errors.2,3,4,5,6 Children with VLBW may also have markedly lower intellectual levels, measured by the Wechsler Intelligence Scale for Children (WISC), especially in visuospatial tasks.7,8 White matter damage of immaturity (WMDI) due to hemorrhagic infarction and periventricular leukomalacia can also be seen in these children. WMDI usually occurs during the early third trimester,9 and it may cause cerebral palsy as a result of damage of the corticospinal tracts10,11 and/or visual impairment as a result of damage of the geniculostriate and associated tracts.12,13 Visual dysfunction related to WMDI in children has been described,14,15 and is characterised by subnormal visual acuity, complicated by perceptual and cognitive visual problems.
However, there is limited knowledge of persisting visual problems in adolescents born with VLBW. In a population‐based study of children with a birth weight <1750 g, Olsén et al found that the prevalence of WMDI, documented by magnetic resonance imaging (MRI), was 32%.16 In that study 9% of the children had cerebral palsy.16 Cognitive ability of the preterm children was significantly lower than the controls,7 but visual function was not accounted for.
The aim of the current study was to describe the visual functions in adolescents born with VLBW and relate them to magnetic resonance imaging (MRI) findings and intellectual level.
Subjects and methods
The local ethical committee approved the study, which was conducted according to the Helsinki declaration.
Subjects
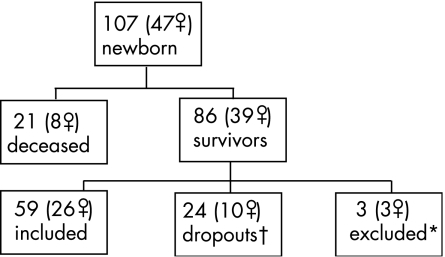
The study population consisted of all live‐born VLBW infants (n = 107) born in the southeast region of Sweden during a 15‐month period. They were screened for ROP only once, at the age of 40 postmenstrual weeks. Two subjects were identified early as having visual impairment due to ROP, one of whom was excluded from the present study. Fifty‐nine VLBW adolescents participated in the study of visual function at 15 years of age (fig 1). Written informed consent was obtained from all children and their parents prior to enrolment.
Figure 1 Flow diagram of the very low birth weight study population at 15 years. *One adolescent had Down's syndrome, one adolescent had severe cerebral palsy (tetraplegia) and severe learning disability, one adolescent had moderate cerebral palsy (diplegia), severe learning disability and blindness due to retinopathy of prematurity. †Two boys had mild cerebral palsy (hemiplegia and diplegia).
In the early neonatal period, a pair‐matched control group of 86 infants was recruited with respect to hospital, sex and maternal parity. Of these, 19 did not want to participate and 11 did not respond to the invitation to participate in the current study; one child had died at the age of 12 years. With 55 controls, complete matching of pairs was not achieved at the 15‐year follow‐up. Therefore, we conducted group comparisons.
All adolescents included in the present study (table 1) had been examined previously.17 We found no significant differences in birth weight or birth weight standard deviation scores (BWSDS) between the participants and those who dropped out. The dropouts were born at a mean gestational age of 30 weeks (range 25–35) and the participants at 31 weeks (range 25–37) (p = 0.039).
Table 1 Demographic and clinical data.
| Controls (n = 55) | Very low birth weight (n = 59) | |||
|---|---|---|---|---|
| Girls (n = 26) | Boys (n = 29) | Girls (n = 26) | Boys (n = 33) | |
| Birth weight (g) | ||||
| Mean (SD) | 3470 (447) | 3621 (526) | 1195 (192) | 1199 (210) |
| Range | 2690 to 4600 | 2230 to 4570 | 860 to 1500 | 685 to 1495 |
| Small for gestational age (n) | 0 | 1 | 17 | 18 |
| Birth weight standard deviation scores | ||||
| Mean (SD) | – | – | –2.89 (1.26) | –2.39 (1.21) |
| Range | – | – | –4.81 to −0.41 | –4.1 to −0.013 |
| Gestational age (weeks) | ||||
| Mean (SD) | 40 (1) | 40 (1) | 32 (2) | 31 (2) |
| Range | 38 to 42 | 37 to 42 | 27 to 38 | 26 to 35 |
| Cerebral palsy (n) | 0 | 0 | 0 | 5 |
| Strabismus (n) | 1 | 0 | 0 | 4 |
| Retinopathy of prematurity (n) | 0 | 1 | ||
Methods
Four teams conducted the ophthalmologic examinations at six settings in southern Sweden, depending on the place of residence of the subjects, over a period of 15 months.
Visual acuity
Best corrected monocular and binocular distance visual acuity was assessed with the line letter KM chart, based on seven letters with similar legibility.18,19 The progression is geometric and the maximal measurable visual acuity is −0.3 logMAR (decimal 2.0). The KM chart is designed for a testing distance of 3 m and has been used previously in a similar study.20 Visual acuity was defined according to clinical practice as at least 70% correctly read letters and is expressed as logMAR (decimal). Binocular visual acuity >0 logMar (<1.0 decimal) was defined as subnormal.
Table 2 Persistent visual problems (%) in the two study groups.
| Depth | Simultaneous perception | Motion | Face recognition | Orientation | ||
|---|---|---|---|---|---|---|
| Very low birth weight | 12 | 12 | 5 | 3 | 14 | |
| Controls | 4 | 2 | 0 | 2 | 7 |
Stereo acuity
Stereo acuity was tested using the TNO (Netherlands Organisation for Applied Scientific Research) random dot stereo test.21 Normal stereo acuity was defined as a resolution of 60 s of arc (″) or less. Subjects with no quantitatively measurable stereo acuity were assigned a nominal high score.
Refraction
Myopia was defined as ⩾−0.5 D in any eye (spherical equivalent), hyperopia as ⩾+2 D in any eye (spherical equivalent), and astigmatism as >1 D cylindrical error in any eye.22,23
Structured history
A structured history24 regarding problems in five areas (face recognition, orientation, perception of depth and motion, and simultaneous perception) was taken to identify and characterise remaining visual difficulties.
Visual dysfunction
Visual dysfunction was defined as binocular visual acuity >0 logMAR (<1.0 decimal) or >0.65 logMAR (<0.3 decimal) in the worst eye, or stereopsis >60″, or any persistent problem revealed in the structured history taking.
Strabismus
Strabismus was assessed using the cover test.
Intellectual level
What is already known on this topic
Children born with very low birth weight have increased frequency of strabismus, refractive errors, decreased visual acuity and lower intellectual capacity. They also have an increased risk of periventricular white matter damage causing cerebral palsy and visual impairment.
What this study adds
This is, to our knowledge, the first population‐based study on the long‐term effect of periventricular white matter damage, diagnosed with MRI, on visual and cognitive function in adolescents born with very low birth weight.
We used the Swedish version of the WISC‐III, a standardised test to measure children's intellectual level. The scale comprises 10 subscales that are organised in two groups: verbal tests (VIQ, verbal intelligence quotient) and visuospatial, performance tests (PIQ, performance intelligence quotient). The total score of the two tests can be converted to a full‐scale intelligence quotient (FSIQ) score comparable with population‐based normative data.25 A FSIQ below −2 SD (<70) is regarded as having learning disability.
Magnetic resonance imaging
MRI examinations of the brain were conducted at six local hospitals. The adapted imaging protocols followed a predefined general guideline. The WMDI findings were classified by one of the authors (OF) as normal, mild (loss of <25% of periventricular white matter or only gliosis), moderate (loss of >25% to <50% of periventricular white matter) or severe abnormality (>50% loss of periventricular white matter). For the purposes of the current study we compared the examination findings from VLBW adolescents with (MRI+) and without (MRI−) MRI abnormalities.
Statistical analysis
We analysed the data using the Mann–Whitney U test, χ22 test and Fisher's exact test, and for linear regression we used analysis of variance. A p value of <0.05 was regarded as significant.
Results
Visual acuity
The median distance binocular, line visual acuity was −0.11 (range 0.6 to −0.3) in the VLBW group and −0.2 (range 0.1 to −0.3) in the control group (p = 0.004). Three VLBW adolescents and one control had subnormal binocular visual acuity.
Stereo acuity
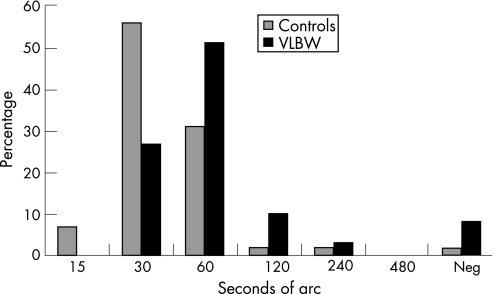
Thirteen VLBW adolescents (22%) and three controls (5%) had subnormal stereo acuity (p = 0.011). The median value of stereo acuity (adolescents with strabismus excluded) for the control group was 30″ and for the VLBW group 60″ (p<0.001). Figure 2 shows the percentage distribution of stereo acuity.
Figure 2 Stereo acuity in percentage. Neg, negative; VLBW, very low birth weight.
Refraction
Significantly more VLBW adolescents (11/58; one adolescent refused cycloplegic eye drops) had astigmatic refractive errors than controls (0/55) (p<0.001). We found no significant difference in the prevalence of myopia and hyperopia between the examined groups.
Structured history
The VLBW adolescents had more persistent visual problems identified by the structured history taking than the controls (mean visual problem per individual 0.46 and 0.15 respectively; p = 0.051). Thirteen VLBW subjects (22%) and five controls (9%) had persistent visual problems in at least one area (p = 0.074).
Visual dysfunction
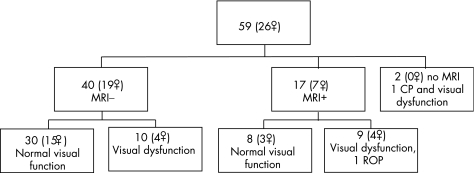
Overall 20 VLBW adolescents (fig 3) and 7 controls (3 girls) had visual dysfunction (p = 0.009) according to the predefined criteria.
Figure 3 Flow diagram showing distribution of visual dysfunction in the very low birth weight adolescents at 15 years. CP, cerebral palsy; ROP, retinopathy of prematurity.
Strabismus
One control subject had esotropia. Two VLBW adolescents had esotropia, one had exotropia/hypotropia and one had microtropia (microstrabismus with amblyopia in one eye).
Intellectual level
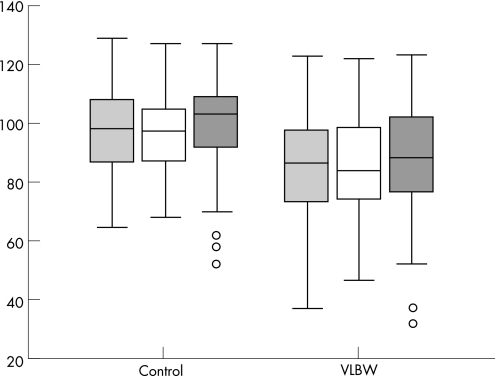
Two of the 59 VLBW adolescents did not take the WISC‐III test and one failed to complete all subtests. Figure 4 shows the results of the WISC‐III tests. In the VLBW group 11 had learning disabilities (FSIQ <70) compared with 1 in the control (p = 0.002). Also, 11 VLBW adolescents but only 3 controls had PIQ <70 (p = 0.024).
Figure 4 Median and interquartile range for full‐scale IQ (light grey boxes; p<0.0001), verbal IQ (white boxes; p = 0.001) and performance IQ (dark grey boxes; p = 0.002) in the control and very low birth weight (VLBW) adolescents estimated in IQ units in WISC‐III.
Intellectual level and visual function
The VLBW subjects with PIQ <70 had significantly lower binocular visual acuity (p = 0.014), lower stereopsis (p = 0.002) and more persistent visual problems in the structured history taking (p = 0.027) than the VLBW subjects with PIQ ⩾70. VLBW adolescents with learning disabilities had significantly lower binocular visual acuity (p<0.001), higher frequency of astigmatism (p = 0.019), and more persistent visual problems according to the structured history (p = 0.032) than the other VLBW adolescents.
We found no correlation between BWSDS or gestational age and visual findings.
Magnetic resonance imaging
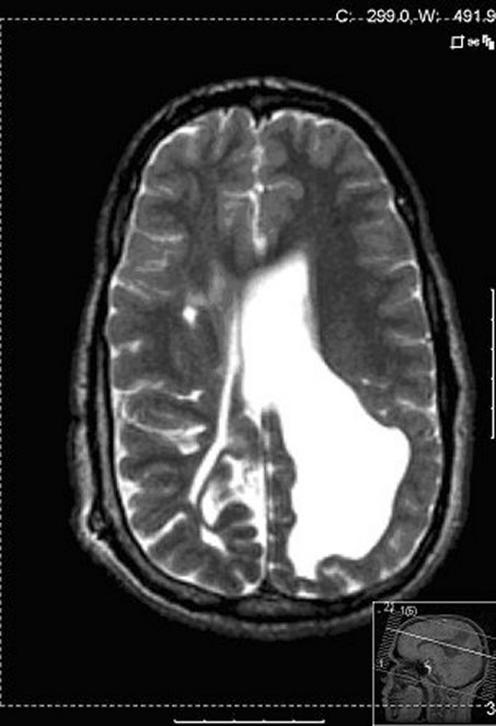
MRI was carried out for 57/59 VLBW adolescents—17 had abnormal findings, 16 WMDI and 1 malformation. The abnormalities were mild in 13 and moderate to severe in 3 (fig 5).
Figure 5 MRI (axial T2‐weighted sequence) from one of the VLBW adolescents with binocular distance visual acuity logMAR 0.19, strabismus, no stereo acuity and reported persisting visual cognitive problems in all five areas, full‐scale IQ = 51, verbal IQ = 74, performance IQ = 37.
MRI and visual function
We found no significant difference regarding distance binocular or best eye visual acuity between the MRI+ and MRI− groups. The visual acuity of the worst eye differed significantly between the MRI groups (p = 0.029). Significantly more MRI+ adolescents (7/17) had subnormal stereo acuity than MRI− adolescents (5/40) (p = 0.029). Refractive errors were significantly more common among the MRI+ (11/17) than among the MRI− adolescents (13/40) (p = 0.039). Myopia was significantly more common in the MRI+ group (7/17) than in the MRI− group (6/39; one adolescent refused cycloplegic eye drops) (p = 0.046). Table 3 summarises the clinical findings in the MRI+ group.
Table 3 Neonatal characteristics and neurological and ophthalmological outcome in the adolescents with magnetic resonance imaging (MRI) abnormalities.
| Sex | Gestational age (weeks) | BWSDS | WMDI | TNO | VA logMAR (dec) | Strabismus | Spherical equivalence (⩽–0.5 or (⩾+2 D) RE/LE | Astigmatism (>1D) RE/LE | CP | FSIQ | VIQ | PIQ |
|---|---|---|---|---|---|---|---|---|---|---|---|---|
| Boy | 25 | –1.31 | Severe | Neg | 0.3 (0.5) | E | 5.13/5.25 | –4.25/–3.5 | dpl | † | † | † |
| Boy | 26 | –2.15 | Moderate | Neg | 0.6 (0.25) | E | –10.13/–9.38 | –2.25/–1.75 | dpl | 37 | 47 | 32 |
| Girl | 27 | –0.41 | Mild | 120 | –0.11 (1.3) | – | –/–1.63 | No | No | 102 | 99 | 105 |
| Boy | 29 | –2.3 | Mild | 60 | 0 (1.0) | – | –0.63/– | No | dpl | 53 | 61 | 55 |
| Boy | 29 | –0.34 | Mild | 240 | –0.11 (1.3) | – | 4/4.5 | No | No | 93 | 83 | 106 |
| Girl | 30 | –1.17 | Mild | 60 | –0.2 (1.6) | – | – | No | No | 98 | 11 | 97 |
| Girl | 30 | –0.73 | Mild | 120 | –0.11 (1.3) | – | –3.25/–3.5 | No | No | 83 | 84 | 85 |
| Boy | 31 | –3.06 | Mild | 30 | –0.2 (1.6) | – | –/–0.5 | No | No | 98 | 91 | 106 |
| Boy | 31 | –3.01 | Mild | 30 | –0.2 (1.6) | – | – | No | No | 58 | 72 | 52 |
| Boy | 31 | –2.99 | Severe | Neg | 0.19 (0.65) | X/H | –1.75/–1.63 | –1.5/–1.25 | hpl | 51 | 74 | 37 |
| Girl | 31 | –2.04 | Mild | 60 | –0.11 (1.3) | – | 4.88/5.63 | No | No | 94 | 94 | 95 |
| Girl | 32 | –4.49 | Mild | 60 | –0.11 (1.3) | – | –7.38/–6.0 | –1.25/–0.5 | No | 96 | 103 | 89 |
| Boy | 32 | –2.31 | Mild | 60 | –0.11 (1.3) | – | – | No | No | 87 | 82 | 95 |
| Boy | 33 | –4.1 | None* | 120 | –0.11 (1.3) | – | – | –1.25/–1.5 | No | 65 | 78 | 58 |
| Girl | 33 | –3.48 | Mild | 30 | –0.11 (1.3) | – | – | No | No | 103 | 94 | 114 |
| Boy | 34 | –3.83 | Mild | 30 | –0.11 (1.3) | – | – | No | No | 96 | 99 | 92 |
| Girl | 37 | –4.51 | Mild | 30 | –0.11 (1.3) | – | – | No | No | 69 | 73 | 73 |
BWSDS, birth weight standard deviation scores; CP, cerebral palsy; dpl, diplegia; E, esotropia; FSIQ, full‐scale IQ; H, hypotropia; hpl, hemiplegia; LE, left eye; Neg, negative; PIQ, performance IQ; RE, right eye; VA, distance binocular visual acuity; VIQ, verbal IQ; WMDI, white matter damage of immaturity; X, exotropia.
*Malformation.
†Failed completion of subtests.
The difference in distance binocular visual acuity (p = 0.01), stereo acuity (p = 0.01) and prevalence of astigmatism (p = 0.004) between the VLBW adolescents and the controls persisted when we compared the VLBW adolescents with normal MRI results (n = 40) with the controls (n = 55). The structured history revealed persistent problems in 6/17 (35%) MRI+ and 6/40 (15%) MRI− adolescents in one or more areas. We did not find any correlation between birth data (birth weight, BWSDS and gestational age) and the presence of MRI abnormalities. There were no statistically significant sex differences in MRI findings or visual outcome.
Discussion
The present study revealed that adolescents born with VLBW had significantly lower visual acuity, lower stereo acuity, greater astigmatism and greater visual problems, according to the structured history taking, compared with an age and sex‐matched control group. However, visual impairment at the levels defined by the World Health Organization (WHO) was rare among adolescents born with VLBW. The adolescents with the worst visual outcome all had cerebral abnormalities. In addition, half of the ex‐VLBW adolescents who had any visual dysfunction had abnormal MRI findings, indicating a cerebral component in this group. The three adolescents with the worst outcome were excluded from the study group and four of those who chose not to participate had cerebral palsy. Therefore the findings of visual and cerebral sequelae may not be representative but underestimated.
Male sex has been described to entail a higher risk for worse neurodevelopmental outcome among low birth weight children.26,27 Although we did not find any statistically significant sex differences in the current study group, adolescents with cerebral palsy, those with the worst visual outcome and those with moderate and severe WMDI were all boys. Only one adolescent had known cicatricial ROP and was visually impaired according to the WHO standards. However, the design of ROP screening with one single examination at postmenstrual age 40 weeks did not allow us to acquire information about the prevalence of spontaneously regressed ROP in this group.
Regarding refractive errors, a fifth of the VLBW group (19%) had astigmatism compared with none in the control group. The median visual acuity was higher in the studied groups than in a similar, although younger population,3 which possibly can be explained by the difference in age.28 In keeping with previous studies29 stereo acuity was lower in the VLBW group than in the control group and was also associated with low PIQ, but not with low VIQ. Thus stereo acuity may well influence the difficulties that VLBW adolescents have with visuospatial tasks, or may be an indicator of cognitive visual problems.
Eleven VLBW adolescents (20%) had learning disabilities and they also had more visual problems than those with normal FSIQ. One could speculate whether this association between poor visual outcome and learning disabilities is the consequence of deficient visual input (ie lesions engaging the optic radiation) or deficient visual processing (ie lesions engaging associate visual pathways) or both. The structured history revealed significantly more visual problems in the VLBW group. There was an association between these problems and low PIQ. Thus taking a structured history, an easily carried out procedure, reveals cognitive visual dysfunction, indicating a cerebral cause.
Interestingly there was a significant difference in visual acuity, stereo acuity and frequency of astigmatism between the VLBW adolescents with normal MRI findings and the controls. Reduced cerebral volume and more subtle brain damage have previously been described in VLBW adolescents examined with quantitative and diffusion MRI techniques.30 In the current study such brain damage could not be diagnosed, as quantitative and diffusion techniques were not used. Hence the group with normal MRI findings may have included adolescents with pathology diagnosed with quantitative and diffusion MRI techniques. The prevalence of WMDI, 16/57 (28%), is quite similar to that reported by Olsén (32%).16 These 16 adolescents also had more visual, refractive and persistent visual problems than the VLBW adolescents without WMDI.
Conclusion
This study confirms previous observations that adolescents with VLBW are at a disadvantage regarding visual outcome compared with adolescents with normal birth weight. Adolescents with abnormal MRI had more pronounced visual and cognitive dysfunction. Only one adolescent in the present study had visually impairment (ROP and WMDI) according to WHO criteria. However, a third of the VLBW group had some visual dysfunction. Of those with visual dysfunction half had brain pathology documented with MRI and a third of them had learning disabilities, indicating a cerebral causative component.
Acknowledgement
This report is part of a multidisciplinary prospective follow‐up study of VLBW children and controls in southeast Sweden. The examination at 15 years of age was planned and performed by a working group with the following members in addition to the authorship of this paper: Orvar Finnström, Ingemar Leijon, PO Gäddlin, Stefan Samuelsson, Chen Wang, Eva Aring and JanYgge.
Abbreviations
BWSDS - birth weight standard deviation scores
FISQ - full‐scale intelligence quotient
PIQ - performance IQ
ROP - retinopathy of prematurity
VIQ - verbal IQ
VLBW - very low birth weight, WISC, Wechsler Intelligence Scale for Children
WMDI - white matter damage of immaturity
Footnotes
This research was funded by a grant from the Health Research Council in the South‐East of Sweden (FORSS), the County of Jönköping and Östergötland, Solstickan Foundation, Stockholm, and Sigvard and Marianne Bernadottes Forskningsstiftelse för Barnögonvård.
Competing interests: None.
References
- 1.Holmstrom G, Broberger U, Thomassen P. Neonatal risk factors for retinopathy of prematurity—a population‐based study. Acta Ophthalmol Scand 199876204–207. [DOI] [PubMed] [Google Scholar]
- 2.Larsson E, Rydberg A, Holmström G. A population‐based study of the refractive outcome in 10‐year‐old preterm and full‐term children. Arch Ophthalmol 20031211430–1436. [DOI] [PubMed] [Google Scholar]
- 3.Larsson E K, Rydberg A C, Holmström G E. A population‐based study on the visual outcome in 10‐year‐old preterm and full‐term children. Arch Ophthalmol 2005123825–832. [DOI] [PubMed] [Google Scholar]
- 4.Darlow B A, Clemett R S, Horwood L J.et al Prospective study of New Zealand infants with birth weight less than 1500 g and screened for retinopathy of prematurity: visual outcome at age 7–8 years. Br J Ophthalmol 199781935–940. [DOI] [PMC free article] [PubMed] [Google Scholar]
- 5.Hård A L, Niklasson A, Svensson E.et al Visual function in school‐aged children born before 29 weeks of gestation: a population‐based study. Dev Med Child Neurol 200042100–105. [DOI] [PubMed] [Google Scholar]
- 6.O'Connor A R, Stephenson T J, Johnson A.et al Visual function in low birthweight children. Br J Ophthalmol 2004881149–1153. [DOI] [PMC free article] [PubMed] [Google Scholar]
- 7.Olsén P, Vainionpää L, Pääkkö E.et al Psychological findings in preterm children related to neurologic status and magnetic resonance imaging. Pediatrics 1998102329–336. [DOI] [PubMed] [Google Scholar]
- 8.Botting N, Powls A, Cooke R W.et al Cognitive and educational outcome of very‐low‐birthweight children in early adolescence. Dev Med Child Neurol 199840652–660. [DOI] [PubMed] [Google Scholar]
- 9.Krägeloh‐Mann I. Imaging of early brain injury and cortical plasticity. Exp Neurol 200419084–90. [DOI] [PubMed] [Google Scholar]
- 10.Krägeloh‐Mann I, Hagberg B, Petersen D.et al Bilateral spastic cerebral palsy—pathogenetic aspects from MRI. Neuropediatrics 19922346–48. [DOI] [PubMed] [Google Scholar]
- 11.Staudt M, Pavlova M, Böhm S.et al Pyramidal tract damage correlates with motor dysfunction in bilateral periventricular leukomalacia. Neuropediatrics 200334182–188. [DOI] [PubMed] [Google Scholar]
- 12.Banker B Q, Larroche J C. Periventricular leukomalacia of infancy. A form of neonatal anoxic encephalopathy. Arch Neurol 19627386–410. [DOI] [PubMed] [Google Scholar]
- 13.Cioni G, Fazzi B, Coluccini M.et al Cerebral visual impairment in preterm infants with periventricular leukomalacia. Pediatr Neurol 199717331–338. [DOI] [PubMed] [Google Scholar]
- 14.Jacobson L, Ek U, Fernell E.et al Visual impairment in preterm children with periventricular leucomalacia: visual, cognitive and neuropaediatric characteristics related to cerebral imaging. Dev Med Child Neurol 199638724–735. [DOI] [PubMed] [Google Scholar]
- 15.Hård A L, Aring E, Hellström A. Subnormal visual perception at school‐age in ex‐preterm patients in a paediatric eye clinic. Eye 200418628–634. [DOI] [PubMed] [Google Scholar]
- 16.Olsén P, Pääkkö E, Vainionpää L.et al Magnetic resonance imaging of periventricular leukomalacia and its clinical correlation in children. Ann Neurol 199741754–761. [DOI] [PubMed] [Google Scholar]
- 17.Finnström O, Gäddlin P O, Leijon I.et al Very‐low‐birth‐weight children at school age: academic achievement, behavior and self‐esteem and relation to risk factors. J Matern Fetal Neonatal Med 20031475–84. [DOI] [PubMed] [Google Scholar]
- 18.Moutakis K, Stigmar G, Hall‐Linderg J. Using the KM visual acuity chart for more reliable evaluation of amblyopia compared to the HVOT method. Acta Ophthalmol Scand 200482547–551. [DOI] [PubMed] [Google Scholar]
- 19.Hedin A, Olsson K. Letter legibility and the construction of a new visual acuity chart. Ophthalmologica 1984189147–156. [DOI] [PubMed] [Google Scholar]
- 20.Grönlund M A, Aring E, Hellström A.et al Visual and ocular findings in children adopted from eastern Europe. Br J Ophthalmol 2004881362–1367. [DOI] [PMC free article] [PubMed] [Google Scholar]
- 21. TNO test for stereoscopic vision, 10th ed. Nieuwegein, The Netherlands: Lameris Ootech, 1972
- 22.Negrel A D, Maul E, Pokharel G P.et al Refractive error study in children: sampling and measurement methods for a multi‐country survey. Am J Ophthalmol 2000129421–426. [DOI] [PubMed] [Google Scholar]
- 23.Andersson Grönlund M, Andersson S, Aring E.et al Ophthalmological findings in a sample of Swedish children aged 4–15 years. Acta Ophthalmol Scand 200684169–176. [DOI] [PubMed] [Google Scholar]
- 24.Dutton G, Ballantyne J, Boyd G.et al Cortical visual dysfunction in children: a clinical study. Eye 199610302–309. [DOI] [PubMed] [Google Scholar]
- 25.Wechsler D.WISC‐III. Swedish version [manual]. Stockholm: Psykologiförlaget, 1999
- 26.Sommerfelt K, Ellertsen B, Markestad T. Low birthweight and neuromotor development: a population based, controlled study. Acta Paediatr 199685604–610. [DOI] [PubMed] [Google Scholar]
- 27.Hintz S, Kendrick D, Vohr B.et al Gender differences in neurodevelopmental outcomes among extremely preterm, extremely‐low‐birthweight infants. Acta Paediatr 2006951239–1248. [DOI] [PubMed] [Google Scholar]
- 28.Ohlsson J, Villarreal G. Normal visual acuity in 17–18 year olds. Acta Ophthalmol Scand 200583487–491. [DOI] [PubMed] [Google Scholar]
- 29.Powls A, Botting N, Cooke R W I.et al Visual impairment in very low birth weight children. Arch Dis Child 19977682–87. [DOI] [PMC free article] [PubMed] [Google Scholar]
- 30.Abernethy L J, Palaniappan M, Cooke R W I. Quantitative magnetic resonance imaging of the brain in survivors of very low birth weight. Arch Dis Child 200287279–283. [DOI] [PMC free article] [PubMed] [Google Scholar]


