Abstract
Aim
To determine the accuracy of delayed arterial gas sampling (1) from the umbilical cord and (2) from the placental surface at room temperature.
Methods
Term deliveries were classified a priori into three groups: normal vaginal deliveries, elective caesarean sections and high risk deliveries. The cord was double clamped and paired arterial samples were taken from the cord and the placenta at 0, 30, 60 and 90 min.
Results
90 placentas were sampled with 30 cases per group. At time 0 the mean cord pH 7.207 (±0.08) was significantly lower than the placenta pH 7.240 (±0.08). The cord pH dropped significantly: by 0.050 (95% CI 0.036 to 0.063) at 30 min, 0.087 (95% CI 0.069 to 0.105) at 60 min, and 0.112 (95% CI 0.086 to 0.138) at 90 min. The placenta pH fell at twice the rate of the cord pH over 90 min. At time 0 the mean cord base excess –7.0 mmol/l (±4.1) was significantly lower than the placenta base excess –6.3 mmol/l (±3.6). The cord base excess fell at 30 min by 4.1 mmol/l (95% CI 3.4 to 4.7), at 60 min by 7.1 mmol/l (95% CI 6.1 to 8.0), and at 90 min by 9.0 mmol/l (95% CI 7.9 to 10.0). The pH and base excess rate of fall was similar for each of the three delivery groups despite differing starting values.
Conclusion
Arterial blood gases should be taken as soon as possible after delivery from the umbilical cord. However, when this is not possible, the arterial pH and base excess from a delayed sample from a clamped cord at room temperature can be used to estimate the values at birth.
The umbilical cord arterial acid‐base status is an important measure of the condition of the neonate at birth and is more objective than the Apgar score.1 Babies are routinely assigned an Apgar score at birth but not all have an arterial cord gas taken. The need for a routine cord gas is controversial and has been a subject of much debate.2,3 There are three common situations in which a delayed arterial cord gas may be indicated. Firstly, due to resuscitative efforts there may be a delay in obtaining an arterial gas until the baby is stable. Secondly, a sample is collected and sent to the laboratory, but is considered unsuitable in quality or quantity and no result is provided. Thirdly, a baby appears well initially and no sample is taken, but subsequently deteriorates clinically. Even if the cord has been double clamped it can be difficult to take a late sample from the cord. In practice, when this occurs, the placental surface arteries are often used as an alternative site for blood sampling and this is supported by professional guidelines.4
If a delayed cord or placenta gas sample is taken, the time frame in which the sample will still be accurate needs to be clarified. Abnormal gas findings from delayed arterial samples may result in hypoxic ischaemic encephalopathy being incorrectly diagnosed as one criteria for the definition of an acute intrapartum hypoxic event is a low cord pH <7 and base excess <–12.5 Since the arterial blood gas result may be regarded as a critical piece of evidence in litigation, it is obviously important that findings from delayed sampling are able to be interpreted correctly.
The aim of this study was firstly to determine the accuracy of delayed sampling from the umbilical cord artery, and secondly to determine if the placental surface artery can be used as an alternative site for obtaining a blood gas sample, when the placenta has been stored at room temperature.
Patients and methods
Study design
This prospective study was undertaken at the Royal Prince Alfred Hospital (RPAH), Sydney between August and November 2005. Ethics approval was given and consent was obtained prior to delivery. Singleton term deliveries of all types were eligible. The cases were enrolled a priori into three groups in order to obtain a representative sample of the general population. The three groups were classified as normal vaginal deliveries, elective caesarean sections and high risk deliveries which included emergency caesarean sections in labour, instrumental deliveries and deliveries with suspected fetal distress (abnormal cardiotocograph or the presence of thick meconium).
After delivery of the baby the umbilical cord was double clamped and after delivery of the placenta paired samples were taken from the umbilical cord artery and the placental surface artery within 5 min (time 0) and then at 30, 60 and 90 min. If venous cord blood was being collected for stem cell donation the cord was clamped once and blood drawn from the vein. The cord was double clamped after the collection. The cord and placental surface were clamped over the sampling sites with forceps to prevent blood loss. The samples were all collected by the first author with a 23 gauge needle into 1 ml pre‐heparinised syringes with 25 units of dry heparin. Immediately after collection the samples were sent directly to the central hospital laboratory via an air shute and analysed by a Radiometer ABL 725 blood gas analyser within 15 min. The placenta was stored in a plastic container at room temperature (22.5–24°C). The placentas were analysed by experienced pathologists at RPAH for the presence of chorioamnionitis. The standardised, semiquantitative method of analysis used for chorioamnionitis has been shown to have good inter and intraobserver reliability and is reproducible and reliable.6 Data were collected on maternal age, parity, presence of hypertension, gestational diabetes, prolonged rupture of membranes >24 h, type of anaesthetic, mode of delivery, length of third stage, cord blood donation and chorioamnionitis. Neonatal data collection included gestational age, birthweight, sex, Apgar scores, abnormal cardiotocograph, presence of thick meconium or neonatal illness.
Statistical analysis
The data were entered into a database on SPSS version 11.5. For measurements on cord and placental blood at birth, descriptive statistics with mean and standard deviation (SD) were reported. For the changes over time within each group, paired samples t test was used, with mean difference and 95% confidence intervals reported. Other comparisons used independent sample t‐test as appropriate. Analysis of variance was used to compare the results from the three delivery groups.
Results
The study included 90 singleton pregnancies with 30 placentas in each of the following groups—normal vaginal deliveries, elective sections and high risk deliveries. The maternal and neonatal characteristics are shown in table 1. The mothers were a representative sample with the mean maternal age, rates of primiparity and maternal illness being comparable to the whole population at RPAH.
Table 1 Maternal and neonatal characteristics.
| NVD (n = 30) | Elective section (n = 30) | High risk (n = 30) | Total (n = 90) | |||||
|---|---|---|---|---|---|---|---|---|
| Maternal age (years, SD) | 30 | 5.8 | 34 | 4.2 | 31 | 5.5 | 32 | 5.5 |
| Primiparous (%) | 17 | 57 | 11 | 37 | 23 | 77 | 51 | 57 |
| Hypertension (%) | 6 | 20 | 2 | 7 | 2 | 7 | 10 | 11 |
| Gestational diabetes (%) | 2 | 7 | 3 | 10 | 1 | 3 | 6 | 7 |
| Length 3rd stage (minutes, SD) | 9.6 | 8.3 | 0.9 | 0.4 | 5.1 | 6.1 | 5.2 | 6.9 |
| Cord blood donation (%) | 4 | 13 | 10 | 33 | 1 | 3 | 15 | 17 |
| Chorioamnionitis (%) | 12 | 40 | 3 | 10 | 18 | 60 | 33 | 37 |
| Gestational age (weeks, SD) | 39.3 | 1.3 | 38.8 | 1 | 39.8 | 1.4 | 39.2 | 1.3 |
| Birthweight (grams, SD) | 3526 | 495 | 3534 | 571 | 3522 | 650 | 3527 | 569 |
NVD, normal vaginal delivery; SD, standard deviation.
Results of acid‐base status at birth
The time 0 cord arterial values reflected the subjects' differing condition at birth. The mean cord pH at birth was 7.207 (±0.08), mean base excess was −7 mmol/l (±4.1) and the mean CO2 was 57.2 mm Hg (±10.9). The placenta arterial pH had a mean value at birth of 7.240 (±0.08) which was significantly higher than the corresponding cord arterial pH (p<0.001). The mean placenta arterial base excess was –6.3 mmol/l (±3.6) which was also significantly higher than the corresponding cord value (p = 0.009). The mean placenta arterial CO2 at birth was 52.4 mm Hg (±12.1), which was significantly lower than the corresponding cord CO2 (p = 0.001).
Regarding the three delivery groups, the mean cord pH and base excess at birth were 7.180 (±0.06) and –9.0 mmol/l (±3.3) for normal vaginal deliveries, 7.226 (±0.07) and –4.4 mmol/l (±3.2) for elective caesarean sections and 7.215 (±0.09) and –7.5 mmol/l (±4.3) for high risk deliveries. When comparing the cord pH at birth for all delivery types the values were not significantly different (p = 0.05), but, the cord base excess values at birth were significantly different (p<0.001). When the comparison was limited to normal vaginal deliveries and elective sections, the cord pH and base excess for normal vaginal deliveries were both significantly lower (p = 0.01 and p<0.001 respectively) showing a protective effect in the elective section group.
Results of longitudinal acid‐base status
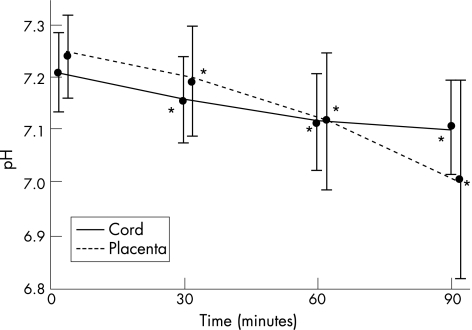
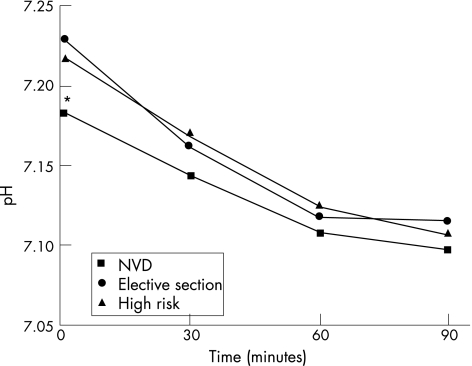
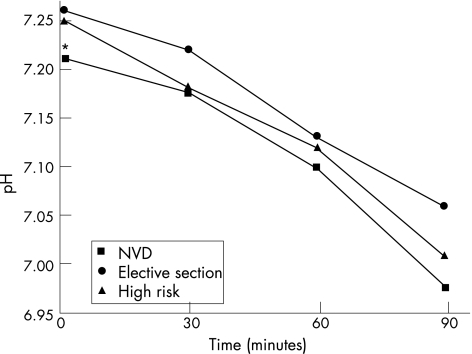
Figure 1 shows the mean arterial pH values for the total study group at 0, 30, 60 and 90 min for both cord and placenta arterial samples. The cord arterial pH fell steadily over time, with each measurement being significantly lower than the time 0 value (p<0.001). The placenta arterial pH also dropped significantly over time with each value being less than the birth value (p<0.001). The placenta pH fell twice as fast as the corresponding cord value over the 90 min of measurements. Figures 2 and 3 compare the cord and placenta longitudinal pH changes for each delivery group. The striking feature is the statistically similar rate of fall of the pH for each delivery group irrespective of the starting value.
Figure 1 Cord and placenta arterial pH changes over time. *p<0.001 within each group compared to the time 0 value. Mean values plotted with standard deviation.
Figure 2 Cord arterial pH changes over time for each delivery group. *p = 0.05 when comparing time 0 values for all three groups. NVD, normal vaginal delivery.
Figure 3 Placenta arterial pH changes over time for each delivery group. *p = 0.05 when comparing time 0 values for all three groups. NVD, normal vaginal delivery.
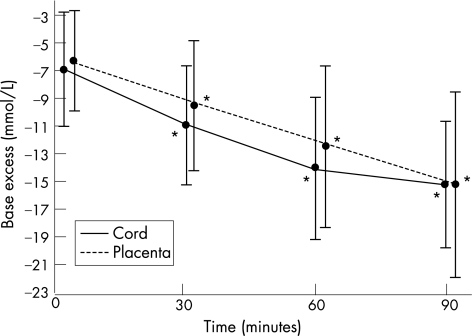
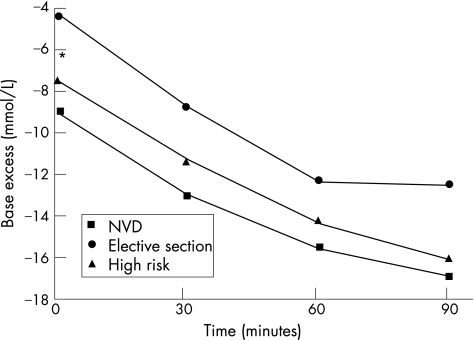
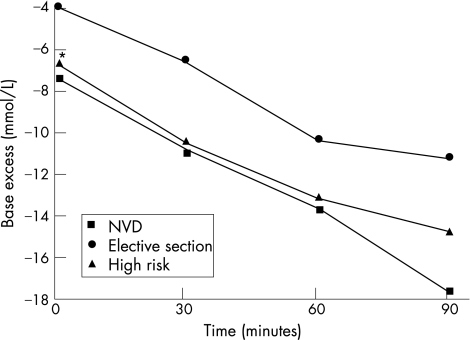
Figure 4 shows the mean arterial base excess values for the total study group for both cord and placenta samples. The cord arterial base excess decreased over time (became more negative) and fell at a similar rate to that of the placenta arterial base excess. Both the cord and placental base excess values at 30, 60 and 90 min were significantly lower than at time 0 (p<0.001). Figures 5 and 6 demonstrate again the non significant difference in the rate of fall of the base excess in the three delivery groups despite the values at birth being different.
Figure 4 Cord and placenta arterial base excess changes over time, *p<0.001 within each group compared to the time 0 value. Mean values plotted with standard deviation.
Figure 5 Cord arterial base excess changes over time for each delivery group. *p<0.001 when comparing time 0 values for all three groups. NVD, normal vaginal delivery.
Figure 6 Placenta arterial base excess changes over time for each delivery group. *p = 0.001 when comparing time 0 values for all three groups. NVD, normal vaginal delivery.
The cord and placenta CO2 values had opposite trends. The cord arterial CO2 fell steadily from 57.2 mm Hg at time 0, to 54.9 mm Hg, 52.6 mm Hg and 50.7 mm Hg at 30, 60 and 90 min (p<0.05). The placenta arterial CO2 was 52.4 mm Hg at time 0 and was stable at 30 min and then rose significantly to 60.8 mm Hg at 60 min and 67.3 mm Hg at 90 min (p = 0.004).
Further analysis of the longitudinal changes are shown in table 2 where the measured differences in the pH and base excess at 30, 60 and 90 min are compared with the values at baseline (time 0). The results are shown for the total study group and separately for the three delivery groups. There was a small subset of cases with a pH <7.1 at birth (n = 6) and base excess <–12 (n = 9). Unfortunately there were too few to be able to meaningfully compare the changes over time with cases of normal acid‐base parameters at birth.
Table 2 Changes in arterial pH and base excess from time zero to 30, 60 and 90 min.
| Δ 0–30 min (95% CI) | Δ 0–60 min (95% CI) | Δ 0–90 min (95% CI) | ||||||||||
|---|---|---|---|---|---|---|---|---|---|---|---|---|
| All | NVD | Elective section | High risk | All | NVD | Elective section | High risk | All | NVD | Elective section | High risk | |
| Valid sample pairs | 87 | 29 | 30 | 28 | 75 | 25 | 25 | 25 | 51 | 16 | 16 | 19 |
| Cord pH* | –0.050 (0.036–0.063) | –0.039 (0.013–0.064) | –0.066 (0.046–0.086) | –0.044 (0.018–0.070) | –0.087 (0.069–0.105) | –0.069 (0.041–0.097) | –0.110 (0.081–0.139) | –0.082 (0.046–0.117) | –0.112 (0.086–0.138) | –0.089 (0.043–0.135) | –0.116 (0.062–0.170) | –0.128 (0.082–0.174) |
| Placenta pH* | –0.047 (0.026–0.066) | –0.037 (0.004–0.078) | –0.039 (0.011–0.066) | –0.065 (0.034–0.096) | –0.125 (0.095–0.155) | –0.126 (0.062–0.190) | –0.126 (0.086–0.166) | –0.122 (0.064–0.180) | –0.240 (0.187–0.295) | –0.238 (0.151–0.325) | –0.210 (0.100–0.320) | –0.259 (0.161–0.357) |
| Cord BE* mmol/litre | –4.1 (3.4–4.7) | –4.1 (3.1–5.0) | –4.3 (3.3–5.4) | –3.8 (2.5–5.0) | –7.1 (6.1–8.0) | –6.6 (4.8–8.3) | –7.8 (6.2–9.4) | –6.8 (5.1–8.5) | –9.0 (7.9–10) | –8.9 (7.0–0.9) | –8.0 (6.2–9.8) | –9.8 (7.7–1.9) |
| Placenta BE* mmol/litre | –3.2 (2.5–3.9) | –3.0 (1.3–4.7) | –3.0 (2.1–3.7) | –3.6 (2.6–4.6) | –6.4 (5.3–7.5) | –6.4 (4.0–8.8) | –6.6 (5.2–8.0) | –6.2 (4.1–8.3) | –9.4 (7.5–11) | –10.2 (6.7–3.7) | –7.8 (4.5–1.1) | –9.3 (6.3–2.3) |
CI, confidence intervals; NVD, normal vaginal delivery; BE, base excess; *all values in each time period are not statistically different from each other.
When histological chorioamnionitis was detected the base excess was significantly lower than in those placentas without chorioamnionitis but the pH and CO2 were unaffected. The cord base excess was –8.4 mmol/l and the placenta base excess was –7.4 mmol/l when chorioamnionitis was present compared with –6.0 mmol/l (p = 0.01) and –5.6 mmol/l (p = 0.02) for the cord and placenta without chorioamnionitis. The base excess results fell at a similar rate over time regardless of the presence of chorioamnionitis.
Discussion
This study is the largest to date comparing serial cord and placenta arterial gas results from all types of deliveries. Firstly, in regard to the values obtained from the umbilical cord artery, our major finding is that both the pH and base excess dropped significantly by 30 min, and continued to drop over the 90 minute period of measurement. We conclude therefore that the raw delayed values cannot be used to represent the baby's condition at birth, as they would suggest the baby was born in poorer condition than was actually the case. However, the delayed values may still be useful, as the results presented in table 2 allow one to estimate, with reasonably tight confidence intervals, what the time 0 value would have been. For example, a cord arterial pH of 7.050 taken at 30 min would have been 7.100 with 95% CI of 7.086 to 7.113, and a cord base excess of –12 mmol/l at 30 min would have been –7.9 mmol/l with 95% CI of –8.6 to –7.3. One can also conclude that if a delayed pH is within the normal range, then one can be 95% confident that the time 0, pH was also normal.
Secondly, regarding the placental surface arteries, pH and base excess at time 0 were significantly higher than the corresponding cord values, and the manner in which they changed with time was less predictable. We therefore conclude that caution should be exercised in using these values, even with adjustment using data from table 2.
Evaluation of the pH and base excess values for the three delivery groups showed that delivery by elective caesarean section resulted in a higher arterial cord pH and base excess at birth which was significantly better than the results after a normal vaginal delivery. Surprisingly it was the NVD group that had the lowest values at birth and not the high risk group. Despite the differing birth values for pH and base excess the changes over time were remarkably similar irrespective of the type of delivery.
A number of large studies have reported normal values for umbilical cord arterial blood gases. Sykes et al (n = 899), Victory et al (n = 17 668) and Helwig at al (n = 16 060) studied consecutive term deliveries and found a mean pH of 7.20±0.08, 7.24±0.07 and 7.26±0.07 respectively.1,7,8 Other studies that sampled normal vaginal deliveries only, report cord pH values from 7.24 to 7.28.9,10,11 The baseline pH for the total study group and specifically the NVD group are lower than is stated is most of the literature. It is unclear why this has occurred, but, the fact that the samples were sent to a central laboratory for analysis has introduced a time delay to the study. However, after reviewing the work by Strickland et al where it was shown that blood drawn for acid base status into a plastic syringe remained stable for 30 min prior to analysis it was felt that the delay in sending samples elsewhere for analysis would not affect the results.12
The current literature on the stability of arterial cord gases from a clamped section of cord presents some differences from our findings. Three small studies have shown that the umbilical arterial pH from a clamped cord was stable for 60 min at room temperature.13,14,15 Paerregaard et al, and Pel and Treffers, however, demonstrated an unstable cord arterial pH by 15 and 30 min respectively.16,17 The cord arterial base excess has been shown in two studies to be unstable over time.15,18 The findings of our study were that by 30 min the arterial cord pH and base excess were unstable. More sampling points between birth and 30 min would have helped to elucidate this further. In retrospect, analysis of lactate changes over time would also have been valuable as another marker of acid‐base status.
There has been less research on the comparison of the arterial acid‐base status from the placental surface arteries with the umbilical cord artery. Recently Nodwell et al took paired samples from the umbilical artery and placental surface artery at birth.19 The findings were similar to our study, in that the pH was higher and CO2 was lower in the placental samples compared with the umbilical samples at birth. Hilger et al was the first study that compared paired samples from the cord and placenta longitudinally, however, the analysis was not limited to arterial samples.20 They found that the gas parameters from the placental surface vessels were more unstable than from the cord with a rising CO2 and falling pH by 30 min. Armstrong and Stenson found no difference at birth between the arterial pH, base excess or CO2 from a clamped section of cord or the unclamped placenta.15 However, their longitudinal results agreed that the placenta pH and base excess were unstable.
When attempting to explain the cord and placenta gas findings of this study it is important to understand that when there is a delay in blood sampling the acid‐base status can be affected by two processes – glycolysis and diffusion.16,21,22 During glycolysis there is ongoing cell metabolism with consumption of oxygen, a rise in CO2 and subsequently a fall in pH and base excess. Conversely, during the slower process of diffusion the pH rises due to diffusion of CO2 out of the vessel. The better pH, CO2 and base excess findings from the placental surface compared with the umbilical cord at time 0 could be because the blood in the clamped cord has ongoing cell metabolism for a period but the blood is trapped and therefore the products of metabolism cannot be removed. The placenta, however, continues to be perfused until it separates and is delivered, and so gas exchange still occurs. The placenta pH results were more unstable over time and this may be because the placenta continues to be more metabolically active after delivery than the umbilical cord.
The effect of chorioamnionitis on delayed blood gas results was not known prior to the study. Potentially, with the presence of infection there may be increased glycolysis and cell metabolism after delivery and subsequently more unstable gas findings over time. The base excess was significantly lower from the cord and placenta when chorioamnionitis was present. This difference, however, was not due to an accumulation of metabolic by‐products over time but because the base excess was lower to begin with from the cord or placental surface of a placenta with chorioamnionitis.
What is already known on this topic
The umbilical cord arterial acid‐base status is a measure of the condition of the neonate at birth and abnormal findings may indicate the occurrence of an acute intrapartum hypoxic event.
Blood samples taken for acid‐base status remain stable in a plastic syringe for up to 30 min before analysis.
What this study adds
The arterial pH and base excess from a clamped umbilical cord at room temperature is not stable after birth but falls over time. We have provided data to be able to estimate the values at birth with reasonable confidence to enable delayed samples to still be useful clinically.
The arterial pH and base excess rate of fall over time is similar for all types of deliveries despite differing values at birth.
Conclusion
Delays in sampling blood from the umbilical cord or the placental surface artery can result in abnormal findings due to the deterioration of the gas parameters over time and may not reflect the condition of the baby at birth. It is therefore recommended that blood gases for assessment of acid‐base status should be taken as soon as possible after delivery from the umbilical cord artery. However, when this is not possible, the pH and base excess obtained from a clamped umbilical artery stored at room temperature can be used to estimate the values at birth with reasonable confidence.
Abbreviations
RPAH - The Royal Prince Alfred Hospital
NVD - normal vaginal delivery
Footnotes
Competing interests: None.
References
- 1.Sykes G S, Johnson P, Ashworth F.et al Do apgar scores indicate asphyxia? Lancet 19821494–496. [DOI] [PubMed] [Google Scholar]
- 2.Thorp J A, Dildy G A, Yeomans E R.et al Umbilical cord blood gas analysis at delivery. Am J Obstet Gynecol 1996175517–522. [DOI] [PubMed] [Google Scholar]
- 3.Johnson J W C, Richards D S, Wagaman R A. The case for routine umbilical blood acid‐base studies at delivery. Am J Obstet Gynecol 1990162621–625. [DOI] [PubMed] [Google Scholar]
- 4.ACOG technical bulletin Umbilical artery blood acid‐base analysis. Number 216–November 1995 (replaces no. 127, April 1989). Int J Gynaecol Obstet 199652305–310. [PubMed] [Google Scholar]
- 5.MacLennan A. International Cerebral Palsy Task Force. A template for defining a causal relation between acute intrapartum events and cerebral palsy: international consensus statement, BMJ 19993191054–1059. [DOI] [PMC free article] [PubMed] [Google Scholar]
- 6.Lahra M M, Jeffery H E. A fetal response to chorioamnionitis is associated with early survival after preterm birth. Am J Obstet Gynecol 2004190147–151. [DOI] [PubMed] [Google Scholar]
- 7.Victory R, Penava D, da Silva O.et al Umbilical cord pH and base excess values in relation to adverse outcome events for infants delivering at term. Am J Obstet Gynecol 20041912021–2028. [DOI] [PubMed] [Google Scholar]
- 8.Helwig J T, Parer J T, Kilpatrick S J.et al Umbilical cord acid‐base state: What is normal? Am J Obstet Gynecol 19961741807–1812. [DOI] [PubMed] [Google Scholar]
- 9.Yeomans E R, Hauth J C, Gilstrap L C.et al Umbilical cord pH, PCO2, and bicarbonate following uncomplicated term vaginal deliveries. Am J Obstet Gynecol 1985151798–800. [DOI] [PubMed] [Google Scholar]
- 10.Thorp J A, Sampson J E, Parisi V M.et al Routine umbilical cord blood gas determinations? Am J Obstet Gynecol 1989161600–605. [DOI] [PubMed] [Google Scholar]
- 11.Riley R J, Johnson J W C. Collecting and analyzing cord blood gases. Clin Obstet Gynecol 19933613–23. [DOI] [PubMed] [Google Scholar]
- 12.Strickland D M, Gilstrap L C, Hauth J C.et al Umbilical cord pH and PCO2: Effect of interval from delivery to determination. Am J Obstet Gynecol 1984148191–194. [DOI] [PubMed] [Google Scholar]
- 13.Duerbeck N B, Chaffin D G, Seeds J W. A practical approach to umbilical artery pH and blood gas determinations. Obstet Gynecol 199279959–962. [PubMed] [Google Scholar]
- 14.Sykes G S, Molloy P M. Effect of delays in collection or analysis on the results of umbilical cord blood measurements. Br J Obstet Gynaecol 198491989–992. [DOI] [PubMed] [Google Scholar]
- 15.Armstrong L, Stenson B. The effect of delayed sampling on umbilical cord arterial and venous lactate, and blood gases in clamped and unclamped vessels. Arch Dis Child Fetal Neonatal Ed [serial online] April 2006. Available from http://fn.bmjjournals.com/cgi/content/abstract/adc.2005.086744v1 [DOI] [PMC free article] [PubMed]
- 16.Paerregaard A, Nickelsen C N, Brandi L.et al The influence of sampling site and time upon umbilical cord blood acid‐base status and P02 in the newborn infant. J Perinat Med 198715559–563. [DOI] [PubMed] [Google Scholar]
- 17.Pel M, Treffers P E. The reliability of the results of the umbilical cord pH. J Perinat Med 198311169–174. [DOI] [PubMed] [Google Scholar]
- 18.Owen P, Farrell T A, Steyn W. Umbilical cord blood gas analysis: a comparison of two simple methods of sample storage. Early Hum Dev 19954267–71. [DOI] [PubMed] [Google Scholar]
- 19.Nodwell A, Carmichael L, Ross M.et al Placental compared with umbilical cord blood to assess fetal blood gas and acid‐base status. Obstet Gynecol 2005105129–138. [DOI] [PubMed] [Google Scholar]
- 20.Hilger J S, Holzman I R, Brown D R. Sequential changes in placental blood gases and pH during the hour following delivery. J Reprod Med 198126305–307. [PubMed] [Google Scholar]
- 21.Siggaard Andersen O. Sampling and storing of blood for determination of acid‐base status. Scandinav J Clin and Lab Investigation 196113196–204. [PubMed] [Google Scholar]
- 22.Nhan V Q, de Bruyn H W A, Huisjes H J. Umbilical blood gas analysis: I. Effect of storage of samples on outcome. Int J Gynaecol Obstet 198017479–481. [DOI] [PubMed] [Google Scholar]


