

Abstract
Background
Epidemiological studies show inverse relationship between intake of wholegrain cereals and several chronic diseases. Components and mechanisms behind possible protective effects of wholegrain cereals are poorly understood.
Objective
To characterise commercial rye bran preparations, compared to wheat bran, regarding structure and content of nutrients as well as a number of presumably bioactive compounds.
Design
Six different rye brans from Sweden, Denmark and Finland were analysed and compared with two wheat brans regarding colour, particle size distribution, microscopic structures and chemical composition including proximal components, vitamins, minerals and bioactive compounds.
Results
Rye brans were generally greener in colour and smaller in particle size than wheat brans. The rye brans varied considerably in their starch content (13.2–;28.3%), which reflected variable inclusion of the starchy endosperm. Although rye and wheat brans contained comparable levels of total dietary fibre, they differed in the relative proportions of fibre components (i.e. arabinoxylan, β-glucan, cellulose, fructan and Klason lignin). Generally, rye brans contained less cellulose and more β-glucan and fructan than wheat brans. Within small variations, the rye and wheat brans were comparable regarding the contents of tocopherols/tocotrienols, total folate, sterols/stanols, phenolic acids and lignans. Rye bran had less glycine betaine and more alkylresorcinols than wheat brans.
Conclusions
The observed variation in the chemical composition of industrially produced rye brans calls for the need of standardisation of this commodity, especially when used as a functional ingredient in foods.
Keywords: rye bran, microscopy, physical properties, proximate composition, vitamins, bioactive components
The effect of whole grain cereals on health is becoming apparent since a number of epidemiological studies suggested protection against obesity, diabetes, inflammation, cardiovascular diseases and some types of cancer (1–6). The anticipated beneficial health effects of whole grain cereals have been attributed to components of the fractions hitherto eliminated during milling and discarded into animal feed, i.e. the bran and the germ of the kernels. The bran represents the outer parts of the grains (Fig. 1) including the pericarp (or fruit coat) and surrounding cuticle, the testa (or the seed coat) and the aleurone layer (7). Depending on the milling process, commercial bran preparations also contain variable amounts of the starchy endosperm and germ.
Figure 1.
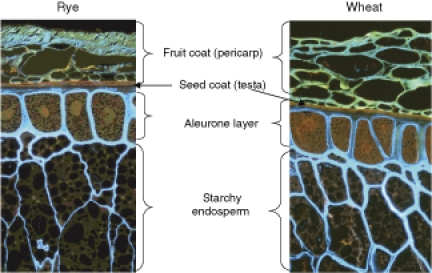
Microstructure of parts of intact grains of (a) rye and (b) wheat. The sections have been stained with Acid Fuchsin and Calcofluor: protein appears red, cell walls rich in β-glucan appear light blue and lignified cell walls of the fruit coat appear yellowish-brown.
Mechanisms involved in disease protective effects of whole grain cereal components are not yet understood (3). Different types of dietary fibre and a wide range of minerals and bioactive phytochemicals, inter alia vitamins, sterols, phenolic and non-phenolic antioxidants, may be involved (1, 3). Regarding the bran fractions, there are considerable qualitative and quantitative differences among the different cereal grains and within each grain (7). Since the milling process highly influences the proportions of the different cell types in the ‘bran’, it is expected that brans originating from different genetic/agricultural backgrounds and produced by different processes have different chemical composition.
The brans of different grains vary considerably in their chemical components including cell wall polysaccharides and bioactive compounds (7–9). The brans of wheat, oat and rice, which are widely commercially available, are well characterised with respect to their composition and properties especially with regard to their fibre components (10, 11). The rye grain (Secale cereale L.), traditionally consumed as whole grain products in northern Europe, is quite similar to wheat despite important differences in the chemical composition and, consequently, technological properties (12). Currently, there is an interest in the production and increased use of rye bran in the Nordic countries. Despite a number of publications describing health-promoting effects of rye bran (13), studies pertinent to chemical composition of rye brans are lacking. Within a project ‘Rye Bran for Health’, we undertook the task to perform chemical characterisation of six commercial rye brans collected from Sweden, Denmark and Finland and to compare them with two wheat brans.
Materials and methods
Bran samples
Rye bran samples (Rye 1–;6) were collected from industrial roller mills in Sweden (two samples), Denmark (two samples) and Finland (two samples) and were studied in comparison with two Swedish wheat bran samples; a common wheat from an industrial roller mill (Wheat 1) and a wheat bran from a white wheat variety obtained in a laboratory mill (Wheat 2). Characteristics of the milling parameters and extraction rate are unavailable for industrial innovatory reasons. For the chemical analyses, all bran samples were milled to a fine powder using an ultracentrifuge mill type ZM1 with a 0.5 mm ring sieve (Retsch, Hann, Germany).
Bran colour, particle size and microstructure
The colour of the brans was measured using a Chroma Meter (Minolta, Milton Keynes, UK) in the L*, a* and b* chromaticity coordinates. A positive L*-value represents the lightness of colour, a positive a*-value designates redness, a negative a*-value represents greenness, a positive b*-value means yellowness and a negative b*-value stands for blueness. The measurements were performed in triplicate and mean values were calculated. The particle size distribution of the bran samples was determined by sieving (sieve size ranging from 75 to 1,000 μm).
For microscopy, the bran samples were first embedded in 2% agar and then fixed in 1% glutaraldehyde in 0.1 M phosphate buffer (pH 7.0), dehydrated in a graded ethanol series (50–70–94%), embedded using the Leica Historesin Embedding Kit (Heidelberg, Germany) and sectioned (thickness 2 μm) on a rotary microtome. The sections were stained with 0.1% Acid Fuchsin (Gurr BDH Chemicals Ltd, Poole, UK) and 0.01% Calcofluor stain Fluorescent Brightener 28 (Sigma-Aldrich, St Louis, MO, USA) to visualise proteins and cell walls, respectively. Sections were examined using a Olympus BX-50 microscope (epifluorescence, excitation 400–410 nm, emission > 500 nm) and photographed with Sensi Cam PCO CCD camera (Hamamatsu Photonics K.K., Hamamatsu, Japan) using Analysis 3.0 software (Soft Imaging System GmbH, Münster, Germany). Acid Fuchsin stains protein red and β-glucan containing cell walls stained with Calcofluor show blue fluorescence, while unstained starch appears black.
Proximate composition and major nutrients
The dry matter content was determined by drying to constant weight at 103°C. Ash was determined using the Association of Official Chemists (AOAC) method 930.05 (14). Nitrogen (N) was analysed as elementary N using the Dumas procedure (LECO CNS-2000, LECO Corporation, St. Joseph, MI) as described by Hansen (15) and calculated as protein using the conversion factor 6.25. Fat (HCl-fat) was determined by extraction with diethyl ether after acid hydrolysis with 3 M HCl (16). Starch was determined spectrophotometrically essentially as described by Bach Knudsen (17) with modifications in source of enzymes; samples (150 mg) were incubated with thermostable alpha-amylase from Bacillus licheniformis (EC 3.2.1.1, E-BLAAM, 53.7 U/mg, 100 μl, Megazyme International Ireland Ltd., Wichlow, Ireland) for 1 h at 100°C in acetate-buffer (0.1 M, pH 5.0, 30 ml). Further degradation of the released oligosaccharides to glucose monomers was achieved by incubation with amyloglucosidase from Aspergillus niger (EC 3.2.1.3, E-AMGDF, 3,260 U/ml, 200 μl, Megazyme International Ireland Ltd, Wicklow, Ireland) for 2 h at 60°C, and the glucose monomers released in the supernatant after dilution quantified with a glucose oxidase/peroxidase kit (K-GLU, Megazyme International Ireland Ltd.).
Dietary fibre, including non-starch polysaccharide residues, enzyme resistant starch and Klason lignin, was analysed by the Uppsala AOAC procedure (18). Mixed linkage β-glucan, hereafter referred to as β-glucan, was determined by the American Association of Cereal Chemists (AACC) method using the Megazyme kit (kit K-BGLU; Megazyme, Bray, Ireland). Total fructan content was determined by the specific Megazyme enzymatic kit K-FRUC. Arabinoxylan was calculated as the sum of arabinose and xylose residues in the dietary fibre analysis. Cellulose, including resistant starch, was calculated as the glucose residues in the dietary fibre analysis subtracted with the content of β-glucan. Total dietary fibre was calculated as the sum of dietary fibre and fructan. All analyses were performed at least in duplicates.
Minerals
To determine mineral concentrations, the brans were ashed at 450°C and the ash was digested in a 21.7% nitric acid solution. The concentrations of calcium (Ca), magnesium (Mg), manganese (Mn), zinc (Zn), copper (Cu) and iron (Fe) were determined by atomic absorption spectrophotometry (Unicam SP9, Phillips, Cambridge, UK), sodium (Na) and potassium (K) were determined by flame photometry (Radiometer FLM3, Copenhagen, Denmark) and phosphorus (P) was analysed by the colorimetric vanadomolybdate procedure (19). Phytate-phosphorus in the brans was measured according to Haug and Lantzsch (20). The phytate content of the brans was calculated as myo-inositol-1,2,3,4,5,6-hexakisphosphate by multiplying phytate-phosphorus by a factor of 3.55.
Tocols, total folate and betaines
Tocols, tocopherols and tocotrienols, were extracted using alkaline potassium hydroxide according to Ryynänen et al. (21) and analysed by high performance liquid chromatography (HPLC) according to Kamal-Eldin et al. (22). Total folate content of the brans was determined microbiologically on microtiter plates using Lactobacillus rhamnosus ATCC 7469 as the growth indicator organism. The sample preparation procedure included heat extraction followed by trienzyme treatment (23). Betaines were extracted from the brans with water. Two compounds, namely glycine betaine and trigonelline, were analysed after purification of the extract with dichloromethane and derivatisation with 2-naphtacyl trifluoromethanesulphonate by RP-HPLC with UV detection as described by Slow et al. (24). Each bran sample was analysed in duplicate for both total folate and betaines, and the difference between the contents in the duplicate samples was <10%.
Other wholegrain markers and bioactive phytochemicals
Alkylresorcinols were extracted with ethyl acetate and analysed by Gas Chromatography-Flame lonization Detector (GC-FID) according to Ross et al. (25). Phytosterols, including saturated phytostanols, were extracted from the brans after acid and alkaline hydrolyses. The extracts were purified by silica solid phase extraction (silica-SPE) and the sterols were converted to their trimethylsilyl ethers prior to being analysed by gas chromatography (26). Ferulic and p-coumaric acids were analysed by hydrolysing samples (0.25 g) that are mixed with o-coumaric acid (250 μg/ml, 1 ml) as internal standard, with 2 M sodium hydroxide (15 ml) at room temperature for 90 min. The phenolic acids were extracted three times with ethyl acetate (10 ml), reconstituted in 1 ml of methanol and analysed on an Econosil C18 5U column (250 mm×4.6 mm, Alltec, Deerfield, IL, USA) and a photodiode array detector set to wavelength of 320 nm. The mobile phase consisted of (A) phosphate buffer pH 2.8 and (B) acetonitrile and the separation was performed at room temperature using the following gradient: 0 min (10% B); 20 min (20% B); 40 min (60% B); 45 min (10% B); 55 min (10% B) and was used at a flow rate of 1 ml/min. Lignans were analysed by the isotope dilution gas chromatography/mass spectrometry method after pretreatment with potassium hydroxide, hydrolysis with β-glucuronidase from purified Helix pomatia and solid-phase extraction as described by Peñalvo et al. (27). All samples were analysed in duplicate and the difference between the duplicates was <5%.
Statistics
Pearson correlation coefficients including only rye bran samples (n=6) were calculated using the PROC CORR procedure in SAS for Windows version 8.02.
Results and discussion
Bran colour, particle size and microstructure
There was considerable variation between the bran samples regarding particle size and colour (Table 1). The rye bran particles were generally smaller in size and greener in colour as compared to the wheat brans, which had larger particles and more yellow colour. The rye 1 sample had a significantly smaller particle size and were lighter and more yellow colour compared to the other rye samples. The lightness of its colour was comparable to that of the white wheat sample (Wheat 2). It is known that the separation of the peripheral tissues from the endosperm during milling depends on the elasticity of these different tissues and their adherence to each other (28). The smaller particle size of rye bran probably depends on the friability of the peripheral tissues and stronger adherence to the endosperm. The adherence of bran to the endosperm has been shown to affect the milling properties of wheat (9).
Table 1.
Relative particle size distribution and colour of different bran samples
| Bran | Rye 1 | Rye 2 | Rye 3 | Rye 4 | Rye 5 | Rye 6 | Wheat 1 | Wheat 2 |
|---|---|---|---|---|---|---|---|---|
| Realtive particle size distribution (%) | ||||||||
| 1,000 μm | 0.05 | 2.3 | 0.8 | 10.4 | 4.7 | 3.4 | 69.0 | 52.8 |
| 750 μm | 0.06 | 3.7 | 5.4 | 6.3 | 13.2 | 9.2 | 14.1 | 17.6 |
| 475 μm | 1.8 | 19.8 | 29.6 | 14.8 | 32.4 | 41.1 | 9.0 | 14.2 |
| 355 μm | 6.2 | 22.8 | 31.7 | 16.0 | 14.5 | 23.2 | 2.7 | 2.2 |
| 180 μm | 31.4 | 39.3 | 29.7 | 34.2 | 12.4 | 13.3 | 2.0 | 1.5 |
| 95 μm | 56.7 | 8.3 | 1.1 | 13.8 | 5.5 | 3.1 | 0.8 | 1.1 |
| 75 μm | 12.8 | 0.6 | 1.0 | 1.0 | 2.7 | 1.6 | 1.0 | 0.8 |
| < 75 μm | 2.1 | 2.2 | 1.6 | 2.6 | 13.8 | 5.2 | 1.4 | 3.9 |
| Colour (L*, a*, b* chromaticity measurements) | ||||||||
| L*(lightness) | 74.8 | 67.1 | 71.2 | 70.3 | 70.6 | 65.9 | 68.7 | 74.8 |
| a*(negative = green, positive = red) | −6.6 | −6.5 | −7.3 | −6.5 | −7.6 | −6.2 | +0.1 | −2.8 |
| b*(positive = yellow) | 38.1 | 34.8 | 35.5 | 36.6 | 34.2 | 33.9 | 42.0 | 44.2 |
The general appearance of the bran materials was further described using stereomicroscopy and microstructure of the bran particles was analysed using epifluorescence microscopy (Figs. 2 and 3). The bran samples differed considerably in both size and composition of their particles. The amount and size of pericarp, aleurone, starchy endosperm and embryo particles as well as the thickness of cell walls and the amount of their blue fluorescence indicating β-glucan varied greatly (Table 2). A clear difference in the separation of bran from the endosperm was observed between the rye and wheat bran samples with less starchy endosperm tissue attached to the wheat bran particles. As the endosperm is rich in starch, its relative amount affects the starch, fibre and fibre-associated phytochemical content in the bran.
Figure 2.
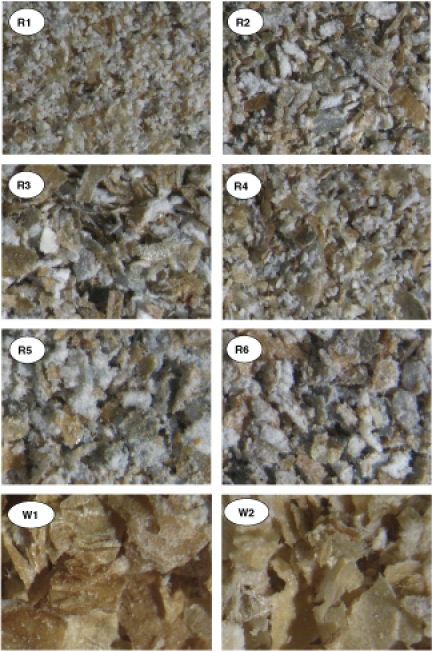
Microstructure of unstained rye brans (R1–R6) and wheat brans (W1 and W2).
Figure 3. .
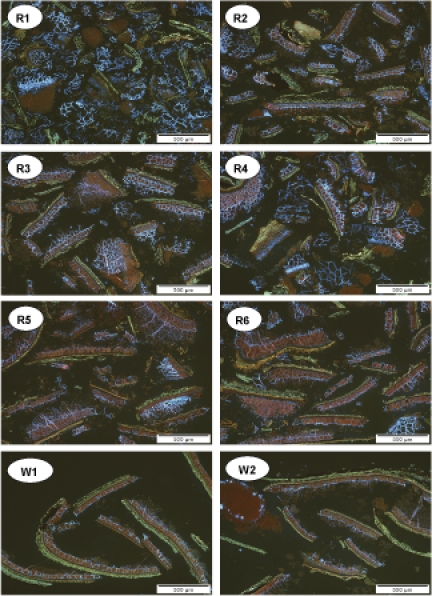
Microstructure of stained rye brans (R1–R6) and wheat brans (W1 and W2). The sections have been stained with Acid Fuchsin and Calcofluor: protein appears red, cell walls rich in β-glucan appear light blue and lignified cell walls of the fruit coat appear yellowish.
Table 2.
Summary of microscopy and particle size distribution in the different rye and wheat bran samples
| Bran | Rye 1 | Rye 2 | Rye 3 | Rye 4 | Rye 5 | Rye 6 | Wheat 1 | Wheat 2 |
|---|---|---|---|---|---|---|---|---|
| Particle size/evenness | 200–500 μm, even in size | 200–1,000 μm, some variation in size | 500–1,000 μm, relatively even in size | 500–1,000 μm, some variation in size | 500–1,000 μm, large variation in size | 500–1,000 μm, some variation in size | ≈70% of particles ≥ 1,000 μm | 500 μm–3 mm, large variation in size |
| Pericarp particles | Many | Some | Some | Many | Few | Few | Many | Some |
| Bran/aleurone particles | Much endosperm attached | Main component, much endosperm attached | Main component, much endosperm attached | Main component, much endosperm attached | Main component, some endosperm attached | Main component, some endosperm attached | Main component, some endosperm attached | Main component, some endosperm attached |
| Starchy endosperm | Many separate particles | Few separate particles | Some separate particles | Many separate particles | Many very small separate particles | Many small separate particles | Few separate particles | Some separate particles |
| Embryo particles | Many | Some | Some | Some | Few | Few | Few | Some |
Proximate composition and major nutrients
There was a large variation in starch content in both the rye and wheat brans, indicating differences both in grain type, varietal heterogeneity and differences in processing (Table 3). Among the rye brans there was negative Pearson correlation coefficient between the starch and ash content (r= − 0.88, P=0.022), whereas the correlation of protein versus ash was positive (r=0.898, P=0.015). On the other hand, there was no significant correlation between ash and HCl fat (r=0.61, P=0.20), or dietary fibre (r=0.50, P=0.32). The poor correlation between ash and HCl fat may be explained by the inclusion of different proportions of germ in the brans (29). The lack of relation between ash and dietary fibre in this limited set of samples is in contrast to recent results on wheat, where a strong correlation (r=0.94) was observed between total pentosan content and ash in shorts and bran fractions, although this correlation was strongly affected by grouping of values between shorts, fine bran and coarse bran (30). Even though there was no significant correlation between dietary fibre and ash, we found a negative association between starch and dietary fibre (r= − 0.82, P=0.047) along with the negative relation between starch and ash. As expected, the levels of ash and fibre are similarly affected by the proportion of the starchy endosperm. In the two wheat samples, lower starch content corresponded to a higher ash and DF content (Wheat 2 versus Wheat 1).
Table 3.
Content of proximate components, phytic acid and minerals of the different rye and wheat bran samples
| Brana | Rye 1 | Rye 2 | Rye 3 | Rye 4 | Rye 5 | Rye 6 | Wheat 1 | Wheat 2 |
|---|---|---|---|---|---|---|---|---|
| Protein (g/100 g DM) | 14.4 | 16.2 | 16.5 | 15.2 | 18.0 | 17.7 | 15.2 | 16.9 |
| Fat (g/100 g DM) | 3.9 | 4.6 | 4.3 | 4.6 | 4.1 | 4.6 | 5.6 | 5.6 |
| Starch (g/100 g DM) | 28.3 | 17.1 | 24.5 | 17.6 | 19.0 | 13.2 | 8.8 | 24.8 |
| Total dietary fibre (g/100 g DM) | 41.1 | 46.6 | 42.1 | 46.8 | 42.3 | 47.5 | 53.1 | 39.9 |
| Arabinoxylan (g/100 g DM) (Ara/Xyl) | 20.6 (0.59) | 25.1 (0.42) | 21.5 (0.45) | 24.3 (0.50) | 22.2 (0.36) | 24.9 (0.36) | 29.8 (0.50) | 22.4 (0.53) |
| β-Glucan (g/100 g DM) | 4.2 | 4.5 | 4.3 | 4.9 | 4.8 | 5.3 | 2.6 | 2.2 |
| Cellulose (g/100 g DM) | 5.5 | 6.0 | 5.6 | 6.5 | 5.0 | 5.9 | 12.1 | 9.3 |
| Klason lignin (g/100 g DM) | 3.5 | 4.4 | 4.1 | 4.4 | 3.7 | 4.5 | 4.9 | 3.3 |
| Fructan (g/100 g DM) | 7.2 | 6.6 | 6.6 | 6.7 | 6.6 | 6.9 | 3.7 | 2.8 |
| Phytic acid (g/100 g DM) | 1.38 | 3.02 | 2.70 | 2.48 | 3.34 | 3.76 | 4.19 | 3.48 |
| Ash (g/100 g DM) | 2.8 | 5.2 | 4.6 | 4.5 | 5.6 | 6.2 | 6.5 | 5.5 |
| Phosphorus (mg/100 g DM) | 560 | 1,090 | 980 | 970 | 1,200 | 1,350 | 1,390 | 1,240 |
| Phytic acid phosphorus (mg/100 g DM) | 390 | 850 | 760 | 700 | 940 | 1,060 | 1,180 | 980 |
| Potassium (mg/100 g DM) | 860 | 1,480 | 1,370 | 1,330 | 1,540 | 1,790 | 1,760 | 1,530 |
| Magnesium (mg/100 g DM) | 140 | 330 | 260 | 260 | 360 | 380 | 430 | 360 |
| Calcium (mg/100 g DM) | 80 | 100 | 100 | 110 | 90 | 100 | 100 | 100 |
| Sodium (mg/100 g DM) | 4 | 3 | 9 | 7 | 4 | 12 | 15 | 8 |
| Manganese (mg/100 g DM) | 7 | 7 | 7 | 7 | 8 | 7 | 7 | 7 |
| Zinc (mg/100g DM) | 5 | 7 | 7 | 6 | 7 | 7 | 6 | 7 |
| Iron (mg/100g DM) | 5 | 9 | 7 | 8 | 9 | 9 | 9 | 11 |
| Copper (mg/100g DM) | 0.6 | 1.3 | 0.9 | 0.9 | 1 | 1.1 | 1.5 | 1.4 |
aThe moisture contents of the brans ranged 7.3–9.4%.
Overall, the protein content in the rye bran samples was similar to that of the wheats. The fat, protein and ash content of the rye bran samples were generally higher than the values for the bran fraction obtained by roller milling of rye (protein 12.8, crude fat 3.0, ash 4.1 g/100 g) in the study of Nilsson et al. (31). In concert with this, the starch content was generally also lower (except for Rye 1 and 3) in the current study as compared to the previous results (24.9 g/100 g).
There was a large variation in ash content of rye brans (Table 3), which can reflect both differences in rye sources and milling techniques used. In the milling industry, ash is used as an indicator of bran content, as the minerals are concentrated in the bran fraction and primarily in the aleurone layer (32, 33).
The rye brans contained 41–48 g/100 g dietary fibre. Low dietary fibre content was related to high starch content in Rye 1 and 3 indicating the high content of starchy endosperm in these brans (Tables 1 and 2, Fig. 2). Three rye brans (Rye 2, 4 and 6) had relatively high dietary fibre content and low starch content compared to the other three rye brans. Compared to the rye bran samples, Wheat 1 contained more dietary fibre and less starch, as expected. On the other hand, the white wheat sample (Wheat 2), produced in a less efficient laboratory mill, had a lower content of dietary fibre and high starch content.
Arabinoxylan was the dominating dietary fibre component in rye bran (21–25 g/100 g) and also in the wheat bran samples (22–30%). It consists of a xylose backbone with extensive variation in arabinose substitution pattern (34). The ratio Ara/Xyl ratio was about 0.5, confirming the earlier findings that arabinoxylan is less branched in the bran (Ara:Xyl about 0.6–0.7) compared to the endosperm (Ara:Xyl about 1–1.2) (31, 35, 36). Fructan (6.6–7.2 g/100 g) was the second most important dietary fibre component in rye bran and its content was about twice that of wheat bran. Also the content of β-glucan (4.3–5.3 g/100 g) was about twice as high as in wheat bran. The content of cellulose (5.0–6.0 g/100 g) and Klason lignin (3.5–4.4 g/100 g), which are known to be mainly present in the bran fraction of cereals, were also relatively high. Interestingly the wheat samples contained about twice as much cellulose compared to the rye samples. Rye bran fibre has previously been shown to range from highly fermentable fructan and β-glucan to partially fermentable arabinoxylan and relatively resistant heteroxylan, cellulose and Klason lignin in the pericarp and testa (37).
Minerals and phytic acid
Reports on mineral content of wheat bran vary considerably (32, 38, 39) presumably reflecting large variations in variety, growing conditions and milling procedures. The mineral composition of the different rye brans was comparable, except for generally low levels in rye 1 due to dilution with starch (Table 3). Generally, the values obtained in the present study were in the same range as previously described. The high mineral content and low starch content of most of the rye bran fractions suggests a high concentration of aleurone-rich material (33).
As indicated by the ash content, the macro mineral content of the rye and wheat samples was in the same range. In the rye brans, where the correlation coefficient between ash and total phosphorus was very high (r=0.999, P<0.0001), there was also a very high correlation between phytic acid-bound phosphorus and total phosphorus (r=0.999, P<0.0001), ranging from 69 to 78%, compared to 79–85% in wheat samples. Among the rye brans, both ash and total phosphorus correlated with the content of iron (r>0.91, P<0.013), zinc (r>0.86, P<0.028) and magnesium (r>0.98, P<0.0004). A similar correlation was previously reported for wheat flours (40). In addition, potassium correlated strongly with ash (r=0.996, P<0.0001), whereas a much weaker correlation coefficient was obtained between ash and copper (r=0.77, P=0.073), and no significant correlation was seen between ash and calcium (r=0.39, P=0.44), manganese (r=0.32, P=0.54) and sodium (r=0.44, P=0.38). Instead, a significant correlation coefficient was seen between iron and copper (r=0.91, P=0.012).
In the rye bran samples, there was a strong positive correlation between protein and total phosphorus (r=0.90, P=0.016), phytic acid-bound phosphorus (r=0.91, P=0.011), zinc (r=0.83, P=0.0429, magnesium (r=0.91, P=0.013) and potassium (r=0.87, P=0.023). Oury et al. (41) found strongly significant correlations between protein, magnesium, zinc and iron in 51 genotypes of wheat (whole grain), but with lower coefficients than found in our rye bran samples.
Tocols, total folate and betaines
Considerable variation was observed with respect to tocol composition (Table 4). The tocotrienols were more predominant in agreement with literature showing tocotrienols to be concentrated in the bran and tocopherols to be concentrated in the germ of other cereal grains (42). An important difference between rye and wheat brans in the current study was that α-tocotrienol level was higher than β-tocotrienol level in rye brans, while the opposite was true for wheat brans. The low tocotrienol levels in the Rye 1 bran are consistent with its high content of starch.
Table 4.
Contents of vitamins and bioactive components of the different rye and wheat bran samples (mg/100 g DM) and relative percentages of individual sterols and alkylresorcinols
| Brana | Rye 1 | Rye 2 | Rye 3 | Rye 4 | Rye 5 | Rye 6 | Wheat 1 | Wheat 2 |
|---|---|---|---|---|---|---|---|---|
| Total tocols | 7.8 | 11.6 | 10.9 | 11.0 | 11.3 | 13.1 | 10.6 | 8.4 |
| α-Tocopherol | 2.1 | 0.6 | 1.0 | 1.6 | 0.1 | 0.3 | 0.3 | 1.5 |
| β-Tocopherol | 0.7 | 0.1 | 0.3 | 0.4 | – | – | 0.1 | 0.9 |
| α-Tocotrienol | 2.7 | 6.4 | 5.7 | 5.1 | 7.0 | 8.0 | 2.2 | 1.1 |
| β-tocotrienol | 2.3 | 4.5 | 3.9 | 3.8 | 4.2 | 4.8 | 8.1 | 4.9 |
| Total folate | 0.1 | 0.09 | 0.04 | 0.09 | 0.08 | 0.06 | 0.08 | 0.08 |
| Glycine betaine | 200 | 230 | 220 | 194 | 278 | 240 | 431 | 441 |
| Trigonelline | 5.3 | 10.6 | 9.0 | 7.0 | 12.4 | 11.4 | 4.9 | 3.7 |
| Total sterols/stanols | 190 | 190 | 190 | 210 | 180 | 190 | 190 | 160 |
| β-Sitosterol | 90.3 | 79.2 | 82.8 | 93.9 | 70.4 | 77.1 | 71.6 | 66.2 |
| Campesterol | 36.1 | 25.8 | 30.8 | 37.0 | 23.2 | 25.5 | 23.2 | 25.8 |
| Stigmasterol | 8.4 | 9.9 | 9.9 | 10.3 | 7.7 | 9.5 | 7.4 | 6.2 |
| Sitostanol | 14.6 | 27.6 | 22.4 | 21.4 | 31.0 | 30.4 | 37.4 | 23.7 |
| Campestanol | 12.7 | 21.9 | 20.5 | 19.5 | 26.3 | 26.4 | 33.3 | 25.9 |
| Other sterols | 27.9 | 25.7 | 23.6 | 27.9 | 21.4 | 21.1 | 17.1 | 12.2 |
| Total alkylresorcinols | 180 | 400 | 370 | 350 | 410 | 480 | 400 | 240 |
| C17:0 | 43.2 | 80.0 | 81.4 | 77.0 | 90.2 | 105.6 | 16.0 | 7.2 |
| C19:0 | 57.6 | 120.0 | 118.4 | 112 | 131.2 | 148.8 | 128.0 | 62.4 |
| C21:0 | 41.4 | 108.0 | 92.5 | 87.5 | 102.5 | 120.0 | 200.0 | 136.8 |
| C23:0 | 19.8 | 48.0 | 40.7 | 38.5 | 43.1 | 52.8 | 44.0 | 26.4 |
| C25:0 | 18.0 | 44.0 | 37.0 | 35.0 | 43.0 | 52.8 | 12.0 | 7.2 |
| Ratio C17:0/C21:0 | 1.02 | 0.74 | 0.86 | 0.90 | 0.88 | 0.85 | 0.07 | 0.05 |
| Ferulic acid | 217 | 319 | 288 | 305 | 305 | 346 | 396 | 280 |
| para-Coumaric acid | 8.0 | 11.9 | 9.9 | 12.7 | 10.7 | 12.5 | 9.2 | 7.2 |
| Total lignans | 5.8 | 7.0 | 6.2 | 6.5 | 5.8 | 7.0 | 3.6 | 2.8 |
| Syringaresinol (SYR) | 3.9 | 5.2 | 4.4 | 4.3 | 4.0 | 4.9 | 2.5 | 1.7 |
| Lariciresinol (LAR) | 0.8 | 0.7 | 0.7 | 0.8 | 0.7 | 0.7 | 0.4 | 0.5 |
| Pinoresinol (PINO) | 0.6 | 0.5 | 0.6 | 0.7 | 0.6 | 0.7 | 0.2 | 0.2 |
| Medioresinol | 0.3 | 0.3 | 0.2 | 0.3 | 0.2 | 0.3 | 0.2 | 0.2 |
| Secoisolariciresinol | 0.1 | 0.1 | 0.2 | 0.2 | 0.4 | 0.2 | 0.3 | 0.2 |
| Matairesinol | 0.1 | 0.2 | 0.1 | 0.2 | 0.1 | 0.2 | – | – |
aThe moisture contents of the brans ranged 7.3–9.4%.
The total folate contents in the rye brans showed considerable variation ranging 0.04–0.1 mg/100 g, which is in agreement with Liukkonen et al. (43). The highest folate content was measured in Rye 1, which also had the highest α-tocopherol content and the lowest alkylresorcinol, ferulic acid and stanol contents suggesting relatively higher incorporation of the germ in this bran. The folate contents of the wheat bran samples were within the range for the rye bran samples. Previously, laboratory scale fractionation of rye by a roller mill produced a bran fraction with a folate content of 0.1 mg/100 g (43). The levels found in this study are considerably lower than those reported for wheat bran, i.e. 0.16–0.42 mg/100 g (44, 45).
Betaine is a methyl donor agent that was shown to lower homocysteine levels in blood (46). Currently, data on betaine contents in foods is scare. Nevertheless, cereal grains and especially the bran and the germ fraction are considered rich sources of betaine compounds (24, 47, 48). In this study, the rye bran samples contained much less betaine compounds, 194–278 mg/100 g than the wheat bran samples, 431–441 mg/100 g. The glycine betaine contents of wheat bran samples was previoulsy reported as 230 and 720 mg/100 g (24) and 1,500 mg/100 g (47) indicating that there might be a large variation between products but there is no data in literature on rye bran.
Other biomarkers and phytochemicals
The brans were analysed also for phytochemicals, including alkylresorcinols, phytosterols/phytostanols, phenolic acids and lignans (Table 4). In addition to ash, alkylresorcinols are specific markers for wheat and rye bran (49). While ash, phytates and ferulic acid are mainly concentrated in the aleurone layer, the alkylresorcinols are localised in the external cuticle of testa/internal cuticle of pericarp (50). In the current study, positive correlations were found between these four markers; i.e. phytic acid and ferulic acid (r=0.94), alkylresorcinols and phytic acid (r=0.98), alkylresorcinols and ferulic acid (r=0.97), ash and phytic acid (r=0.998), ash and ferulic acid (r=0.95), ash and alkylresorcinols (r=0.98). Rye 1 had considerably lower contents of these four markers than the other rye brans, partly due to dilution with starch but other factors, e.g. genetic background and agronomic conditions, should not be excluded since Rye 3 had much higher level of these markers despite comparable starch content. The alkylresorcinol contents are higher in rye than in wheat brans as previously reported (49). The C17:0/C21:0 alkylresorcinol homologue ratio ranged between 0.74 and 1.02 in the six rye brans and was 0.05 and 0.08 in the two wheat brans. This confirms the difference between rye and wheat in this respect, as this ratio was previously reported as 0.1 in wheat and 1.0 in rye (49).
Phytosterols and phytostanols are important cholesterol-lowering components in rye and wheat brans. Fifteen individual sterols, including e.g. six Δ5-unsaturated sterols and two stanols, were found in the brans after acid and alkaline hydrolyses. The total amount of sterols varied from 160 to 210 mg/100 g, which is in line with previous studies (26, 29). Rye brans had generally higher proportion of unsaturated sterols while wheat brans had higher proportions of stanols, which can be explained by the fact that wheat bran does not contain germs and that germs are known to contain only 2% of stanols out of total sterols (29). Thus, rye brans including also germs might be richer is unsaturated sterols and poorer in stanols.
Rye and wheat contain very high levels of ferulic acids, concentrated in the brans, and much smaller amounts of p-coumaric acid. Ferulic acid is mainly attached to arabinoxylan through ester linkages so that its release by alkaline hydrolysis is essential before analysis by HPLC. A number of lignans, mainly syringaresinol but also medioresinol, pinoresinol, secoisolariciresinol, matairesinol and lariciresinol were determined in the bran samples. Generally, the rye brans have much higher levels of lignans compared to wheat brans.
Concluding remarks
In this study, we have performed a detailed analysis of six commercial rye brans from Sweden, Denmark and Finland and compared them to two Swedish wheat brans. Currently, whole grain cereals and bran-enriched cereal products (rich in dietary fibre, minerals, as well as certain vitamins and phytochemicals) are highly appreciated as health-promoting constituents of our daily diet. The bran samples analysed in this study differed considerably regarding their particle size distribution, microstructure and starch content, which reflected differences in milling techniques used in the industrial plant. Consequently, the obtained technical ‘brans’ were markedly different in their chemical composition. The observed variation in the chemical composition of industrially produced rye brans calls for the need of standardisation of this commodity especially if it will be used as a functional ingredient in foods.
Conflict of interest and funding
This work is performed as part of the NKJ-121 project ‘Rye bran for health’ funded by FORMAS, the Swedish Research Council for Environment, Agricultural Sciences and Spatial Planning; the Directorate for Food, Fisheries and Agri Business (Denmark), and the Ministry of Agriculture and Forestry (Finland).
References
- 1.Ferguson LR, Harris PJ. Protection against cancer by wheat bran: role of dietary fiber and phytochemicals. Eur J Cancer Prev. 1999;8:17–27. doi: 10.1097/00008469-199902000-00003. [DOI] [PubMed] [Google Scholar]
- 2.Slavin J. Mechanisms for the impact of whole grain foods on cancer risk. J Am Coll Nutr. 2000;19:300S–7S. doi: 10.1080/07315724.2000.10718964. [DOI] [PubMed] [Google Scholar]
- 3.Slavin J. Why whole grains are protective: biological mechanisms. Proc Nutr Soc. 2003;62:129–34. doi: 10.1079/PNS2002221. [DOI] [PubMed] [Google Scholar]
- 4.McKeown NM. Whole grain intake and insulin sensitivity: evidence from observational studies. Nutr Rev. 2004;62:286–91. doi: 10.1111/j.1753-4887.2004.tb00054.x. [DOI] [PubMed] [Google Scholar]
- 5.Seal CJ. Whole grains and CVD risk. Proc Nutr Soc. 2006;65:24–34. doi: 10.1079/pns2005482. [DOI] [PubMed] [Google Scholar]
- 6.Kelly SA, Summerbell CD, Brynes A, Whittaker V, Frost G. Wholegrain cereals for coronary heart disease. Cochrane Database Syst Rev. 2007;18 doi: 10.1002/14651858.CD005051.pub2. CD005051. [DOI] [PubMed] [Google Scholar]
- 7.Harris PJ, Chavan RR, Ferguson LR. Production and characterisation of two wheat-bran fractions: an aleurone-rich and a pericarp-rich fraction. Mol Nutr Food Res. 2005;49:536–45. doi: 10.1002/mnfr.200500016. [DOI] [PubMed] [Google Scholar]
- 8.Buri RC, von Reding W, Gavin MH. Description and characterization of wheat aleurone. Cereal Foods World. 2004;49:274–82. [Google Scholar]
- 9.Greffeuille V, Abecassis J, Lapierre C, Lullien-Pellerin V. Bran size distribution at milling and mechanical and biochemical characterization of common wheat grain outer layers: a relationship assessment. Cereal Chem. 2006;83:641–6. [Google Scholar]
- 10.Luhaloo M, Mårtensson A-C, Andersson R, Åman P. Compositional analysis and viscosity measurements of commercial oat brans. J Sci Food Agric. 1998;76:142–8. [Google Scholar]
- 11.Abdel-Hamid A, Sulaiman RR, Osman A, Saari N. Preliminary study of the chemical composition of rice milling fractions stabilized by microwave heating. J. Food Comp Anal. 2007;20:627–37. [Google Scholar]
- 12.Kamal-Eldin A, Åman P, Zhang J-X., Bach Knudsen K-E., Poutanen K. Rye bread and other rye products. In: Hamaker B, editor. Technology of functional cereal products. Cambridge, UK: Woodhead Publishing Ltd; 2007. pp. 233–60. [Google Scholar]
- 13.Hallmans G, Zhang J-X, Lundin E, Stattin P, Johansson A, Johansson I, et al. Rye lignans and human health. Proc Nutr Soc. 2003;62:193–9. doi: 10.1079/pns2002229. [DOI] [PubMed] [Google Scholar]
- 14.AOAC . Official methods of analysis of the association of official analytical chemists. Gaithersburg, MD: AOAC International; 2000. [Google Scholar]
- 15.Hansen B. Determination of nitrogen as elementary n, an alternative to Keldahl. Acta Agric Scand. 1989;39:113–8. [Google Scholar]
- 16.Stoldt W. Vorschlag zur Vereinheitlichung der Fettbestimmung in Lebensmitteln [Suggestion for harmonisation of fat determination in food] Fette Seifen Anstrichmittel. 1952;54:206–7. [Google Scholar]
- 17.Bach Knudsen KE. Carbohydrate and lignin contents of plant materials used in animal feeding. Anim Feed Sci Technol. 1997;67:319–38. [Google Scholar]
- 18.Theander O, Åman P, Westerlund E, Andersson R, Petersson D. Total dietary fiber determined as neutral sugar residues, uronic acid residues, and Klason lignin (The Uppsala method): Collaborative study. J AOAC Int. 1995;78:1030–44. [PubMed] [Google Scholar]
- 19.Stuffins CB. The determination of phosphate and calcium in feeding stuffs. Analyst. 1967;92:107–11. doi: 10.1039/an9679200107. [DOI] [PubMed] [Google Scholar]
- 20.Haug W, Lantzsch HJ. Sensitive method for the rapid determination of phytate in cereals and cereal products. J Sci Food Agric. 1983;34:1423–6. [Google Scholar]
- 21.Ryynänen M, Lampi A-M, Salo-Väänänen P, Ollilainen V, Piironen V. A small-scale sample preparation method with HPLC analysis for determination of tocopherols and tocotrienols in cereals. J Food Comp Anal. 2004;17:749–65. [Google Scholar]
- 22.Kamal-Eldin A, Görgen S, Petterson J, Lampi A-M. Normal-phase high performance liquid chromatography of tocopherols and tocotrienols: comparison of different chromatographic columns. J Chromatogr A. 2000;881:217–27. doi: 10.1016/s0021-9673(99)01346-1. [DOI] [PubMed] [Google Scholar]
- 23.Kariluoto S, Vahteriso L, Salovaara H, Katina K, Liukkonen K-H, Piironen V. Effect of baking method and fermentation on foalte content or rye and wheat breads. Cereal Chem. 2004;81:134–9. [Google Scholar]
- 24.Slow S, Donaggio M, Cressey PJ, Lever M, George PM, Chambers T. The betaine content of New Zealand foods and estimated intake in the New Zealand diet. J Food Comp Anal. 2005;18:473–85. [Google Scholar]
- 25.Ross A, Shephered MJ, Schupphaus M, Sinclair V, Alfaro B, Kamal-Eldin A, Åman P. Alkylresorcinols in cereals and cereal products. J Agric Food Chem. 2001;51:4111–8. doi: 10.1021/jf0340456. [DOI] [PubMed] [Google Scholar]
- 26.Piironen V, Toivo J, Lampi A-M. Plant sterols in cereals and cereal products. Cereal Chem. 2002;79:148–54. [Google Scholar]
- 27.Peñalvo JL, Haajanen KM, Botting N, Adlercreutz H. Quantification of lignans in food using isotope dilution gas chromatography/mass spectrometry. J Agric Food Chem. 2005;53:9342–7. doi: 10.1021/jf051488w. [DOI] [PubMed] [Google Scholar]
- 28.Greffeuille V, Abecassis J, Bar L'Helgouac'h C, Lullien-Pellerin V. Differences in the aleurone layer fate between hard and soft common wheats at grain milling. Cereal Chem. 2005;82:138–43. [Google Scholar]
- 29.Nyström L, Paasonen A, Lampi AM, Piironen V. Total plant sterols, steryl ferulates and steryl glycosides in milling fractions of wheat and rye. J Cereal Sci. 2007;45:106–15. [Google Scholar]
- 30.Wang MW, Sapirstein HD, Machet AS, Dexter JE. Composition and distribution of pentosans in millstreams of different hard spring wheats. Cereal Chem. 2006;83:161–8. [Google Scholar]
- 31.Nilsson M, Aman P, Harkonen H, Hallmans G, Bach Knudsen KE, Mazur W, et al. Content of nutrients and lignans in roller milled fractions of rye. J Sci Food Agric. 1997;73:143–8. [Google Scholar]
- 32.Bach Knudsen KE, Steenfeldt S, Børsting CF, Eggum BO. The nutritive value of decorticated mill fractions of wheat. 1. Chemical composition of raw and enzyme treated fractions and balance experiments with rats. Anim Feed Sci Technol. 1995;52:205–25. [Google Scholar]
- 33.Glitsø LV, Bach Knudsen KE. Milling of whole grain rye to obtain fractions with different dietary fibre characteristics. J Cereal Sci. 1999;29:89–97. [Google Scholar]
- 34.Andersson R, Åman P. arabinoxylan: occurence, structure and properties. In: McCleary BV, Prosky L, editors. Advanced dietary fibre technology. Oxford, UK: Blackwell Science Ltd.; 2001. pp. 301–14. [Google Scholar]
- 35.Andersson R, Eliasson C, Selenare M, Kamal-Eldin A, Åman P. Effect of endo-xylanase-containing enzyme preparations and laccase on the solubility of rye bran arabinoxylan. J Sci Food Agric. 2003;83:617–23. [Google Scholar]
- 36.Härkönen H, Pessa E, Suortti T, Poutanen K. Distribution and some properties of cell wall polysaccharides in rye milling fractions. J Cereal Sci. 1997;26:95–104. [Google Scholar]
- 37.Glitsø LV, Jensen BB, Bach Knudsen KE. In vitro fermentation of rye carbohydrates including arabinoxylans of different structure. J Sci Food Agric. 2000;80:1211–8. [Google Scholar]
- 38.Anjum FM, Butt MS, Ahmad N, Ahmad I. Phytate and mineral content in different milling fractions of some Pakistani spring wheats. Int J Food Sci Technol. 2002;37:13–7. [Google Scholar]
- 39.Ruibal-Mendieta NL, Delacroix DL, Mignolet E, Pycke JM, Marques C, Rozenberg R, et al. Spelt (Triticum aestivum ssp spelta) as a source of breadmaking flours and bran naturally enriched in oleic acid and minerals but not phytic acid. J Agric Food Chem. 2005;53:2751–9. doi: 10.1021/jf048506e. [DOI] [PubMed] [Google Scholar]
- 40.Ranum PM, Barrett FF, Loewe RJ, Kulp K. Nutrient levels in internationally milled wheat flours. Cereal Chem. 1980;57:361–6. [Google Scholar]
- 41.Oury FX, Leenhardt F, Remesy C, Chanliaud E, Duperrier B, Balfourier F, et al. Genetic variability and stability of grain magnesium, zinc and iron concentrations in bread wheat. Eur J Agron. 2006;25:177–85. [Google Scholar]
- 42.Ko S-N, Kim C-J, Kim H, Kim C-T, Chung S-H, Tae B-S, et al. Tocol levels in milling fractions of some cereal grains and soybean. J Am Oil Chem Soc. 2003;80:585–9. [Google Scholar]
- 43.Liukkonen K-H, Katina K, Wilhelmsson A, Myllymäki O, Lampi A-M, Kariluoto S, Piironen V, et al. Process-induced changes on bioactive compounds in whole grain rye. Proc Nutr Soc. 2003;62:117–22. doi: 10.1079/PNS2002218. [DOI] [PubMed] [Google Scholar]
- 44.Mullin WJ, Jui PY. Folate content of bran from different wheat classes. Cereal Chem. 1986;63:516–8. [Google Scholar]
- 45.Arcot J, Wootton M, Alury S, Chan HY, Shrestha AK. Folate levels in twelve Australian wheats and changes during processing into bread. Food Aust. 2002;54:18–20. [Google Scholar]
- 46.Lawson-Yuen A, Levy HL. The use of betaine in the treatment of elevated homocysteine. Mol. Genet. Metab. 2006;88:201–7. doi: 10.1016/j.ymgme.2006.02.004. [DOI] [PubMed] [Google Scholar]
- 47.Zeisel SH, Mar M-H, Howe JC, Holden JM. Concentrations of choline-containing compounds and betaine in common foods. J Nutr. 2003;133:1302–7. doi: 10.1093/jn/133.5.1302. [DOI] [PubMed] [Google Scholar]
- 48.De Zwart FJ, Slow S, Payne RJ, Lever M, George PM, Gerrard JA, et al. Glycine betaine and glycine betaine analogues in common foods. Food Chem. 2003;83:197–204. [Google Scholar]
- 49.Chen Y, Ross AB, Åman P, Kamal-Eldin A. Alkylresorcinols as markers of whole grain wheat and rye in cereal products. J Agric Food Chem. 2004;52:8242–6. doi: 10.1021/jf049726v. [DOI] [PubMed] [Google Scholar]
- 50.Landberg R, Kamal-Eldin A, Salmenkallio-Martilla M, Rouau X, Åman P. Localization of alkylresorcinols in wheat, rye and barley kernels. Cereal Chem. 2008;48:401–6. [Google Scholar]