The first crystallographic study of a plant subtilase, SBT3 from S. lycopersicum, is reported.
Keywords: proteases, subtilases, plant subtilase, MIRAS, heavy atoms
Abstract
The subtilase SBT3 from Solanum lycopersicum (tomato) was purified from a tomato cell culture and crystallized using the sitting-drop vapour-diffusion method. A native data set was collected to 2.5 Å resolution at 100 K using synchrotron radiation. For experimental phasing, CsCl-derivative and tetrakis(acetoxymercuri)methane (TAMM) derivative crystals were employed for MIRAS phasing. Three caesium sites and one TAMM site were identified, which allowed solution of the structure.
1. Introduction
Subtilases belong to the S8 family of serine proteases (http://merops.sanger.ac.uk), which are found in archaea, bacteria, fungi and yeasts as well as in lower and higher eukaryotes. Their active sites display a catalytic triad comprised of aspartate, histidine and serine residues. Subtilases have been grouped into six different families: subtilisins, thermitases, proteinases K, lantibiotic peptidases, kexins and pyrolysins (Siezen & Leunissen, 1997 ▶). Only three of them, the kexin, pyrolysin and proteinase K families, are represented in eukaryotes. Kexin, the first eukaryotic subtilase to be identified, processes the precursors of α-mating factor and killer toxin in yeast (Fuller et al., 1989 ▶). Nine subtilases have since been identified in mammals, seven of which are kexin-related and are involved in the highly specific processing of precursor proteins. The two remaining subtilases, S1P and PCSK9, belong to the pyrolysin and proteinase K subfamilies, respectively. Many more subtilases can be found in plants compared with animals and most of them have been assigned to the pyrolysin family (Siezen & Leunissen, 1997 ▶). The 56 subtilase genes of the model plant Arabidopsis thaliana, for example, are divided into six subfamilies, with five being similar to the pyrolysins and one more closely resembling animal kexins (Rautengarten et al., 2005 ▶). 63 subtilase genes have been identified in rice (Tripathi & Sowdhamini, 2006 ▶) and 15 subtilases have been cloned from tomato (Meichtry et al., 1999 ▶). Plant subtilases have been implicated in general protein turnover (Yamagata et al., 1994 ▶), in the regulation of plant development (Berger & Altmann, 2000 ▶), in biotic and abiotic stress responses (Vera & Conejero, 1988 ▶; Liu et al., 2007 ▶) and in the processing of mitogenic peptide growth factors (Srivastava et al., 2008 ▶).
Despite the prevalence and importance of these proteases in plants, no structural data are available for plant subtilases. We therefore purified and crystallized the tomato subtilase SBT3 (GenBank accession No. AJ006380.1; amino acids 113–761, 69.47 kDa) from a tomato cell culture and solved the structure via MIRAS phasing.
2. Methods and results
2.1. Generation of a cell line overexpressing SBT3
A tomato cell-suspension culture was maintained in a Murashige–Skoog-type medium containing 5.0 mg l−1 1-naphthylacetic acid as described in Felix & Boller (1995 ▶). 6 d after subculture, cells were transformed by particle bombardment. Briefly, a 50 ml culture was allowed to sediment and the culture supernatant was replaced with the same volume of fresh medium supplemented with 10% sucrose. After 30 min of gentle agitation, the cells were sedimented again and 2 ml of packed cell volume was distributed onto agar (0.6%) plates prepared with the same high osmotic strength medium. The cells were then bombarded with spherical gold particles (10 µg; 1.5–3 µm; Aldrich Chemical Co.) coated with 0.6 µg of the linearized (SacI) SBT3 expression construct (i.e. the SBT3 cDNA under control of the constitutive CaMV 35S promoter) using a particle inflow gun (Bio-Rad, München). The cells were allowed to recover for 1 d and were then washed from the agar plate into a six-well tissue-culture dish using 6 ml culture medium. After one week at 298 K on an orbital shaker (100 rev min−1), transformed clones were selected on culture plates supplemented with 75 µg ml−1 kanamycin. After 2–3 weeks, when initial callus growth was observed, the calluses were transferred individually to new plates and maintained on the same selection medium. Individual clones were analyzed for stable integration of the transgene by Southern blot analysis and lines with high levels of SBT3 expression were selected by Western blot analysis. A cell-suspension culture was established from the line showing the highest level of SBT3 expression and maintained as described for the wild-type culture.
2.2. Purification of recombinant SBT3
200 ml culture medium in 1 l Erlenmeyer flasks was inoculated with a 1/10 volume of the SBT3-expressing cell line on the day of subculture. After 8 d at 298 K and 100 rev min−1, the culture supernatant was harvested by vacuum filtration, chilled to 277 K and subjected to fractionated ammonium sulfate precipitation. The precipitate (60–85% saturation) from 6 l culture supernatant was resuspended in 60 ml buffer A (25 mM Na2HPO4/NaH2PO4 pH 7.0, 5 mM EDTA), centrifuged to remove insoluble polysaccharides and cellular debris (2600g, 15 min) and dialysed against two changes of 4 l each of buffer A at 277 K. Proteins were then absorbed onto a cation-exchange matrix (SP Sepharose FF, GE Healthcare, Freiburg) equilibrated in buffer A using a batch procedure. After washing in buffer A, proteins were eluted from the matrix in two consecutive steps using 1 M NaCl in buffer A. Eluates were combined and dialysed twice against 4 l buffer B (25 mM Tris–HCl pH 9.2, 5 mM EDTA), the dialysate was cleared by filtration (0.45 µm cellulose acetate; Millipore, Schwalbach) and the volume was reduced by ultrafiltration (10 000 molecular-weight cutoff, Vivascience, Hanover). The sample was subjected to anion-exchange chromatography on Resource Q (6 ml column on an ÄKTA purifier chromatography system; GE Healthcare) equilibrated in buffer B. The protein was eluted with a linear gradient of NaCl in buffer B (0–1 M in 120 ml) at a flow rate of 3 ml min−1. Fractions were assayed for SBT3 activity using an internally quenched fluorogenic peptide substrate [10 µM Abz-SKRDPPKMQTD(NO2)Y; JPT Peptide Technologies, Berlin] in an assay volume of 200 µl 50 mM Tris–HCl pH 8.0 and fluorescence was monitored continuously in a Cary Eclipse spectrofluorimeter (Varian, Darmstadt; λex = 320 nm, λem = 420 nm). The fractions displaying the highest activity were combined, the volume of the pooled sample was reduced to result in a protein concentration of 10–12 mg ml−1 and the buffer was exchanged to 25 mM Tris–HCl pH 7.0 by ultrafiltration. From 6 l of cell-culture supernatant, the procedure yielded 1.2 mg pure SBT3 as judged by SDS–PAGE.
2.3. Crystallization
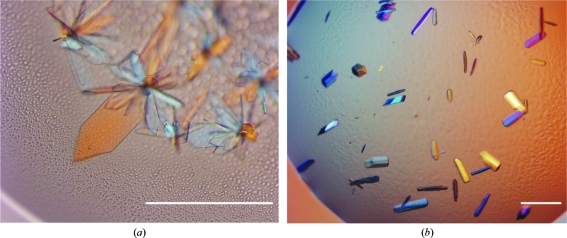
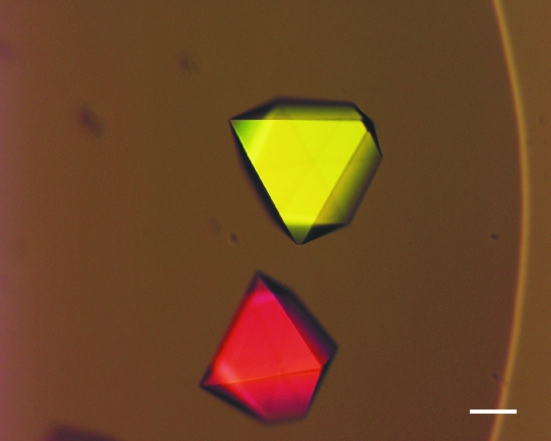
In order to crystallize SBT3, initial screenings employing Crystal Screen, Crystal Screen 2 and several Grid Screens from Hampton Research were performed at 293 K by vapour diffusion. The protein concentration in the setups was 11 mg ml−1; 100 nl protein solution was mixed with 100 nl reservoir solution in sitting drops using a Mosquito pipetting robot (TTP LabTech, Melbourn, UK). The sitting drops were equilibrated against reservoirs with a volume of 70 µl. After 2 d, small rosette-like crystals appeared in several conditions. Even the most promising of these fragile crystals [Fig. 1 ▶ a; grown in Grid Screen PEG 6000 condition B6; 0.1 M Bicine pH 9.0, 10%(w/v) PEG 6000] were very thin in one dimension and did not diffract beyond 6 Å resolution. By lowering the pH to 8.4, adding NaCl to a final concentration of 2.0 M and lowering the temperature to 277 K, the crystal morphology and diffraction behaviour could be enhanced significantly (Fig. 1 ▶ b). However, these crystals still did not diffract beyond 4.0 Å resolution. Finally, the addition of 10 mM hexamminecobalt(III) chloride resulted in suitable crystals (Fig. 2 ▶) that grew to dimensions of up to 400 × 400 × 400 µm and diffracted to 2.5 Å resolution. Accordingly, the final crystallization condition for SBT3 was 0.1 M Bicine pH 8.4, 10%(w/v) PEG 6000, 2.0 M NaCl and 0.01 M hexamminecobalt(III) chloride.
Figure 1.
(a) Crystals of SBT3 grown in 0.1 M Bicine pH 9.0, 10%(w/v) PEG 6000 at 293 K. These crystals did not diffract beyond 6 Å resolution. (b) Crystals of SBT3 grown in 0.1 M Bicine pH 8.4, 10%(w/v) PEG 6000, 2.0 M NaCl at 277 K. These crystals diffracted to 4 Å resolution. The scale bar is 100 µm in length.
Figure 2.
Crystals of SBT3 grown in 0.1 M Bicine pH 8.4, 10%(w/v) PEG 6000, 2.0 M NaCl and 0.01 M hexamminecobalt(III) chloride at 277 K. These crystals diffracted to 2.5 Å resolution and were used for experimental phasing by fast-soaking them with 0.2 M CsCl or 0.01 M TAMM. The scale bar is 100 µm in length.
2.4. Data collection and phasing
Prior to data collection, crystals were cryocooled by direct transfer into liquid nitrogen. For cryoprotection of the native crystals, the NaCl concentration was raised to 3.0 M. In the case of the derivative crystals, a fast-soaking procedure was employed. Native crystals were soaked for 20 min or 24 h in the aforementioned cryoprotective solution supplemented with 0.2 M CsCl or 0.01 M TAMM, respectively, followed by direct transfer into liquid nitrogen.
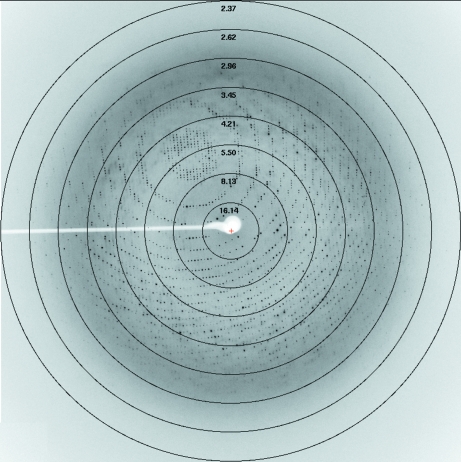
Data sets were collected on Swiss Light Source (SLS) beamline PXII using a MAR225 CCD detector [native: crystal-to-detector distance 230 mm, oscillation range 0.5° in ϕ, 281 images collected; CsCl derivative: crystal-to-detector distance 150 mm, oscillation range 0.5° in ϕ, 360 images collected (Fig. 3 ▶); TAMM derivative: crystal-to-detector distance 270 mm, oscillation range 0.5° in ϕ, 120 images collected]. The data were processed and scaled using XDS (Kabsch, 1993 ▶).
Figure 3.
A typical X-ray diffraction pattern of an SBT3 crystal fast-soaked in 0.2 M CsCl. The diffraction image was collected on a MAR225 CCD detector. The oscillation range was 0.5° and the crystal-to-detector distance was 270 mm.
The data sets were combined and scaled using the CCP4 suite (Collaborative Computational Project, Number, 4, 1994 ▶) for input into SOLVE (Terwilliger & Berendzen, 1999 ▶). Three Cs sites and one TAMM site with an overall Z score of 27.22 and a figure of merit of 0.29 were identified by MIRAS procedures using the INANO and ANOREFINE keywords for the TAMM derivative and INANO and NOANOREFINE for the Cs derivative. RESOLVE (Terwilliger, 2000 ▶) was then used to obtain an initial electron-density map. Improvement of the electron-density maps and tracing of the protein are now in progress.
Table 1. Data-collection statistics.
Values in parentheses are for the outer shell.
| Native | CsCl derivative | TAMM derivative | |
|---|---|---|---|
| Wavelength (Å) | 0.9796 | 1.5 | 1.008 |
| Temperature (K) | 100 | 100 | 100 |
| Space group | P43212 | P43212 | P43212 |
| Unit-cell parameters | |||
| a (Å) | 143.5 | 143.9 | 144.6 |
| b (Å) | 143.5 | 143.9 | 144.6 |
| c (Å) | 196.9 | 195.1 | 199.1 |
| α (°) | 90 | 90 | 90 |
| β (°) | 90 | 90 | 90 |
| γ (°) | 90 | 90 | 90 |
| Matthews coefficient (Å3 Da−1) | 3.63 | 3.63 | 3.63 |
| Solvent content (%) | 66.13 | 66.13 | 66.13 |
| No. of molecules in ASU | 2 | 2 | 2 |
| Resolution range (Å) | 25–2.5 (2.6–2.5) | 20–2.6 (3.0–2.6) | 15–3.2 (3.4–3.2) |
| Observed reflections | 814751 (91136) | 1017071 (433517) | 168962 (28272) |
| Unique reflections | 71521 (7807) | 135035 (57041) | 65272 (10937) |
| Completeness (%) | 100 (100) | 99.7 (99.9) | 98.8 (99.6) |
| Rmerge† | 8.3 (32.7) | 9.3 (25.9) | 7.7 (23.4) |
| Average I/σ(I) | 17.15 (4.32) | 12.13 (5.11) | 14.16 (4.78) |
R
merge = 
 , where I
i(hkl) is the ith observation of reflection hkl and 〈I(hkl)〉 is the weighted average intensity for all observations i of reflection hkl.
Table 2. Phasing statistics.
Phasing took place with two derivatives by MIRAS using SOLVE in the resolution range 3.50–20.00 Å. All data sets were collected on SLS beamline PXII and were combined with CAD and scaled with SCALEIT prior to use in SOLVE.
| Phasing set | Native | TAMM | CsCl |
|---|---|---|---|
| Radiation source | SLS PXII | SLS PXII | SLS PXII |
| Preparation | — | 24 h soak, 10 mM in cryosolution | 20 min soak, 200 mM in cryosolution |
| Heavy-atom location method | — | INANO, ANOREFINE | INANO, NOANOREFINE |
| Phasing power (acentric/centric) | — | 1.48/1.11 | 0.73/0.56 |
| Figure of merit (all data) | — | 0.29 | 0.29 |
| Site | Occupancy | x | y | z | Biso (Å2) |
|---|---|---|---|---|---|
| Cs | 0.9622 | 0.5162 | 0.0548 | 0.0660 | 60.0000 |
| Cs | 0.3096 | 0.2603 | 0.0532 | 0.0563 | 34.0941 |
| Cs | 0.3968 | 0.3188 | 0.0662 | 0.0474 | 23.2865 |
| TAMM | 0.4994 | 0.2219 | 0.0871 | 0.1144 | 11.8249 |
Acknowledgments
The authors are grateful to the staff of the Swiss Light Source (SLS), Villigen, Switzerland for technical support and to Ilme Schlichting, Wulf Blankenfeldt and Eckhard Hofmann for data collection. The work was supported by DFG grant SCHA 591/2 to AS.
References
- Berger, D. & Altmann, T. (2000). Genes Dev.14, 1119–1131. [PMC free article] [PubMed]
- Collaborative Computational Project, Number 4 (1994). Acta Cryst. D50, 760–763.
- Felix, G. & Boller, T. (1995). Plant J.7, 381–389.
- Fuller, R. S., Brake, A. & Thorner, J. (1989). Proc. Natl Acad. Sci. USA, 86, 1434–1438. [DOI] [PMC free article] [PubMed]
- Kabsch, W. (1993). J. Appl. Cryst.26, 795–800.
- Liu, J. X., Srivastava, R., Che, P. & Howell, S. H. (2007). Plant J.51, 897–909. [DOI] [PMC free article] [PubMed]
- Meichtry, J., Amrhein, N. & Schaller, A. (1999). Plant Mol. Biol.39, 749–760. [DOI] [PubMed]
- Rautengarten, C., Steinhauser, D., Bussis, D., Stintzi, A., Schaller, A., Kopka, J. & Altmann, T. (2005). PLoS Comput. Biol.1, e40. [DOI] [PMC free article] [PubMed]
- Siezen, R. J. & Leunissen, J. A. M. (1997). Protein Sci.6, 501–523. [DOI] [PMC free article] [PubMed]
- Srivastava, R., Liu, J. X. & Howell, S. H. (2008). Plant J.52, 219–227. [DOI] [PMC free article] [PubMed]
- Terwilliger, T. C. (2000). Acta Cryst. D56, 965–972. [DOI] [PMC free article] [PubMed]
- Terwilliger, T. C. & Berendzen, J. (1999). Acta Cryst. D55, 849–861. [DOI] [PMC free article] [PubMed]
- Tripathi, L. & Sowdhamini, R. (2006). BMC Genomics, 7, 200. [DOI] [PMC free article] [PubMed]
- Vera, P. & Conejero, V. (1988). Plant Physiol.87, 58–63. [DOI] [PMC free article] [PubMed]
- Yamagata, H., Masuzawa, T., Nagaoka, Y., Ohnishi, T. & Iwasaki, T. (1994). J. Biol. Chem.269, 32725–32731. [PubMed]


