Abstract
In vivo knee contact forces are difficult to determine using numerical methods because there are more unknown forces than equilibrium equations available. We developed parametric methods for computing contact forces across the knee joint during the stance phase of level walking. Three-dimensional contact forces were calculated at two points of contact between the tibia and the femur, one on the lateral aspect of the tibial plateau, and one on the medial side. Muscle activations were parametrically varied over their physiologic range resulting in a solution space of contact forces. The obtained solution space was reasonably small and the resulting force pattern compared well to a previous model from the literature for kinematics and external kinetics from the same patient. Peak forces of the parametric model and the previous model were similar for the first half of the stance phase, but differed for the second half. The previous model did not take into account the transverse external moment about the knee and could not calculate muscle activation levels. Ultimately, the parametric model will result in more accurate contact force inputs for total knee simulators, as current inputs are not generally based on kinematics and kinetics inputs from TKR patients.
Keywords: Total Knee Replacement, Numerical Model, Contact Force
INTRODUCTION
Preclinical testing of total knee replacements (TKRs) with knee joint simulators and computational models require accurate in vivo contact force, muscle force, and joint angle input data. Kinematics can be obtained using gait analysis, but in vivo force data from instrumented TKRs (D’Lima et al., 2006; Zhao et al., 2007a; Zhao et al., 2007b; Mündermann et al., 2008) are just beginning to become available from one patient. For TKR patients, there is considerable inter-subject variability of patient kinetics (Andriacchi and Hurwitz, 1997) and kinematics (Ngai et al., 2007) making computational modeling a necessity for obtaining contact force and muscle force data for a larger patient population.
Muscle forces cannot be directly measured in vivo. Solving for contact forces and muscle forces at the knee joint is an indeterminate problem with more unknown variables than equations. Therefore, contact forces across the knee have traditionally been determined by reduction (Morrison, 1969; Schipplein and Andriacchi, 1991; Sharma et al., 2007, Wimmer and Andriacchi, 1997) or optimization methods (Röhrle et al., 1984; Seireg and Arvikar, 1975; Taylor et al., 2004). Reduction methods require reducing the number of unknown muscle forces to the number of equations, resulting in a determinate problem. Optimization methods minimize an objective function subject to a criterion but have historically tended to result in the overestimation of knee contact forces.
A parametric model for calculating hip contact forces was developed by Hurwitz et al. (2003). The parametric method allows for variation of individual muscle activation levels across their physiologic range resulting in a solution space of three-dimensional contact forces at each activation level. The method also allows muscles to have three-dimensional lines of action consistent with joint anatomy. Our goal was to develop a tool that could be used to determine the physiologic solution space of patient specific TKR contact and muscle forces. In this paper we present the modeling methods, and compare knee forces with those obtained from a previously published model (Wimmer and Andriacchi, 1997) using the same input data.
METHODS
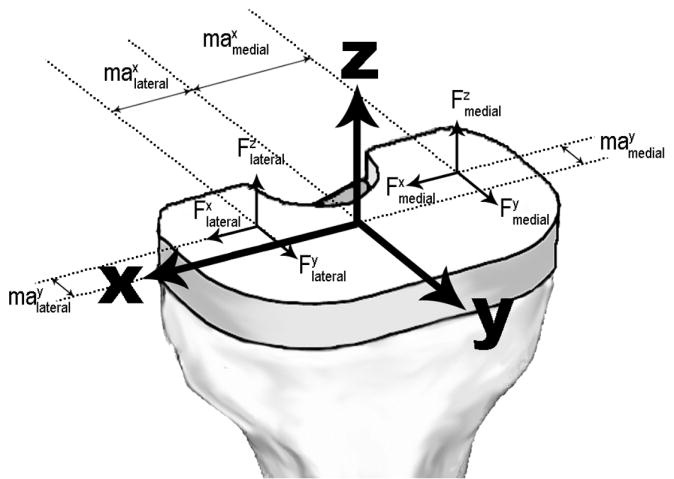
A coordinate system was first defined for the tibial plateau where the positive x, y, and z axes pointed laterally, anteriorly, and superiorly, respectively (Figure 1). The coordinate system originated at the intersection of mid-anterior-posterior (AP) and medial-lateral lines on the surface of the tibial plateau. Knee contact forces were defined at two different points of contact between the femur and tibia, one on the medial aspect of the tibial plateau (contact force components , , and ), and another on the lateral aspect of the tibial plateau (contact force components , , and ). The location of the points of contact were defined by variables , , , and in the coordinate system (Figure 1, Table 1). The coordinates for the points of contact had unique values at each instance of stance that corresponded to the movement of the femur on the tibia and defined the moment arms of the contact forces about the center of the tibial plateau.
Figure 1.

Coordinate system and location of the contact force components on the proximal tibia. The x-axis pointed laterally, the y-axis pointed anteriorly, and the z-axis pointed in the superior direction. The coordinate system originated at the intersection of mid-sagittal and mid-frontal planes on the surface of the tibial plateau. Contact forces ( , , , , , and ) were located at two points on the tibia, with locations defined by the contact point between the tibia and the femur ( , , , and ).
Table 1.
Definition of variables used in the equations for calculating contact forces across the knee joint.
| Variable | Definition | Method of Obtaining |
|---|---|---|
| , , | external moment about the x, y, and z-axis of the knee joint | gait analysis |
| , , | external force about the x, y, and z-axis of ihe knee joint | gait analysis |
| , , | maximum x, y, and z-direction moment for the ith muscle or passive structure in each group | SIMM output and Matlab software |
| , , | maximum x, y, and z-direction force for the ith muscle or passive structures in each group | SIMM output and Matlab software |
| , | x-direction distance from the origin of the coordinate system to the contact point (x-direction moment arm for z-direction contact forces). | coordinate of contact point |
| , | y-direction distance from the origin of the coordinate system to the contact point (y-direction moment arm for z-direction contact forces). | coordinate of contact point |
| ml_ratio | ratio defining the percent load transferred through the medial versus lateral side of the tibial plateau | set by the user |
| ai, bi, ci | relative activation level for the ith muscle in each agonist group | parametrically varied |
| A, B, C | group activation levels for each muscle agonist group | unknown, solve using equations |
| D | activation level for passive structures | 0 (on) or 1 (off) |
| E | activation level for antagonist muscles | set by the user |
| , | x-direction contact forces | unknown, solve using equations |
| , | y-direction contact forces | unknown, solve using equations |
| , | z-direction contact forces | unknown, solve using equations |
lateral and medial indicate the lateral or medial side of the tibial plateau, respectively
Equilibrium equations for moments (Equations 1, 2, and 3) and forces (Equations 4, 5, and 6) as well as equations that defined the relationship between the medial and lateral contact forces (Equations 7, 8, and 9) were written for the x, y, and z axes of the coordinate system.
| (1) |
| (2) |
| (3) |
| (4) |
| (5) |
| (6) |
| (7) |
| (8) |
| (9) |
Table 1 lists the definitions of all variables. The nine equations were used to calculate the values of nine unknown variables (six contact force components, , , , , , and , and three muscle group activation levels, A, B, and C). The unknown variables were calculated at 100 instances during the stance phase of level walking (every 1% of stance). Variables in the equations that were known, or calculated by other means, included the external moments and forces, and internal moments and forces from muscles and passive structures. Muscle force magnitudes, assuming maximum activation, were calculated using a SIMM (Software for Interactive Musculoskeletal Modeling, Santa Rosa, CA) musculoskeletal model of the lower limb. The model was modified from that reported by Hurwitz et al. (2003) and Delp et al. (1990) to allow input of knee joint motions for all six degrees of freedom. Software custom-written using Matlab v6.5 (The Mathworks, Natick, MA) was used to calculate the muscle moments about the knee joint, create muscle functional agonist groups, and solve the equilibrium equations. The muscles included in the model are listed in Table 2.
Table 2.
Muscles included in the model and example muscle group assignments for 21% stance of the patient analyzed. Agonist muscle groups A, B, and C represent muscles that are primary, secondary, and minor agonists, respectively, depending on their moment contribution about each axis of the coordinate system. At 21% stance the external moments were 2.60, -3.72, and -0.31 % body weight times height for moments about the x, y, and z axis, respectively (Figure 2). The muscle moments were calculated with custom-written Matlab software from the maximum muscle force obtained from the SIMM musculoskeletal model.
| Muscles | Group at 21% stance | Moment about x1 | Moment about y1 |
|---|---|---|---|
| Semimembranosus | antagonist | -1.99 | 1.28 |
| Semitendinosus | antagonist | -1.11 | 0.45 |
| Biceps fermoris (long head) | C | -1.26 | -2.27 |
| Biceps femoris (short head) | C | -0.49 | -1.31 |
| Sartorius | antagonist | -0.12 | 0.76 |
| Gracilis | antagonist | -0.17 | 0.36 |
| Tensor fasciae latae | B | 0.19 | -0.93 |
| Rectus femoris | A | 5.60 | -0.23 |
| Vastus lateralis | A | 4.39 | -0.18 |
| Vastus intermedialis | A | 3.58 | -0.15 |
| Vastus medialis | A | 3.25 | -0.13 |
| Popliteus | B | -0.46 | -0.90 |
| Plantaris | antagonist | -0.13 | 0.01 |
| Lateral gastrocnemius | B | -0.98 | -1.03 |
| Medial gastrocnemius | B | -1.75 | 2.25 |
Internal muscle moment with units % body weight times height.
Muscles were categorized into four groups: three agonist groups, and one antagonist group, based on their function at each instance during stance. Muscle groups were determined by comparing the muscle moment components to the external moment components calculated using gait analysis. Muscles were considered agonists if their largest moment component about the x, y, or z axis served to balance the corresponding external moment. After the agonists were identified, they were divided into three groups based on the moments they imposed about all three axes of the coordinate system. Muscles were assigned to the antagonist group if the largest moment component was antagonistic when compared to the external moments. As an example, muscle groupings corresponding to 21% stance (the first peak external knee flexion moment, Figure 2) are listed in Table 2.
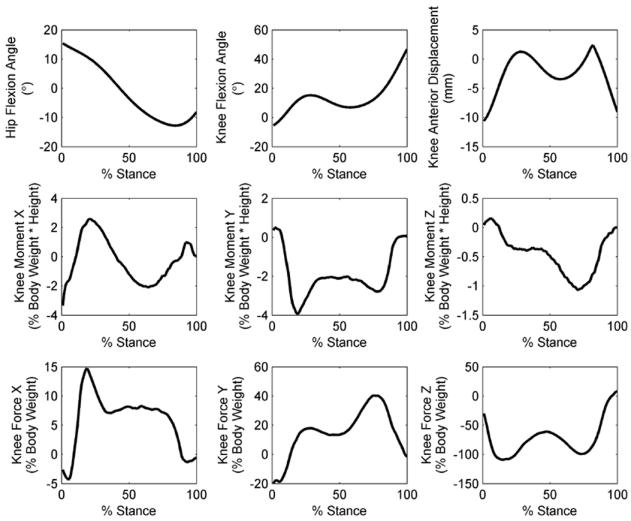
Figure 2.

Kinematics and external moments and forces during 100 instances of the stance phase of level walking for a patient with a TKR (Wimmer and Andriacchi, 1997).
Each muscle in the three agonist groups was assigned an individual muscle relative activation (ai, bi, and ci). This relative value was parametrically varied and the equilibrium equations solved at each value. The relative activation levels scaled the contribution of muscles within the same agonist group. To take into account the overall action of each group of agonist muscles, group muscle activation levels (A, B, and C), solved for with the equilibrium equations, also scaled the contribution of muscles within the same agonist group. Muscle activation level was defined as the product of the group activation level and relative activation level. Solutions were considered not valid if the product of the group and relative activation levels for any muscle was less than 0.0 (indicating an unphysiological role reversal or “pushing” rather than “pulling”) or greater than 1.0 (indicating muscle activation above the maximum physiological level).
The variable D, equal to zero or one, allowed for the omission or inclusion of the force and moment contribution from passive structures. The activation level of the antagonist muscles (E) was also a variable that could be parametrically varied. The variable “ml_ratio” defined the relationship between the contact forces on the medial and lateral aspects of the tibial plateau such that zero indicated only lateral force transfer and one indicated only medial force transfer. The ratio could also be parametrically varied and change temporally throughout the stance phase.
The parametric model was used to calculate knee contact forces for a TKR patient who had previously undergone gait analysis (Figure 2). AP displacement of the tibia (defining and ) was calculated following Wimmer and Andriacchi (1997). Variables and were set to the center of each side of the tibial plateau. Relative muscle activation levels ai, bi, and ci were varied between 0.1, 0.5, and 1.0. Variable “ml_ratio” was fixed throughout stance and set to 0.7 for the current analysis, indicating that 70% of the total contact force was transferred on the medial side. For the results reported in this study, the value of the moment contribution from the passive structures was equal to the difference between the external moment about the z-axis and the combined sum of the agonists muscle moment about the z-axis. Antagonist muscles were not included for the current analysis (E was set to zero). Results were compared to those from a previously published knee model (Wimmer and Andriacchi, 1997) for the same subject and the same walking trial.
RESULTS
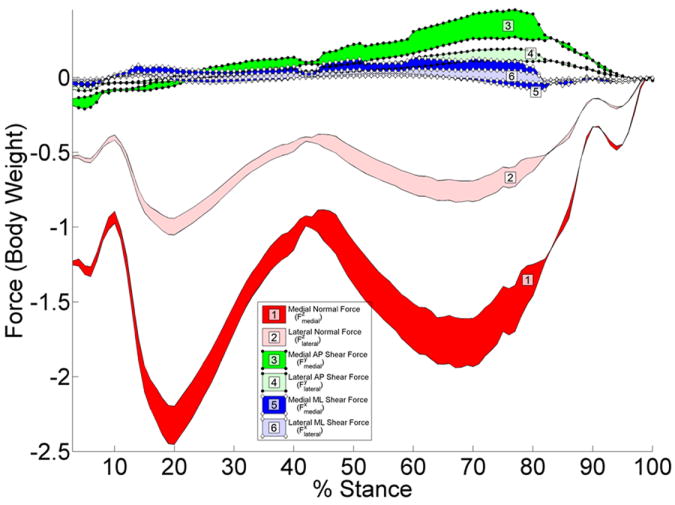
A solution space of contact forces, averaging 6828 solutions for every 1% of stance, was calculated (Figure 3A). The solution space was a result of parametric variation of the relative muscle activation levels. The peak normal force occurred at 21% of stance; the average of the solution space was -3.3 body weights at this point, with a range of 0.38 body weights. The maximum range of normal forces was 0.5 body weights at 67% of stance. The maximum range of the resultant total force was 0.85 body weights at 76% stance.
Figure 3.


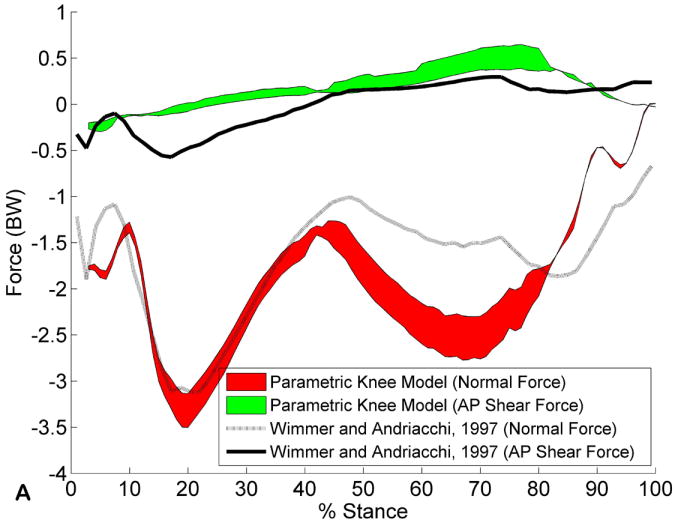
A. Three-dimensional contact forces (shaded regions) for 100 instances during the stance phase of level walking for the kinematics and external moments shown in Figure 2. Seventy percent of the total contact force was transferred through the medial tibial plateau, and 30% of the total contact force was transferred laterally. B. Comparison between the parametric model (results from the medial and lateral side are summed) and the results reported by Wimmer et al. (Wimmer and Andriacchi, 1997).
The results of the parametric model were similar to those reported by Wimmer and Andriacchi (1997) for the same subject and same walking trial (Figure 3B). Both the normal force (z-direction) and AP shear force (y-direction) were within ~0.5 body weight during the first half of the stance phase, but the normal force calculated by Wimmer and Andriacchi was less than that calculated with the current model during the second half of stance.
DISCUSSION
We have developed parametric methods for calculating three-dimensional knee joint contact forces through the medial and lateral aspects of the tibial plateau. This approach allows the physiological inclusion of all muscles crossing the knee joint. The calculated peak contact forces fit within the range reported in a review of previous numerical approaches (-1.7 to -4.9 body weights) (Komistek et al., 2005). The resulting solution space was reasonably small and the patterning compared well to that reported by Wimmer and Andriacchi (1997). While the peak force was very similar for both models (-3.12 previously versus -3.06 to -3.42 body weights for the current model), differences in force magnitude were present during mid- and terminal stance.
The previous model of Wimmer et al. calculated contact forces by grouping muscles into quadriceps, hamstrings and gastrocnemii, and balancing sagittal and frontal plane equilibrium equations while neglecting the transverse plane. This may account for the difference between the contact forces of the current and previous model during the second half of stance, as the z-axis external moment reached a peak value during that time (Figure 2). Muscles are not strategically aligned to counteract a transverse moment (typically a function of the cruciate ligaments); therefore the inclusion of this plane may be essential in determining accurate contact forces for TKR patients.
The medio-lateral force ratio was within the range of previously reported values (Johnson et al., 1980; Hsu et al., 1990; Schipplein and Andriacchi, 1991; Hurwitz et al., 1998; Shelburne et al., 2006), and for simplicity, was constant throughout stance although the ratio can vary with time in the model. For example, the ratio could follow the change in external knee adduction moment as recent studies with telemetric knee joints found a correlation between the medial contact force and the external knee adduction moment (Chaudhari et al. 2006; Zhao et al. 2007b).
Another simplification was that muscle activity for the antagonist group was set to “zero”. Despite this, the model allowed for co-contraction because muscles were not forced to act as agonists in all planes. This is exemplified during the first half of stance by the inclusion of the biceps femoris muscles because of their agonist contribution to the frontal and transverse planes, even though they act as antagonists in the sagittal plane.
The model could be modified to include more patient specific attributes by scaling the SIMM model to patient-specific anatomy and using patient specific electromyography to refine muscle group assignment. Further, the use of patient-specific knee contact kinematics will result in the correct assignment of in vivo muscle force lever arms to balance the external moments.
This parametric approach, newly applied to the knee, has many potential biomechanical and clinical applications that are not all possible with previous optimization and reduction approaches. For example the effect of the absence of soft tissue structures and/or the injury of muscle structures can be easily studied. Detailed systematic studies of antagonist muscle activity, contact paths, and medio-lateral force ratio variation are possible. Finally, by using in vivo input data, the parametric model can be used to determine more accurate contact and muscle force inputs for knee joint simulators and computational models, including the contact and muscle forces during a variety of activities of daily living.
Acknowledgments
The authors would like to acknowledge the input from Valentina Ngai, Idubijes Rojas, and Andrea Swanson. Funding was provided by the NIH (R03 AR052039 and T32 AR052272). The study sponsors had no role in the study design, data collection and analysis, writing of the manuscript, or in the decision to submit the manuscript for publication.
Footnotes
CONFLICT OF INTEREST STATEMENT: This study was funded by NIH R03 AR052039 and T32 AR05227.
Publisher's Disclaimer: This is a PDF file of an unedited manuscript that has been accepted for publication. As a service to our customers we are providing this early version of the manuscript. The manuscript will undergo copyediting, typesetting, and review of the resulting proof before it is published in its final citable form. Please note that during the production process errors may be discovered which could affect the content, and all legal disclaimers that apply to the journal pertain.
References
- Chaudhari AM, Dyrby CO, D’Lima DD, Colwell CW, Andriacchi TP. A direct test of the relationship between medial compartment load and the knee adduction moment using an instrumented knee. 52nd Annual Meeting of the Orthopaedic Research Society. 2006:0608. [Google Scholar]
- Delp SL, Loan JP, Hoy MG, Zajac FE, Topp EL, Rosen JM. An interactive graphics-based model of the lower extremity to study orthopaedic surgical procedures. IEEE Transactions on Biomedical Engineering. 1990;8:757–767. doi: 10.1109/10.102791. [DOI] [PubMed] [Google Scholar]
- D’Lima DD, Patil S, Steklov N, Slamin JE, Colwell J, Clifford W. Tibial Forces Measured In Vivo After Total Knee Arthroplasty. The Journal of Arthroplasty. 2006;2:255–262. doi: 10.1016/j.arth.2005.07.011. [DOI] [PubMed] [Google Scholar]
- Draganich LF, Andriacchi TP, Andersson GB. Interaction between intrinsic knee mechanics and the knee extensor mechanism. Journal of Orthopaedic Research. 1987;4:539–547. doi: 10.1002/jor.1100050409. [DOI] [PubMed] [Google Scholar]
- Hsu RWW, Himeno S, Coventry MB, Chaomund YS. Normal Axial Alignment of the Lower Extremity and Load-Bearing Distribution at the Knee. Clinical Orthopaedics & Related Research. 1990:215–227. [PubMed] [Google Scholar]
- Hurwitz DE, Foucher KC, Andriacchi TP. A new parametric approach for modeling hip forces during gait. Journal of Biomechanics. 2003;1:113–119. doi: 10.1016/s0021-9290(02)00328-7. [DOI] [PubMed] [Google Scholar]
- Hurwitz DE, Sumner DR, Andriacchi TP, Sugar DA. Dynamic knee loads during gait predict proximal tibial bone distribution. Journal of Biomechanics. 1998;5:423–430. doi: 10.1016/s0021-9290(98)00028-1. [DOI] [PubMed] [Google Scholar]
- Johnson F, Leitl S, Waugh W. The distribution of load across the knee. A comparison of static and dynamic measurements. Journal of Bone and Joint Surgery - British. 1980;3:346–349. doi: 10.1302/0301-620X.62B3.7410467. [DOI] [PubMed] [Google Scholar]
- Komistek RD, Kane TR, Mahfouz M, Ochoa JA, Dennis DA. Knee mechanics: a review of past and present techniques to determine in vivo loads. Journal of Biomechanics. 2005;2:215–228. doi: 10.1016/j.jbiomech.2004.02.041. [DOI] [PubMed] [Google Scholar]
- Morrison JB. Function of the knee joint in various activities. Bio-Medical Engineering. 1969;12:573–580. [PubMed] [Google Scholar]
- Mündermann A, Dyrby CO, D’Lima DD, Colwell CW, Jr, Andriacchi TP. In vivo knee loading characteristics during activities of daily living as measured by an instrumented total knee replacement. Journal of Orthopaedic Research. 2008;9:1167–1172. doi: 10.1002/jor.20655. [DOI] [PubMed] [Google Scholar]
- Ngai V, Wimmer MA. Variability in secondary motions of the knee following total joint replacement. Annual Meeting of the American Society of Biomechanics 2007 [Google Scholar]
- Röhrle H, Scholten R, Sigolotto C, Sollbach W, Kellner H. Joint forces in the human pelvis-leg skeleton during walking. Journal of Biomechanics. 1984;6:409–424. doi: 10.1016/0021-9290(84)90033-2. [DOI] [PubMed] [Google Scholar]
- Schipplein OD, Andriacchi TP. Interaction between active and passive knee stabilizers during level walking. Journal of Orthopaedic Research. 1991;1:113–119. doi: 10.1002/jor.1100090114. [DOI] [PubMed] [Google Scholar]
- Seireg A, Arvikar The prediction of muscular load sharing and joint forces in the lower extremities during walking. Journal of Biomechanics. 1975;2:89–102. doi: 10.1016/0021-9290(75)90089-5. [DOI] [PubMed] [Google Scholar]
- Sharma A, Komistek RD, Ranawat CS, Dennis DA, Mahfouz MR. In vivo contact pressures in total knee arthroplasty. The Journal of Arthroplasty. 2007;3:404–416. doi: 10.1016/j.arth.2006.07.008. [DOI] [PubMed] [Google Scholar]
- Shelburne KB, Torry MR, Pandy MG. Contributions of muscles, ligaments, and the ground-reaction force to tibiofemoral joint loading during normal gait. Journal of Orthopaedic Research. 2006;10:1983–1990. doi: 10.1002/jor.20255. [DOI] [PubMed] [Google Scholar]
- Taylor WR, Heller MO, Bergmann G, Duda GN. Tibio-femoral loading during human gait and stair climbing. Journal of Orthopaedic Research. 2004;3:625–632. doi: 10.1016/j.orthres.2003.09.003. [DOI] [PubMed] [Google Scholar]
- Wimmer MA, Andriacchi TP. Tractive forces during rolling motion of the knee: implications for wear in total knee replacement. Journal of Biomechanics. 1997;2:131–137. doi: 10.1016/s0021-9290(96)00112-1. [DOI] [PubMed] [Google Scholar]
- Zhao D, Banks SA, D’Lima DD, Colwell CW, Jr, Fregly BJ. In vivo medial and lateral tibial loads during dynamic and high flexion activities. Journal of Orthopaedic Research. 2007a;5:593–602. doi: 10.1002/jor.20362. [DOI] [PubMed] [Google Scholar]
- Zhao D, Banks SA, Mitchell KH, D’Lima DD, Colwell CW, Jr, Fregly BJ. Correlation between the knee adduction torque and medial contact force for a variety of gait patterns. Journal of Orthopaedic Research. 2007b;6:789–797. doi: 10.1002/jor.20379. [DOI] [PubMed] [Google Scholar]


