Abstract
For modern Time-Of-Flight PET systems, in which the number of possible lines of response and TOF bins is much larger than the number of acquired events, the most appropriate reconstruction approaches are considered to be list-mode methods. However, their shortcomings are relatively high computational costs for reconstruction and for sensitivity matrix calculation. Efficient treatment of TOF data within the proposed DIRECT approach is obtained by 1) angular (azimuthal and co-polar) grouping of TOF events to a set of views as given by the angular sampling requirements for the TOF resolution, and 2) deposition (weighted-histogramming) of these grouped events, and correction data, into a set of “histo-images”, one histo-image per view. The histo-images have the same geometry (voxel grid, size and orientation) as the reconstructed image. The concept is similar to the approach involving binning of the TOF data into angularly sub-sampled histo-projections -projections expanded in the TOF directions. However, unlike binning into histo-projections, the deposition of TOF events directly into the image voxels eliminates the need for tracing and/or interpolation operations during the reconstruction. Together with the performance of reconstruction operations directly in image space, this leads to a very efficient implementation of TOF reconstruction algorithms. Furthermore, the resolution properties are not compromised either, since events are placed into the image elements of the desired size from the beginning. Concepts and efficiency of the proposed data partitioning scheme are demonstrated in this work by using the DIRECT approach in conjunction with the Row-Action Maximum-Likelihood (RAMLA) algorithm.
Keywords: Time-Of-Flight, PET, iterative reconstruction, list-mode, image space reconstruction
I. Introduction
THE potential benefit of using Time-Of-Flight (TOF) information for Positron Emission Tomography (PET) imaging was recognized as early as 1969, as noted in reviews of PET [1]-[3], but TOF did not receive much attention until the properties of the fast scintillators CsF and BaF2 were publicized [4], [5], indicating their potential use for TOF-PET. Much work was done on TOF-PET in the early 1980s, but some properties of these fast scintillators were far from ideal, and it was soon found that better overall imaging performance could be obtained by non-TOF scanner designs using other scintillators. For many years, TOF-PET received little attention, but interest was revived once again by the introduction of new scintillators with an attractive combination of properties [6]-[9], including fast timing characteristics, good stopping power, and high light output. There is now strong interest in TOF-PET because of the significant performance improvements that are possible, as shown in evaluations using simulated data (including [10], [11]) and experimental measurements on TOF scanners [12]-[16].
Full realization of the TOF benefits requires proper reconstruction tools. Many important elements of the theory of image reconstruction from TOF-PET data were published more than 25 years ago in two seminal papers [17], [18]. With the extra data dimension brought by TOF information, typical acquired TOF data become very sparse in (histo-)projection space. Consequently, the most natural TOF reconstruction approaches are list-mode approaches [19]-[23] that accurately (geometrically and statistically) treat each TOF event separately. However, for the typical number of acquired events in a clinical patient study, conventional list-mode reconstructions with accurate modeling are computationally very expensive.
The computational burdens of list-mode approaches are further exacerbated by the calculation requirements for the sensitivity matrix, which has to be calculated specifically for each reconstructed object based on its own attenuation map. The sensitivity matrix is calculated using all possible lines of response (given by detector crystal pairs) passing through the reconstruction region, including those for which no events were detected. For modern PET systems with a large number of possible lines of response (LORs), exact calculation of the sensitivity matrix using straightforward space-based approaches is not feasible for routine use. There are several strategies with various levels of approximation that allow faster computation of the sensitivity matrix, such as using a properly down-sampled LOR space [24]-[26]. The number of needed LOR samples and the level of approximations depend on a number of factors (e.g., data statistics, object characteristics, detector geometry) and have to be carefully chosen so that the errors propagated from the sensitivity image [26], [27] do not negatively impact image quality. Another option involving reasonable approximations, which is used in this work, is a Fourier-based approach. The advantage of such an approach is great computational efficiency without the need to down-sample the LOR space.
To make list-mode reconstruction time clinically feasible (even with a multi-node cluster of computers) various simplifications and/or restrictions are often needed, such as truncating the TOF and/or resolution kernels, limiting the size of the basis functions and of their underlying grid density, limiting the number of iterations, limiting the number of counts and time frames in dynamic, temporal, and motion-synchronized studies, or using simplified data correction approaches. The goal of the proposed approach is to make TOF reconstruction efficient without compromising image quality via such restrictions. The efficiency of the proposed approach - Direct Image Reconstruction for TOF (DIRECT) [28] - is obtained by directly working in image space. That means that the data and all corrections are placed directly into (histo-image) voxels in image space, and consequently all reconstruction operations are performed in image space. At the same time the proposed approach has the ability to preserve geometrical accuracy (within the limits given by image and angular sampling) similar to list-mode approaches. Several aspects of the proposed approach were inspired by concepts introduced into TOF-PET that appeared in papers from early 1980s. However, our proposed approach involves a new level of use of these concepts. These include placing events directly into image space rather than into projection space [18], [19], merging/grouping events into sets of views and tilts [29] (and recently [30]-[32]), and using maximum-likelihood (ML) based statistical reconstruction [19], [20], [33] (and recently [12], [21], [22]). We also build on our previous work at the University of Pennsylvania, including the image space reconstruction approach (ISRA) [34], 3D view-by-view row-action maximum-likelihood algorithm (RAMLA) [35], Fourier-based reconstruction approaches [36]-[38], TOF list-mode reconstruction [23], and TOF reconstruction using histo-projections from limited views [30], [39].
The work presented here describes the principles of the DIRECT approach and gives preliminary results based on simulation studies to demonstrate the performance and properties of the proposed technique, compared with list-mode iterative TOF reconstruction.
II. DIRECT Data: View-grouped Histo-images
The DIRECT approach encompasses the data partitioning scheme and the methods needed to apply a reconstruction algorithm to the given data structure. In this section we outline basic concepts and operations for transforming (pre-processing) acquired data into the DIRECT format; in the next section we discuss the operations of a reconstruction algorithm within the DIRECT framework.
The DIRECT partitioning involves two steps: the acquired events are first sorted (“view-grouped”) into a set of views and then histogrammed (“deposited”) into histo-image elements.
1) Angular view-grouping of TOF events
In this step, the acquired TOF events are sorted into a set of “views,” where each view compromises a range of LOR directions having azimuthal angles within a specified interval and co-polar angles within a specified interval. Based on the angular sampling requirements, events acquired on systems with good TOF resolution can be sorted into a relatively small number of views, with only a minimal or no loss of spatial resolution [29], [30], [39]. Events from each view have a common TOF kernel (same representative orientation and kernel width) and common data correction arrays. Furthermore, unlike in the non-TOF case, for the TOF data any spatial resolution loss due to the angular binning has been shown to be approximately spatially invariant [30]; this invariance allows efficient modeling of the effect during reconstruction. The view-grouping leads to a markedly less sparse and reduced data space and a reduction in the number of TOF kernels to be considered.
2) Deposition (weighted histogramming) of view-grouped TOF events into histo-images
Traditionally, binned TOF events are histogrammed into “histo-projections” (projections extended in the TOF direction through an image space). Histo-projections are geometrically similar to rotated and resampled images as illustrated in Fig. 1-left. In our approach, the acquired events are deposited prior to reconstruction directly into the voxels of the “histo-images,” with one histo-image per view. The histo-images have the same sampling (voxel size) and geometry as the reconstructed image, as illustrated in Fig. 1-right. The same data structures are used for the deposition of the correction factors, such as attenuation, geometric sensitivity, estimated scatter, and random coincidences. Various deposition strategies are possible (e.g., an event is assigned with different weights to neighboring bins), and the effect of the deposition operation can be efficiently modeled in the forward- and back-projectors during reconstruction. The “histogramming” deposition operation based on nearest-neighbor interpolation is similar to the one in the “most-likely-position” reconstruction technique [18]. Deposition using more accurate interpolation kernels better preserves information about the positions of individual events, and this will be the subject of future studies. In this work, we have employed a tri-linear interpolation kernel.
Fig. 1.
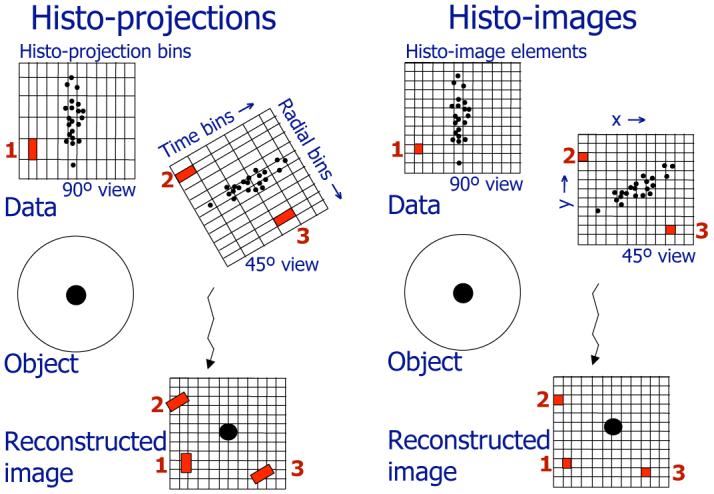
Comparison of the data formats for binned TOF data (histo-projections for 45° and 90° views - left) and the DIRECT approach (histo-images for 45° and 90° views - right) — Histo-projections can be viewed as an extension of individual non-TOF projections into TOF directions (time bins), and their sampling intervals relate to the projection geometry and timing resolution. Acquired events are first histogrammed into the histo-projection bins; during the reconstruction process individual histo-projection bins are then repetitively traced through reconstructed image voxels (examples for 3 bins - 1, 2, 3 - are shown). In the DIRECT approach histo-images are defined by the geometry and desired sampling of the reconstructed image. Acquired events and correction factors are directly placed into the image resolution elements of individual histo-images (one histo-image per each view) having a one-to-one correspondence with the reconstructed image voxels. All reconstruction and data correction procedures are done directly, and very efficiently, in image space.
The approach using histo-images has a number of advantages:
natural format driven by the reconstructed image geometry (i.e., events are directly stored/deposited into the desired resolution units - voxels of the desired size),
data and image with the same format/structure, allowing very efficient implementation of data correction and reconstruction operations,
format of data structures that allows efficient implementation on advanced computational devices, such as multiprocessor and parallel architectures, graphics cards, and specialized signal processor boards,
no ray-tracing or interpolation operations (which impact resolution models) required within forward- and back-projection,
independence of reconstruction speed on the number of acquired counts,
independence of reconstruction speed on the TOF and resolution kernel sizes (if Fourier-based convolution operations are used).
III. DIRECT: Iterative TOF Reconstruction
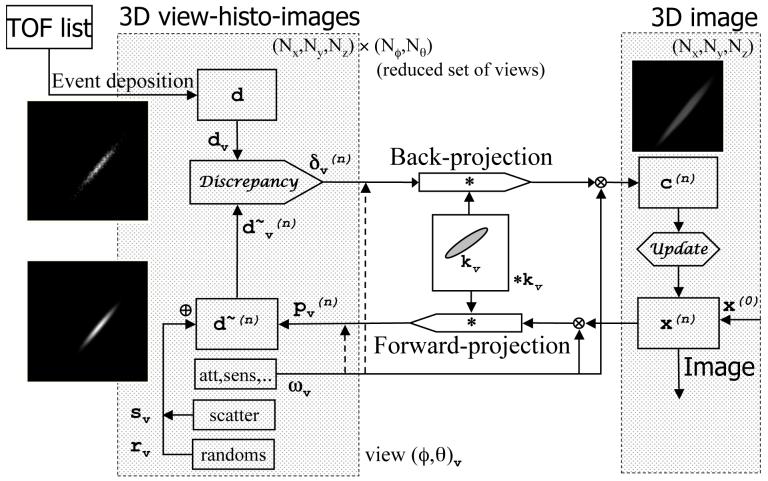
The proposed approach and principles allow efficient implementation of both iterative and analytical algorithms; however, in this work we concentrate on iterative TOF reconstruction. The algorithm flowchart shown in Fig. 2 is applicable to most iterative reconstruction algorithms. In this paper, we illustrate the DIRECT approach used in conjunction with the row-action maximum-likelihood algorithm (RAMLA) [35], [42], [43] with a view-by-view update. All data structures utilized while processing a particular view v (in sub-iteration n) are 3D arrays of the same geometry holding relevant data for view v: x(n) - image array, ωv - multiplicative corrections, kv - forward-projection kernel (including models of TOF and detector/LOR resolution effects, model of the deposition operation, and possibly including other models of 3D image resolution, regularization, and image basis functions, such as blobs [44]), - forward projection, - data estimate, dv - deposited data, sv - estimate of expected scatter, rv - estimate of expected randoms, - data discrepancy, and - correction image. Note that the actual memory requirement for DIRECT is much smaller than implied by Fig. 2. For example, only three full 3D arrays are needed for RAMLA with view-by-view updating and four arrays for RAMLA using subsets, rather than the seven arrays shown. We further use the following notation: ·, /, and + denote point-wise multiplication, division, and addition between the elements of two 3D arrays, or between a constant and elements of a 3D array, is the 3D convolution operation, and (relaxation parameter) and 1 are scalars. For RAMLA, the individual steps (from Fig. 2, solid lines) for sub-iteration n processing view v are:
forward-projection: ,
data estimate: ,
discrepancy operation: ,
back-projection: ,
update operation: .
The multiplicative correction array ωv includes attenuation and other multiplicative correction factors, such as sensitivity including gaps and axial acceptance, which are treated similarly as in other (projection-based or list-mode) statistical algorithms, as discussed in more detail in Section IV.A. The back-projection operation is the transpose of forward-projection as dictated by statistical iterative algorithms. It is interesting to note that the 3D convolution operations in both forward-projection and in its transpose are equivalent, since in the DIRECT approach the data and image have the same format. General forms of the forward-projection, data estimate, and back-projection operations are the same for most iterative algorithms. On the other hand, exact forms of the discrepancy and update operations are determined by the particular statistical algorithm. A subset-type of strategy will differ only in the update operation, which will include a normalized sum of correction images for all of the views from the given subset. Examples of single view images resulting from the various operations are included in Fig. 3.
Fig. 2.
Flowchart of TOF iterative reconstruction using the DIRECT approach. Each 3D view-grouped histo-image contains all events from a given “view” (comprising a range of azimuthal and co-polar angles). All data (d, d∼, ω, s, r) are in the same histo-image format. Forward- and back-projection operations are 3D convolutions involving proper 3D TOF resolution kernel kv (taking into account TOF, detector, and image based resolution functions) for each view v. Modeling of the multiplicative corrections ω before or after (dashed lines) the forward-projection is discussed in Section IV. Discrepancy and Update operators (both operating in image space) are defined by a particular iterative algorithm. The DIRECT approach can be used for both view-by-view and ordered subset iterative strategies. The DIRECT approach can also be used for analytical reconstruction, utilizing just the top part of the flowchart: deposited (and pre-corrected) data are first sequentially back-projected view-by-view (confidence weighted back-projection), and the resulting image is then properly filtered (in place of the update operation). If complete data are needed, the forward-projection part of the flowchart can be used for calculation of the axially missing regions in the oblique data (similar to what is done in the 3D reprojection (3DRP) algorithm [40], [41]).
Fig. 3.
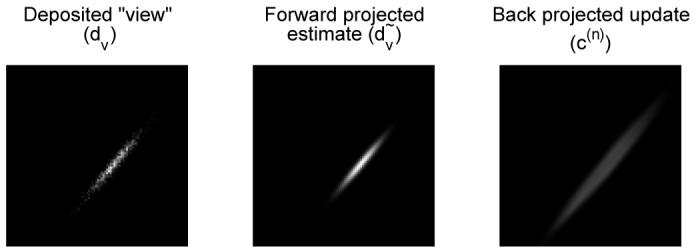
Examples of results of representative operations from Fig. 2. Left: central slice of 3D histo-image (dv) for view v (ϕ = 40° θ = 0°) containing 1000 deposited events simulated for an off-center point source. Middle: TOF forward-projection of an image containing a point source at the same location (both images are scaled to their own maxima). Right: correction image c(n) resulting from back-projection of the discrepancy image δv of the two above-mentioned images.
Forward- and back-projection operations, which are the computational bottleneck of any reconstruction algorithm, can be efficiently implemented within the DIRECT approach on a standard computer as well as on specialized computer architectures. Spatially invariant resolution kernels can be implemented very efficiently in the Fourier domain via Fourier-based 3D convolutions, as demonstrated in this paper. Spatially variant kernels, however, must be implemented in the spatial domain. Even in this case, very efficient implementation of these operations is possible within DIRECT framework. For example, substantial acceleration of the spatial convolution operations has been reported when using commodity graphics cards [45].
IV. DIRECT: Forward model and corrections
In typical emission data the true events (having a Poisson character) are distorted and contaminated by a number of physical factors. To make the best use of the acquired data and of our knowledge of the acquisition system, these factors should be included into the reconstruction model. The contamination factors can be divided, by their character and the way they are treated, into multiplicative and additive terms. The multiplicative factors include: attenuation of the annihilation photons by the object, the probability of a pair of crystals detecting an event once they are hit by the photon pair (detector normalization factors), and the geometrical restriction of direction/LORs for which true events are detected (axial acceptance angle, detector gaps). The additive factors include estimates of the expected scattered and random coincidences. Within the DIRECT approach, the correction factors are placed into the same histo-image format as the true events. This format allows not only a very efficient reconstruction process but also efficient generation of the correction factors themselves. For analytical reconstruction approaches the data would have to be pre-corrected using these factors. In statistical reconstruction methods, an attempt is made to preserve the Poisson character of the data as much as possible by including the correction factors inside the reconstruction model through appropriate multiplicative factors and additive terms.
A. Forward model - true events and multiplicative factors
In statistical reconstruction, the sequence of the physical effects that occur as the coincident events are generated and detected is modeled within the system (probability) matrix. The system matrix can be factorized into a sequence of operations [46] modeling individual stages of this process as discussed in detail in review paper [47]:
| (1) |
where Ppositron models the positron range, Pgeom contains the geometric probabilities (without attenuation) that photon pairs from individual image locations (points in a voxel) reach the front faces of given crystal pairs (LORs), Patt is a diagonal matrix containing attenuation factors, Ptof models the timing accuracy (TOF resolution kernel), Pdet.blur models the accuracy of reporting the true LOR position (referred to as the detector resolution kernel in this work), and Pdet.sens is a diagonal matrix modeling the probability that an event will be reported once the photon pair reaches the detector surface (crystals or gaps) - a unique multiplicative factor for each detector crystal pair (LOR) modeled by normalization coefficients, but including also the detector axial extent and detector gaps. In general, the positron range has a small effect (compared to the other factors) for whole-body scanners, particularly for 18F-labeled tracers. Therefore, we will omit this factor from further discussion in this paper.
In the following, we consider that the emission counts and attenuation coefficients are approximately uniform within the size of a voxel, as given by the system resolution. Under this condition the attenuation factors (in Patt) can be considered to be constant for the events included in the corresponding elements in Pgeom, and consequently, places of Patt and Pgeom can be permuted in the sequence (formal structure of the matrices changes with the permutation). Pgeom, Ptof, and Pdet.blur can then be modeled together. In the following derivations we further consider that after the afore-mentioned process the events are angularly grouped based on the TOF angular sampling requirements. The forward model of the true portion of the view-grouped events (p) is then given by:
| (2) |
where G represents the view-grouping operation, P is the system matrix (as discussed above) and x is the emission image. Efficient implementation of this model within DIRECT framework is derived below using the following symbols (consistent with Fig. 2):
pv,m - value in voxel m of histo-image of view v, estimating the true portion of events deposited into the m-th voxel of histo-image dv;
xm - emission activity giving the number of events emitted from voxel m;
ωi,m - multiplicative factor along line (LOR) of direction i passing through voxel m;
- sum over set Nv of directions i (as given by crystal spacing) grouped into view v (operator G);
- 3D convolution of image x with resolution kernel for direction i, Δl is 3D location in the support of kernel , where the support is denoted by . We show here a spatially invariant kernel, i.e., the kernel is the same for each location m, but different for each direction i; however, the following derivation holds also for spatially variant kernels, such as those based on Monte-Carlo simulations [48]-[50] or obtained experimentally [51].
1) Uniform detectors with no gaps
For scanners with a uniform distribution of crystals with no gaps and for data pre-corrected for detector normalization factors (as is often done in practice [51]-[53]), the process of the generation-acquisition-deposition of the true events can be modeled as G P = G PsysPω, where Psys combines the deposition kernel, Pdet.blur, Ptof and Pgeom, and Pω represents the attenuation factors Patt. Note that the following derivation does not preclude adding additional blurring operations to the right, such as an image basis function model or Ppositron, e.g., G P = G PsysPωPpositron. The forward-projection of true events for a particular view v, and voxel m can be written as (details on derivation of the following sequence of expressions are below):
| (3) |
where . This derivation is based on the fact that if the range Nv of directions i used in each view v is less than that dictated by the angular TOF sampling requirement [39], the image values accessed through the convolution sums over convolution kernel give approximately the same value for any direction i within a given view. Consequently, the convolution sums and kernels can be approximated by a representative convolution over for given view v (second expression). This convolution sum is now independent of i within each view v and the outside sum over the directions i can therefore be moved inside and applied only to the multiplicative correction coefficients prior to the convolution operation (3rd expression). Note that while the local convolution sums over the emission activity x within the resolution kernel regions do not depend on the particular direction within a view, the sum over the attenuation (and other multiplicative) factors does, since the attenuation factors are not local, but are determined by the attenuation on the entire length of an LOR. Therefore the sum must still be performed over all directions within each view v. However, because of the rearrangement of sums allowed by the locality of the emission convolutions, the factors ωv,m can be pre-calculated for each voxel in each view, forming the correction matrix ωv for each view v. Forward-projection for a given view v can then be calculated by point-wise multiplication of the image values by this correction matrix, followed by a forward-projection operation that consists of convolution of the corrected image with the (combined) resolution kernel as shown in the flowchart of Fig. 2 (solid lines).
Attenuation factors on lines i in the projection space can be very efficiently calculated from the attenuation image using Fourier-based forward-projectors [37], [38]. After combining attenuation and other correction coefficients in projection space, we can calculate the multiplicative correction matrix ω in histo-image format by calculating the sum very efficiently via Fourier-based back-projections; there is a separate back-projection for each view, each using the proper range of directions of correction factors in projection space.
2) Modular detectors with gaps
Current commercial scanners have modular detectors with gaps between adjacent modules and with discrete changes of orientation of the detector module faces. A proper model requires the gap information to be included in the system matrix as part of the matrix Pdet.sens, even if the data are pre-corrected for other normalization factors. When there are gaps between detector modules, we cannot drop the factor Pdet.sens from eq. 1 (as was considered for the no-gap case). Pdet.sens is a multiplicative correction matrix, as is Patt, but between these in eq. 1 are the convolution operations representedby Pdet.blur and Ptof. However, efficient implementation of the multiplicative corrections is possible only if all view dependent corrections are combined together in the system matrix sequence. Pdet.sens changes abruptly from LOR to LOR, due to gaps and crystal dependent normalizations, and cannot be moved inside the convolution sums. On the other hand, the attenuation factors change more slowly and typically do not change dramatically within the range given by the detector resolution kernel. This allows us to approximate the system matrix sequence by moving the attenuation correction from before to after the convolution (forward-projection) operations. Note that in conventional iterative reconstruction, the attenuation step is, in fact, routinely done after the forward-projection, which is much more efficient for binned projection data. In the following, we derive DIRECT modeling operations for the case when we combine attenuation coefficients with Pdet.sens after the forward-projection operations (dashed line in the flowchart in Fig. 2): G P = G PωPsys, where Psys combines Pdet.blur, Ptof, Pgeom and can include also the image based resolution kernels [54], image basis function model, or regularizing functions, and Pω includes attenuation, information on detector gaps, and detector normalization. The forward-projection of the true events for a particular view v and voxel m can then be written (following the same principles as in the previous case) as:
| (4) |
The choice of one of the two multiplicative correction modeling approaches as derived above (eq. 3 vs. eq. 4) will depend on the particular system’s characteristics (e.g., existence of gaps and detector resolution) as well as on the imaging application (speed of changes and/or resolution of the emission and attenuation images) and will be the subject of future studies.
B. Additive factors
Scatter
In conventional non-TOF PET, a true coincidence carries the information that an annihilation event occurred somewhere along the LOR connecting the opposing pair of detector elements. In TOF-PET, the information about the position of the annihilation is more localized, since the approximate position along the LOR is also measured. Similarly, in TOF-PET the possible locations of scatter are more localized, since a pair of photons that have undergone one or more scatters can be registered in a TOF “bin” only if the difference between the two path lengths from the annihilation to the detectors is within the timing uncertainty of the true photon pairs contributing to this bin. The single-scatter case is the most important in both conventional (non-TOF) PET and TOF PET [55], [56]. Much effort has been directed towards the development of efficient model-based methods to estimate the expected contribution of single-scatter events to the measured data [57]-[59]. More recently, a model-based single-scatter estimation algorithm has been developed that takes into account the spatial as well as timing distribution of scattered events for TOF-PET data [60], [61], and it is in routine use for clinical imaging at our institution. This algorithm can be modified to calculate the scattered events (sv) directly in histo-image format to be used within DIRECT reconstruction. Care has to be taken that the scatter estimates are treated in the same way as the true event estimates in the forward-projection model, including gap information and consideration of normalized or un-normalized events. Various challenges exist for scatter estimation in general (independent of DIRECT approach), such as modeling of out-of-FOV scatter, but their solutions can be directly imported into the DIRECT (or any other) approach.
Randoms
Similar to scatter, techniques for randoms estimation are independent of the reconstruction approach, and the estimates of the expected randoms (rv) can be directly deposited into histo-images as is done for the true events. It should be noted that although randoms and scatter estimates are shown as separate arrays in the reconstruction flowchart (Fig. 2), once they are estimated, they can be combined into a common array for more efficient storage.
V. Methods
A. Data simulations
Full scanner simulations were performed using a Monte Carlo tool based upon the EGS4 simulation package [62]. We simulated a realistic whole body TOF scanner having a 25-cm axial field of view (FOV), ±15° axial acceptance angle, with continuous distribution of crystals on a cylindrical detector surface with no gaps and a 5.8-mm spatial resolution [11]. Simulations were performed for timing resolutions of 300 ps and 600 ps.
The simulated phantoms were 27-cm and 35-cm diameter cylinders having clinically relevant volumes and attenuation factors representative of average and heavy patients, respectively [15]. Simulated data included attenuation effects but not scatter or random events. Hot spherical lesions of size 10, 13, 17 and 22 mm and contrast 4:1 were simulated in two different slices (see Fig. 4). We generated 6 different data sets of true list-mode events, each having 40M counts. Different numbers of counts were then used from the simulated lists: an average count case (20M and 30M counts corresponding to the heavy and average patient cases, respectively), and a very low count case challenging the reconstruction approaches (6M and 9M counts, respectively). For both the average and low count studies, the two count levels represent approximately the same acquisition times for the two patient sizes.
Fig. 4.

Graphical illustration of phantoms (transverse and axial views) and their placement within the 25-cm axial FOV (indicated by the light gray shaded regions in the axial views) of the simulated scanner. Hot lesion phantom (left three images): 25-cm long phantom with 27 (and 35) cm diameter with hot spherical lesions in two different slices. The central slice (slice A) contained three sets each of 22, 17, 13, and 10-mm diameter spheres, all placed at a radial distance 7 cm from the transverse center. An off-center slice (slice B) at an axial position one-quarter of the axial FOV from the center (6.25 cm) contained eight uniformly distributed 10-mm diameter spheres, again at a radial position of 7 cm. The activity uptake ratio for the hot spheres was 4:1 with respect to the background. Short phantom (right image): 11-cm long cylindrical phantom with 35-cm diameter centered in the scanner. The phantom contained eight 10-mm hot spheres (same configuration as slice B in the hot lesion phantom); the edges of the spheres were located about 15 mm from the axial edge of the phantom.
To test the data modeling in the DIRECT approach (as derived in Section IV.A) with respect to abrupt attenuation changes and angular view-grouping, we also simulated a “short phantom” with abrupt axial truncation of attenuation and emission distributions and with hot lesions being located in close proximity to this truncation (see Fig. 4). For comparison purposes we also simulated a 25-cm “long phantom” filling the whole axial FOV of the scanner that was otherwise equivalent to the short phantom.
B. Reconstructions
We used a block version of RAMLA in the DIRECT and list-mode TOF, and in the list-mode non-TOF reconstructions. In all reported experiments the relaxation parameter was set to 1.0 (although RAMLA updates were implicitly relaxed by attenuation and sensitivity matrix values). In the DIRECT approach, we grouped and deposited events into 40 × 3 views - 40 intervals in azimuthal angle and 3 intervals in co-polar angle, except for the study on view-grouping effects where we varied the number of views (10-40 azimuthal and 1-5 copolar intervals). The 40 × 3 set of views was fixed in the rest of the studies based on the view-grouping experiments, so that the view-grouping effects will have minimal impact on the results. Each view represented one subset/block of RAMLA, giving us 120 (geometrically-ordered) updates for one pass through the data in the 40 × 3 view case. Note that the tilted views are not complete because of the limited axial extent of the detector, and consequently the effective amount of update is smaller than for the non-tilted views (centered on co-polar angle zero), or for subsets based on temporal subdivision of data from all directions. In the reported studies we employed TOF kernels representing 300-ps and 600-ps TOF resolutions of simulated data, and modeled a 5.8-mm (FWHM) spatially invariant detector resolution kernel and a 4-mm (FWHM) data deposition kernel. In the comparison studies with list-mode approaches, we also incorporated a model of the blob basis function into DIRECT. The resolution and basis function filters were all applied in the Fourier domain, providing the same computational time independent of the kernel size. In the list-mode approach (with temporal-ordering), the events were subdivided into 60 temporal subsets, each representing one subset/block of RAMLA and each subset covering all views. This number of subsets provided similar convergence speed (contrast and noise increase per iteration) to DIRECT using RAMLA with 120 geometrical subsets and a comparable blob model. List-mode reconstruction used blob basis functions placed on a body-centered cubic grid (radius = 10 mm, shape parameter α = 8.63, grid unit cell size = 8 mm), based on our experience with these particular parameters in our previous studies. The final image array was 144×144×62 with 4 mm3 voxels.
C. Measures
The behavior of the proposed approach in conjunction with iterative reconstruction was investigated using the contrast vs. noise trade-off for a range of iterations and reconstruction parameters. Contrast recovery coefficients (CRC) were calculated for all sphere sizes and locations as: , where ps is the mean value in a 2D circular region of interest (ROI) axially and transversely centered over the sphere (with the ROI having the same diameter as the feature and positioned using a neighborhood search to maximize each sphere’s mean value over all realizations), pb is the mean value in the 2D annular region centered over each sphere (with the inner radius being 7 mm larger than the feature radius and with annular thicknesses being carefully selected to give a similar annular area for any feature size while not being influenced by neighboring features), and c is the ideal contrast value. The transverse centering was done with with sub-voxel accuracy (within 0.5 mm), and the contribution of each voxel value to the ROI or annular region was weighted by the proportion of its area within the ROI or annulus. The average CRC value for a given sphere size was then calculated using the three (eight for 10-mm lesions in slice B) sets of each sphere in each of the six noise realizations, leading to a total of 18 (48) different realizations.
Depending on the study goals, there are several established ways of assessing noise within reconstruction approaches. One of our goals was assessment of effects of the studied approaches on the spatial noise within the images. From qualitative visual inspection of the images and image profiles, the spatial structure of the noise in the DIRECT and list-mode approaches was seen to be very similar (e.g., see Figs. 6 and 7). Consequently, we believe that a pixel-to-pixel noise measure captures the noise effects within our studies. In our evaluations, we used features having a range of sizes, and our noise measure over fixed size 50-mm ROI included image variations over the corresponding range of spatial scales. The range of spatial scales of the noise measure was limited from below by the 4-mm voxel size, which is about half of the smallest (10 mm) lesion size. An upper limit on the spatial scale of the noise measure was imposed by setting to 50 mm the diameter of the ROI in which the pixel-to-pixel noise standard deviation was evaluated. This upper limit corresponds to about twice the size of the largest (22 mm) lesion. The noise ROI was centered in the feature slices, and the calculated standard deviation values were averaged over all realizations and normalized by the background mean value. We also evaluated the standard deviation across the realizations. The general conclusions for the two noise assessment approaches were consistent, and we report only on the pixel-to-pixel noise measure.
Fig. 6.
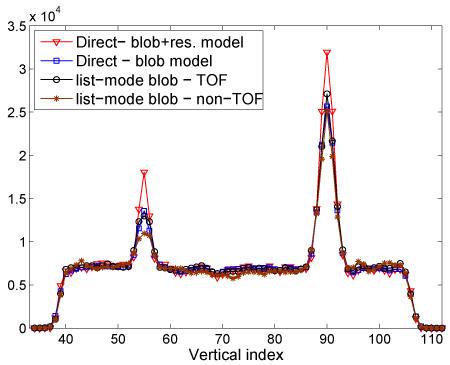
Vertical profiles (averaged over 6 realizations) through the middle of the central slices (through the 10 and 17-mm lesions) of the images illustrated in Fig. 7-left column.
Fig. 7.
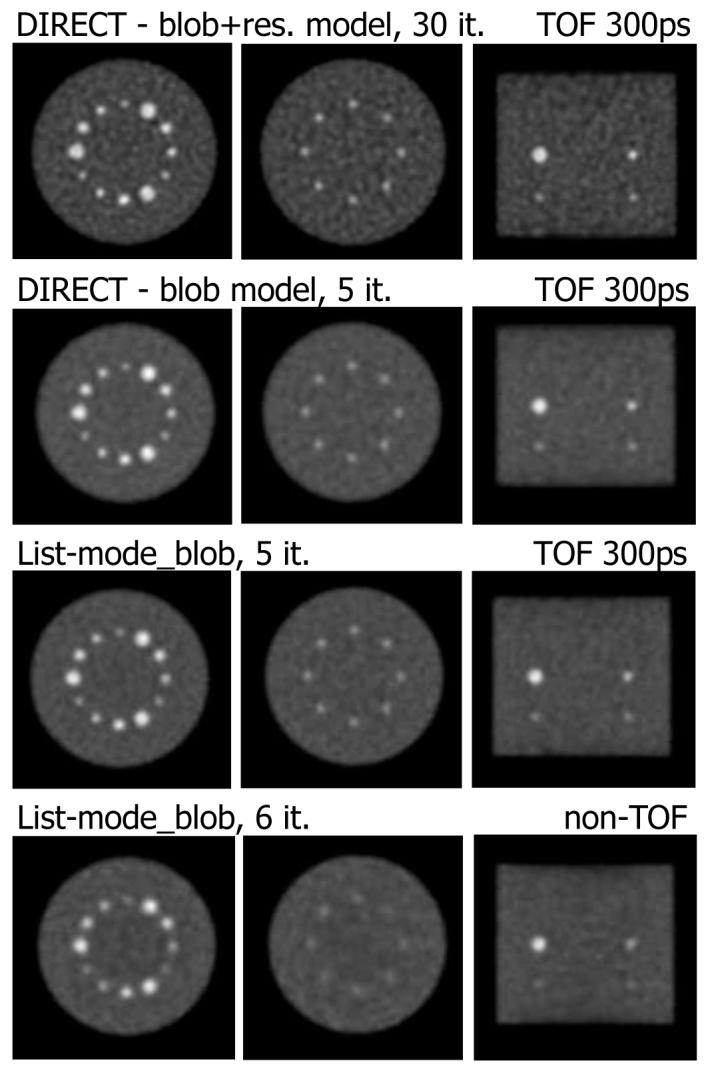
Transverse (left: central slice A, middle: slice B) and coronal (right) slices from DIRECT and list-mode RAMLA reconstructions represented in Fig. 5 (27-cm phantom, 30M counts, 300-ps TOF resolution). DIRECT with blob and list-mode (TOF) reconstructions (2nd and 3rd row) are shown at matched noise (and contrast) levels. Bottom row shows non-TOF list-mode reconstruction with similar noise level, but lower contrast. We illustrate also DIRECT reconstruction with resolution modeling (top row) at a high iteration number (30 iterations), to demonstrate that resolution modeling improves lesion contrast without introducing background artifacts.
VI. Results
A. Effects of partitioning scheme - DIRECT vs. List-Mode
Fig. 5 shows contrast vs. noise trade-off curves for the various reconstruction approaches studied, using the same algorithm and blob basis function model. It can be seen from the curves that DIRECT with a comparable model is able to match the contrast-noise performance of list-mode TOF reconstruction, but for a much smaller computation time (see Table I). For illustration, we also show the curve for DIRECT reconstruction that additionally includes modeling of the intrinsic resolution of the simulated data (not included in the list-mode reconstructions). The resolution modeling provides an improved contrast vs. noise trade-off, as expected with statistical reconstruction independent of data partitioning approach (whether DIRECT, binned, or list-mode). The same modeling can be incorporated also into the list-mode approach, but at the cost of a several times longer reconstruction time. We emphasize that in the DIRECT approach the reconstruction time is the same independent of the resolution kernel size, since the resolution modeling is done in the Fourier domain. Examples of images and mean central profiles (over six realizations) for the contrast vs. noise levels marked by gray ellipses in Fig. 5 are shown in Figs. 6 and 7. DIRECT and list-mode TOF and non-TOF reconstructions with the same model are shown for matched noise levels (bottom three rows). It can be seen that the visual quality of the images and profiles are consistent with observations based on the contrast vs. noise curves. Additionally we show also the image (top row) and profile for the DIRECT reconstruction with resolution modeling at a high iteration number to illustrate that it does not lead to an unstable behavior and does not introduce background artifacts.
Fig. 5.
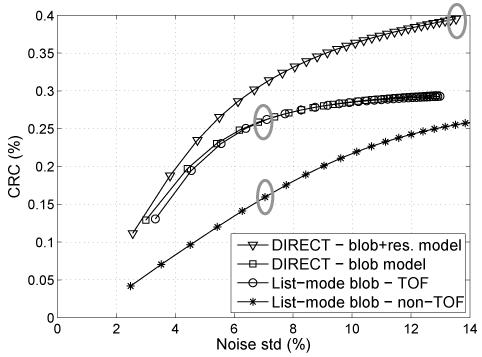
Contrast vs. noise trade-off curves for DIRECT and list-mode (TOF and non-TOF) approaches using the same reconstruction algorithm (RAMLA) and (blob) basis function model (10 mm lesions, central slice, 27-cm phantom, 30M counts, 300-ps TOF resolution). DIRECT with blob model is able to match the contrast vs. noise trade-offs and overall image quality of the list-mode TOF reconstruction, but with an order of magnitude shorter time (see Table I). We illustrate also the trade-off curve for DIRECT reconstruction with additional resolution modeling (blob + res. model) as given by the intrinsic resolution of the simulated data. Gray ellipses mark iterations for which we show example images and corresponding profiles in Figs. 6 and 7.
TABLE I.
Sample Computation Times for the Tof Reconstruction and Sensitivity Matrix Generation
| TOF reconstruction | Counts | 300 ps | 600 ps | Sensitivity matrix generation |
|---|---|---|---|---|
| List-Mode TOF | 20M 40M |
6 min/it 12 min/it |
11 min/it 22 min/it |
Space-based approach (full LOR space) ≈1* hour |
| DIRECT (40 × 3 views) |
any count level |
1.4* min/it |
Fourier-based approach (DIRECT geometry) ≈1* min |
|
(Image size 144×144×62, 2-GHz Mac G5, single processor
non-optimized and using generic FFT routines.)
B. Effects of number of views on TOF kernel approximation
In the DIRECT approach, each view-grouped histo-image is considered to have a common TOF kernel. In the simplest case, this kernel is approximated by a single TOF kernel at a fixed orientation in 3D given by the central direction (azimuthal and co-polar angles) of the view (“simple TOF kernel” in the following). More accurate modeling would involve a TOF kernel averaged over the range of directions represented in the individual views. The simple TOF kernel is a good approximation if the angular sampling requirements are fulfilled [30]. For example, for a TOF resolution of 300 ps and a spatial resolution of 4 mm, the minimum required number of azimuthal angular intervals is about 18, and for 600 ps it is about 35. In the co-polar angle it would be approximately 3 and 5 tilts for 300 ps and 600 ps, respectively, for the central plane of our simulated system with a ±15° axial acceptance angle, and fewer away from the center. If the angular sampling requirements are not met, the simple TOF kernel does not accurately model the deposited data, and the angular grouping introduces blurring. However, this blurring is spatially invariant in the TOF case [30] and can be efficiently incorporated into the reconstruction model. Fig. 8 shows contrast vs. noise trade-off curves for the 10-mm spheres for DIRECT reconstruction using the simple TOF kernel from 600-ps data deposited into variable number of azimuthal (top) and co-polar intervals (bottom). No view-grouping blur was modeled in these experiments, so as the number of views decreases below the sampling requirements (35 azimuthal samples and 5 co-polar samples for the 600-ps case), the contrast vs. noise trade-off starts to deteriorate. The angular TOF sampling requirements are important also for the proper modeling of corrections, as discussed in Section IV.
Fig. 8.
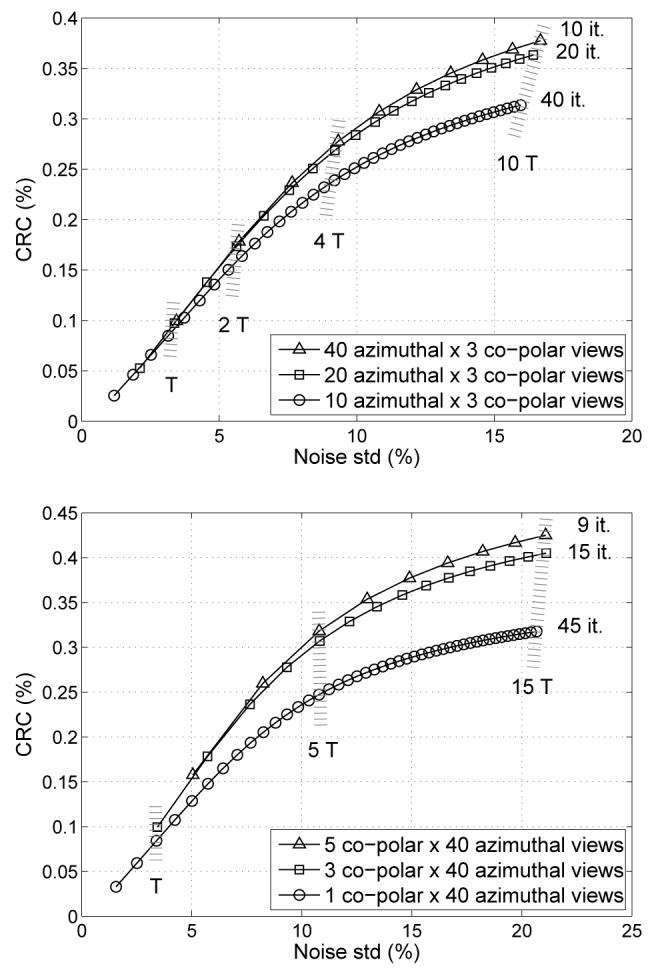
Illustration of view-grouping - azimuthal (top) and co-polar (bottom) - effects within the DIRECT approach on contrast vs. noise trade-offs for simulated data grouped into 10, 20, and 40 azimuthal (top) and into 1, 3, and 5 co-polar (bottom) angular intervals (curves for 10-mm lesions in 27-cm phantom, 30M counts, 600-ps TOF resolution). Each symbol location represents one iteration, i.e., one pass through all views for each case. T denotes one unit of computational effort equivalent to 1 iteration of the 40×3-views case (equal T values imply comparable reconstruction times). Note that grouping events into fewer views requires more iterations (but comparable time) to achieve approximately comparable contrast vs. noise trade-offs, if a sufficient number of views is used.
It is worthwhile to mention here that for algorithms with a view-by-view update such as RAMLA (or the ordered-subsets expectation-maximization algorithm), in which the number of updates per iteration depends on the number of views, using fewer views means that we need to perform more passes (iterations) through the data to get the same number of image update operations. Consequently, those algorithms can achieve similar contrast vs. noise trade-offs for a similar total reconstruction time “independent” (within reason) of the number of views used, as seen from Fig. 8. This in turn allows the use of a sufficiently large number of views without increasing the total reconstruction time. This is unlike the filtered back-projection or maximum-likelihood expectation-maximization (without subsets) algorithms in which the number of views directly affects the total reconstruction time. On the other hand, we do not want to increase the number of views too much either, since a higher number of views also means fewer counts per histo-image and consequently sparser data.
C. Effects of axially truncated object
While each individual voxel in the reconstructed image is affected only by the emission activity from a local area as given by the TOF resolution, the attenuation contributions come from the whole LOR length. In Section IV, we showed that even those “long distance” factors can be properly modeled in DIRECT, i.e. it is possible to do the view-grouping and still have accurate modeling. Our studies confirmed that even when we group together events for which the photon pairs travel through a significantly different attenuation, or non-attenuation, regions (as is the case for the events emitted from the 10-mm spheres in the short phantom), DIRECT properly models this situation and the reconstruction quality is not affected. Axially we grouped data into 1, 3, and 5 co-polar intervals and compared performance of reconstructions of the short phantom with abrupt attenuation truncation close to the spheres with those from the long phantom with no truncation. Fig. 9 shows transverse and sagittal images of the short phantom for the reconstruction using 3 co-polar intervals. Axial profiles through the short and corresponding long phantom images are shown in Fig. 10. Both cases provide very similar performance with minimal effects of the object truncation on the reconstruction. Fig. 11 shows CRC curves, as a function of the iteration number, for short and long phantom reconstructions for 1 and 3 co-polar interval cases. The 5 co-polar interval case (not shown) provided very similar comparison and contrast values to the 3 interval case (similar to Fig. 8).
Fig. 9.
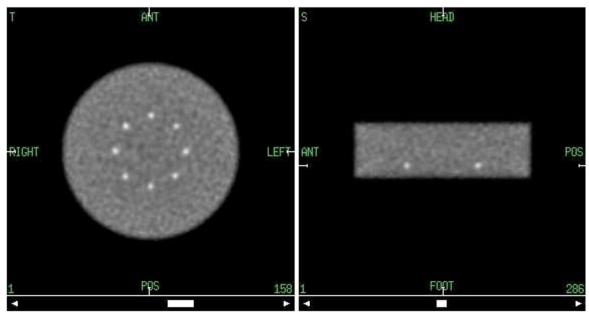
Transverse (left) and sagittal (right) slices of the short phantom (11 cm) with abrupt truncation of attenuation and emission activity at approximately 1/4 of the axial FOV (from both sides) of the simulated scanner. The edges of the 10-mm spherical lesions are located axially 15 mm from the phantom edge (phantom diameter 35 cm, 600-ps TOF resolution, DIRECT reconstruction using RAMLA with resolution modeling, 40×3 views, 4-mm voxels, 15 iterations).
Fig. 10.
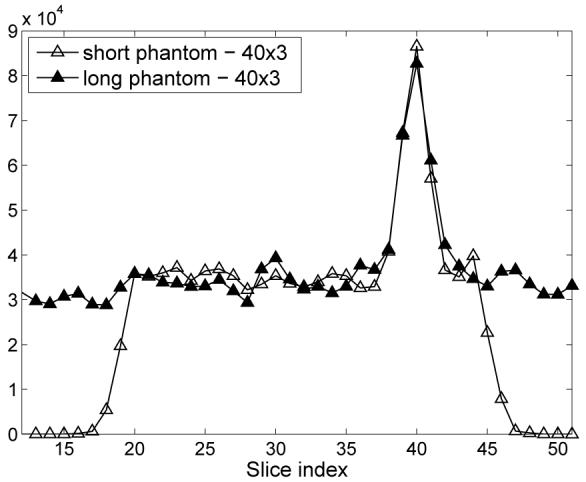
Axial profiles (averaged over 6 realizations) through one of the 10-mm spheres of the short (11 cm) and long (25 cm) phantom reconstructions (phantom diameter 35 cm, 600-ps TOF resolution, DIRECT reconstruction using RAMLA with resolution modeling, 40×3 views, 4-mm voxels, 15 iterations - marked with gray ellipse in Fig. 11).
Fig. 11.
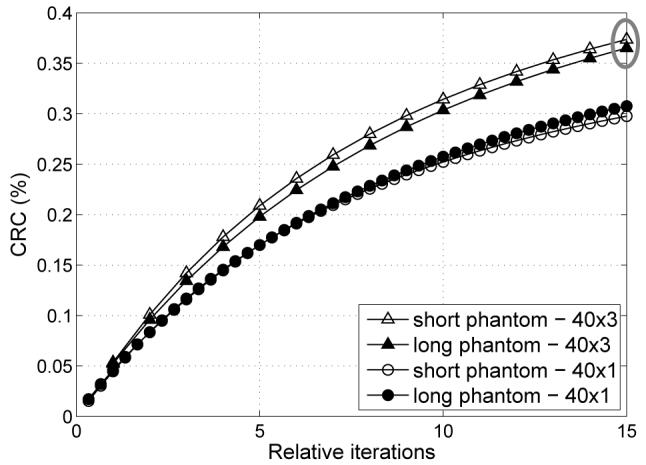
Contrast of 10-mm spheres as a function of iteration number for short (truncated) and long (continuous) phantoms, for data grouped into 1 and 3 co-polar intervals (phantom diameter 35 cm, 600-ps TOF resolution, DIRECT reconstruction using RAMLA with resolution modeling, 40 azimuthal intervals; one relative iteration represents equivalent total computation time to one iteration of the 3-tilt case). Abrupt truncation of the attenuation and emission objects does not negatively affect DIRECT performance as seen on the contrast measures and as illustrated by images and profiles shown in Figs. 9 and 10 for 15-th iteration marked with gray ellipse in this plot.
D. Effects of number of counts
The number of acquired counts, voxel size, and number of views determine the count densities of individual histo-images. For very low count cases it might be reasonable to adapt the size of the image elements or amount of the regularization (changing the resolution-noise trade-off). However, the purpose of this study was to investigate the effect of counts by themselves without doing any adaptation based on count levels. Fig. 12 illustrates contrast vs. noise trade-off curves for different count levels and object sizes. Fig. 13 shows representative images of the central slices for comparable contrast levels (as marked by the shaded bar in Fig. 12). In the lowest count case each histo-image contained on average only 1 count per 5 voxels inside the object. As seen from the images and graphs, the combination of DIRECT and RAMLA approach proved to be robust without any undesirable artifacts even for very low counts.
Fig. 12.
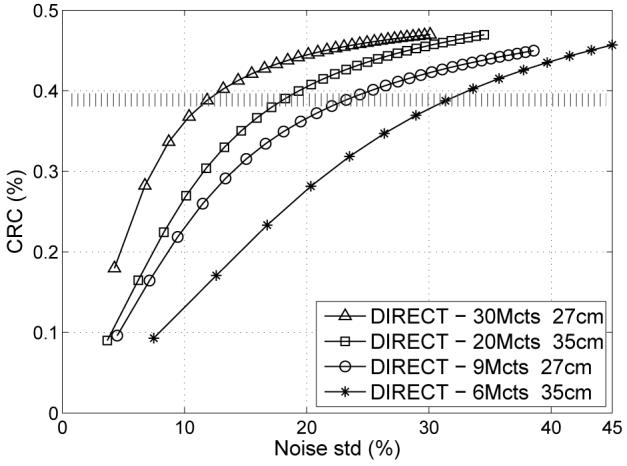
Contrast vs. noise trade-off curves for DIRECT reconstructions from data with typical clinical count levels (30M and 20M) and very low count levels (9M and 6M) for objects emulating average (27 cm) and heavy (35 cm) patient sizes, respectively (10-mm lesions, 300-ps TOF resolution, DIRECT reconstruction using RAMLA with resolution modeling, 40×3 views).
Fig. 13.
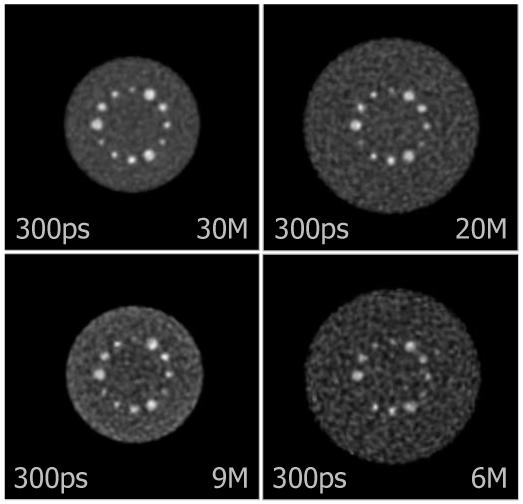
Central slices of DIRECT reconstructions at matched contrast levels for 10-mm sphere (marked by shaded bar in Fig. 12) from data with typical clinical count levels (30M and 20M) and very low count levels (9M and 6M) for objects emulating average (27 cm) and heavy (35 cm) patient sizes. As expected with a statistical reconstruction algorithm, the noise levels are determined by the number of counts in the data, and useful images are obtained even at very low count levels. These examples illustrate that the statistical algorithm performs as expected when operating on the data partitioning used in DIRECT.
E. Effects of timing resolution
Fig. 14 illustrates contrast versus noise trade-off curves for different TOF resolutions and object sizes. Fig. 15 shows representative images of individual cases for comparable contrast levels (as marked by the shaded bar in Fig. 14). It is clear from the graphs and visual image quality that better TOF timing resolution improves reconstruction performance, as has been previously shown for list-mode TOF reconstruction [11].
Fig. 14.
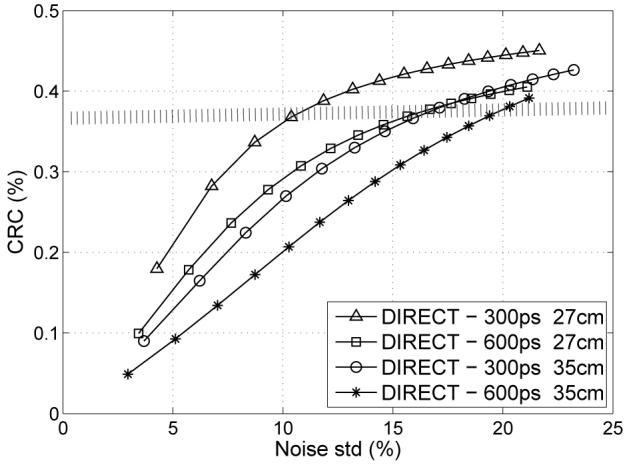
Contrast vs. noise trade-off curves for DIRECT reconstructions from data with 300-ps and 600-ps TOF resolution (10-mm lesions, 27-cm and 35-cm phantoms, 30M and 20M counts, respectively, DIRECT reconstruction using RAMLA with resolution modeling, 40×3 views).
Fig. 15.
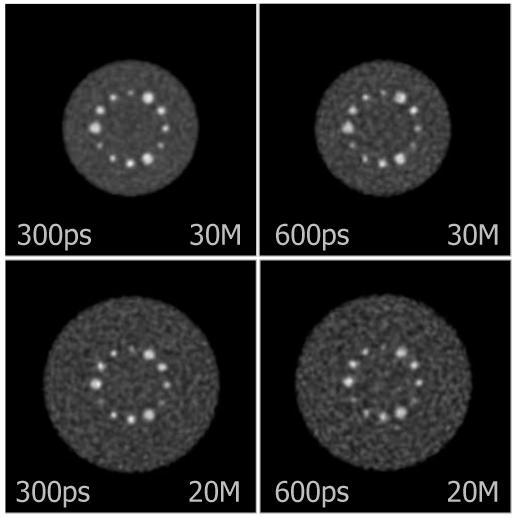
Central slices of DIRECT reconstructions at matched contrast levels for 10-mm sphere (marked by shaded bar in Fig. 14) from data with 300-ps and 600-ps TOF resolution for objects emulating average (27 cm) and heavy (35 cm) patient sizes.
F. Computational demands
The computational bottlenecks of any iterative reconstruction are the forward- and back-projection operations, and DIRECT is no exception. Forward- and back-projections are performed in DIRECT using 3D convolutions. For the Fourier-based implementation of those operations, virtually all of the DIRECT reconstruction time is taken by the 3D Fourier transformations - four 3D fast Fourier transforms (FFTs) per each update (or view) of the algorithm, for a total of 480 3D FFTs per iteration in our example. FFT routines can handle this task on the DIRECT structures extremely efficiently even on a standard computer, as seen from the Table I. The memory demands of DIRECT are minimal; the approximate sizes of data structures involved in the studies presented are as follows: 320 MB disk file of list data with 40M events; 300 MB disk file with deposited histo-images (image size 144×144×62, 40×3 views; float values stored in scaled 2B integers), and same for corrections (scatter and random images can be stored also in a down-sampled form, since they are slowly varying); and 20 MB total computer memory (RAM) needed by DIRECT for four 3D arrays (only one view is processed and needs to be in the memory at any time). Even if the image size increases several times, the RAM and disk requirements will be still comfortably within the possibilities of standard computers.
Table I shows representative reconstruction times per iteration of DIRECT and list-mode TOF reconstructions on a 2-GHz Mac G5 single processor (image size 144×144×62). Reconstruction parameters were used as outlined in Section V.B. In the list-mode reconstruction we used blobs on the body-centered grid, no detector resolution modeling was applied, and the TOF kernel was truncated at ±3σ of the Gaussian timing resolution kernel. Reconstruction times of DIRECT do not depend on the number of counts or the sizes of the resolution and TOF kernels. Reconstruction times given for the particular single processor are only illustrative to give insight about the relative computational demands of the approaches. The computational gain of the DIRECT will further increase for higher number of counts; it will also increase for larger image sizes, as expected with the Fourier-based approaches. DIRECT, as well as list-mode approaches, can be efficiently parallelized for a cluster of computers or other parallel computer architectures. DIRECT operations can be very efficiently implemented also on GPUs, but this is outside the scope of the presented work.
The large computational demand of the space-based calculation of the sensitivity matrix results from the fact that all crystal pairs (LORs) must be considered, including those for which no events were detected. For modern PET systems with a large number of LORs, calculation of the sensitivity matrix itself can be computationally more expensive than one iteration through the acquired emission events during the reconstruction stage, as illustrated in Table I. There are several possibilities to speed up the sensitivity matrix calculation, as discussed in the Introduction. Substantial speed-up of the sensitivity matrix calculation within DIRECT geometry has been obtained using the Fourier-based forward- and back-projection operations.
VII. Conclusions
We have presented the Direct Reconstruction for TOF data (DIRECT) approach, working directly in image space and allowing very efficient implementation of reconstruction and data correction operations, without compromising image quality. Our feasibility studies show the potential for about an order of magnitude speed-up in reconstruction compared to our clinical TOF list-mode reconstruction of TOF-PET data for a typical patient study. Furthermore, the DIRECT approach allows modeling of resolution and TOF kernels/filters without any extra computational cost. Our future work will involve comprehensive evaluations using measured data, including scatter and random events, from realistic emission and attenuation objects acquired on our clinical TOF-PET scanner [15], [16] and our research TOF-PET scanner with LaBr3 with improved timing resolution [63], [64].
Acknowledgment
The authors thank the reviewers for their valuable comments and suggestions, and gratefully acknowledge L.M. Popescu for helpful comments on this work and M. Werner for help with practical issues concerning reconstruction software and data.
This work was supported by the National Institutes of Health under grants EB002131 and CA113941.
Contributor Information
Samuel Matej, Department of Radiology, University of Pennsylvania, Philadelphia, PA 19104 USA.
Suleman Surti, Department of Radiology, University of Pennsylvania, Philadelphia, PA 19104 USA surti@mail.med.upenn.edu.
Shridhar Jayanthi, Department of Electrical Engineering and Computer Science, University of Michigan, Ann Arbor, MI 48109 USA jayanthi@umich.edu..
Margaret E. Daube-Witherspoon, Department of Radiology, University of Pennsylvania, Philadelphia, PA 19104 USA daubew@verizon.net.
Robert M. Lewitt, Department of Radiology, University of Pennsylvania, Philadelphia, PA 19104 USA Robert.Lewitt@uphs.upenn.edu.
Joel S. Karp, Department of Radiology, University of Pennsylvania, Philadelphia, PA 19104 USA joelkarp@mail.med.upenn.edu.
References
- [1].Muehllehner G, Karp JS. Positron emission tomography. Phys. Med. Biol. 2006;51(13):R117–R137. doi: 10.1088/0031-9155/51/13/R08. [DOI] [PubMed] [Google Scholar]
- [2].Lewellen TK. Time-of-Flight PET. Seminars in Nuclear Medicine. 1998;28(3):268–275. doi: 10.1016/s0001-2998(98)80031-7. [DOI] [PubMed] [Google Scholar]
- [3].Moses WW. Time of flight PET revisited. IEEE Trans. Nucl. Sci. 2003;50(5):1325–1330. [Google Scholar]
- [4].Allemand R, Gresset C, Vacher J. Potential advantages of a Cesium Fluoride scintillator for a time-of-flight positron camera. J. Nucl. Med. 1980;21(2):153–155. [PubMed] [Google Scholar]
- [5].Laval M, Moszynski M, Allemand R, Cormoreche E, Guinet P, Odru R, Vacher J. Barium Fluoride inorganic scintillator for subnanosecond timing. Nucl. Instr. & Meth. in Phys. Res. 1983;206(1-2):169–176. [Google Scholar]
- [6].Moses WW, Derenzo SE. Prospects for time-of-flight PET using LSO scintillator. IEEE Trans. Nucl. Sci. 1999;46(3):474–478. [Google Scholar]
- [7].Moszynski M, Kapusta M, Nassalski A, Szczesniak T, Wolski D, Eriksson L, Melcher CL. New prospects for time-of-flight PET with LSO scintillators. IEEE Trans. Nucl. Sci. 2006;53(5):2484–2488. [Google Scholar]
- [8].Surti S, Karp JS, Muehllehner G, Raby PS. Investigation of lanthanum scintillators for 3-D PET. IEEE Trans. Nucl. Sci. 2003;50(3):348–354. [Google Scholar]
- [9].Kuhn A, Surti S, Karp JS, Raby PS, Shah KS, Perkins AE, Muehllehner G. Design of a lanthanum bromide detector for time-of-flight PET. IEEE Trans. Nucl. Sci. 2004;51(5):2550–2557. [Google Scholar]
- [10].Harrison RL, Gillispie SB, Alessio AM, Kinahan PE, Lewellen TK. The effects of object size, attenuation, scatter, and random coincidences on signal to noise ratio in simulations of time-of-flight positron emission tomography; 2005 IEEE Nuclear Science Symposium and Medical Imaging Conference. Conference Record, CDROM, M04-4; San Juan, Puerto Rico. 2005. [Google Scholar]
- [11].Surti S, Karp JS, Popescu LM, Daube-Witherspoon ME, Werner M. Investigation of time-of-flight benefit for fully 3-D PET. IEEE Trans. Med. Imaging. 2006;25(5):529–538. doi: 10.1109/TMI.2006.871419. [DOI] [PubMed] [Google Scholar]
- [12].Conti M, Bendriem B, Casey M, Chen M, Kehren F, Michel C, Panin V. First experimental results of time-of-flight reconstruction on an LSO PET scanner. Phys. Med. Biol. 2005;50(19):4507–4526. doi: 10.1088/0031-9155/50/19/006. [DOI] [PubMed] [Google Scholar]
- [13].Watson CC. Image noise variance in 3D OSEM reconstruction of clinical time-of-flight PET; 2006 IEEE Nuclear Science Symposium and Medical Imaging Conference. Conference Record, CDROM, M04-5; San Diego, CA. 2006. [Google Scholar]
- [14].Muzic RF, Kolthammer JA. PET performance of the GEMINI TF: a time-of-flight PET/CT scanner; 2006 IEEE Nuclear Science Symposium and Medical Imaging Conference. Conference Record, CDROM, M06-152; San Diego, CA. 2006. [Google Scholar]
- [15].Surti S, Kuhn A, Werner ME, Perkins AE, Kolthammer J, Karp JS. Performance of Philips Gemini TF PET/CT scanner with special consideration for its time-of-flight imaging capabilities. J. Nucl. Med. 2007;48(3):471–480. [PubMed] [Google Scholar]
- [16].Karp JS, Surti S, Daube-Witherspoon ME, Muehllehner G. Benefit of time-of-flight in PET: Experimental and clinical results. J. Nucl. Med. 2008;49(3):462–470. doi: 10.2967/jnumed.107.044834. [DOI] [PMC free article] [PubMed] [Google Scholar]
- [17].Tomitani T. Image reconstruction and noise evaluation in photon time-of-flight assisted positron emission tomography. IEEE Trans. Nucl. Sci. 1981;28:4582–4589. [Google Scholar]
- [18].Snyder DL, Thomas LJ, Jr., Ter-Pogossian MM. A mathematical model for positron emission tomography systems having time-of-flight measurements. IEEE Trans. Nucl. Sci. 1981;28(3):3575–3583. [Google Scholar]
- [19].Snyder DL, Politte DG. Image reconstruction from list-mode data in an emission tomography system having time-of-flight measurements. IEEE Trans. Nucl. Sci. 1983;30(3):1843–1849. [Google Scholar]
- [20].Parra L, Barrett HH. List-mode likelihood: EM algorithm and image quality estimation demonstrated on 2-D PET. IEEE Trans. Med. Imaging. 1998;17(2):228–235. doi: 10.1109/42.700734. [DOI] [PMC free article] [PubMed] [Google Scholar]
- [21].Reader AJ, Erlandsson K, Flower MA, Ott RJ. Fast accurate iterative reconstruction for low-statistics positron volume imaging. Phys. Med. Biol. 1998;43(4):835–846. doi: 10.1088/0031-9155/43/4/012. [DOI] [PubMed] [Google Scholar]
- [22].Groiselle CJ, Glick SJ. 3D PET list-mode iterative reconstruction using time-of-flight information; 2004 IEEE Nuclear Science Symposium and Medical Imaging Conference. Conference Record, CDROM M2-305; Rome, Italy. 2004. [Google Scholar]
- [23].Popescu LM, Matej S, Lewitt RM. Iterative image reconstruction using geometrically ordered subsets with list-mode data; 2004 IEEE Nuclear Science Symposium and Medical Imaging Conference. Conference Record, CDROM, M9-211; Rome, Italy. 2004.pp. 3536–3540. [Google Scholar]
- [24].Carson RE, Barker WC, Liow J, Johnson CA. Design of a motion-compensation OSEM list-mode algorithm for resolution-recovery reconstruction for the HRRT; 2003 IEEE Nuclear Science Symposium and Medical Imaging Conference. Conference Record, CDROM, M16-6; Portland, OR. 2003. [Google Scholar]
- [25].Rodriguez M, Barker WC, Thada S, Liow J-S, Iano-Fletcher A, Johnson CA, Carson RE. Characteristics of list-mode reconstruction for the HRRT. J. Nucl. Med. 2005;46:56P. [Google Scholar]
- [26].Qi J. Calculation of the sensitivity image in list-mode reconstruction. IEEE Trans. Nucl. Sci. 2006;53(5):2746–2751. [Google Scholar]
- [27].Qi J, Huesman RH. Propagation of errors from the sensitivity image in list mode reconstruction. IEEE Trans. Med. Imaging. 2004;23(9):1094–1099. doi: 10.1109/TMI.2004.829333. [DOI] [PubMed] [Google Scholar]
- [28].Matej S, Jayanthi S, Surti S, Daube-Witherspoon ME, Muehllehner G, Karp JS. Efficient 3D TOF PET reconstruction using view-grouped histo-images: DIRECT - Direct Image Reconstruction for TOF; 2006 IEEE Nuclear Science Symposium and Medical Imaging Conference. Conference Record, CDROM, M04-4; San Diego, CA. 2006.pp. 1728–1735. [Google Scholar]
- [29].Politte DG, Hoffman GR, Beecher DE, Ficke DC, Holmes TJ, Ter-Pogosian MM. Image-reconstruction of data from super PETT I: A first-generation time-of-flight positron-emission tomograph (reconstruction from reduced-angle data) IEEE Trans. Nucl. Sci. 1986;33(1):428–434. [Google Scholar]
- [30].Vandenberghe S, Daube-Witherspoon ME, Lewitt RM, Karp JS. Fast reconstruction of 3D time-of-flight PET data by axial rebinning and transverse mashing. Phys. Med. Biol. 2006;51(6):1603–1621. doi: 10.1088/0031-9155/51/6/017. [DOI] [PubMed] [Google Scholar]
- [31].Jones WF, Breeding E, Conti M, Kehren F, Casey ME. Online time-of-flight mashing: the PDR card applied to a long-axis PET-TOF system for reduced transaxial angular sampling with 3-D nearest-neighbor projection-space rebinning in clinical PET/CT; 2006 IEEE Nuclear Science Symposium and Medical Imaging Conference. Conference Record, CDROM, M11-148; San Diego, CA. 2006. [Google Scholar]
- [32].Defrise M, Casey ME, Michel C, Conti M. Fourier rebinning of time-of-flight PET data. Phys. Med. Biol. 2005;50(12):2749–2763. doi: 10.1088/0031-9155/50/12/002. [DOI] [PubMed] [Google Scholar]
- [33].Chen C, Metz CE. A simplified EM reconstruction algorithm for TOFPET. IEEE Trans. Nucl. Sci. 1985;32(1):885–888. [Google Scholar]
- [34].Daube-Witherspoon ME, Muehllehner G. An iterative image space reconstruction algorithm suitable for volume ECT. IEEE Trans. Med. Imaging. 1986;5(2):61–66. doi: 10.1109/TMI.1986.4307748. [DOI] [PubMed] [Google Scholar]
- [35].Matej S, Browne JA. Performance of a fast maximum likelihood algorithm for fully 3D PET reconstruction. In: Grangeat P, Amans J-L, editors. Three-Dimensional Image Reconstruction in Radiology and Nuclear Medicine. Kluwer Academic Publishers; Dordrecht, The Netherlands: 1996. pp. 297–316. [Google Scholar]
- [36].Matej S, Lewitt RM. 3D-FRP: Direct Fourier reconstruction with Fourier reprojection for fully 3-D PET. IEEE Trans. Nucl. Sci. 2001;48(4):1378–1385. [Google Scholar]
- [37].Matej S, Fessler JA, Kazantsev IG. Iterative tomographic image reconstruction using Fourier-based forward and back-projectors. IEEE Trans. Med. Imaging. 2004;23(4):401–412. doi: 10.1109/TMI.2004.824233. [DOI] [PubMed] [Google Scholar]
- [38].Matej S, Kazantsev IG. Fourier-based reconstruction for fully 3-D PET: Optimization of interpolation parameters. IEEE Trans. Med. Imaging. 2006;25(7):845–854. doi: 10.1109/tmi.2006.873219. [DOI] [PubMed] [Google Scholar]
- [39].Vandenberghe S, Daube-Witherspoon ME, Matej S, Lewitt RM, Karp JS. Optimization of 3D TOF PET reconstruction using a limited number of 2D histoprojections; 2005 IEEE Nuclear Science Symposium and Medical Imaging Conference. Conference Record, CDROM, M03-133; San-Juan, Puerto Rico. 2005.pp. 1596–1600. [Google Scholar]
- [40].Kinahan PE, Rogers JG. Analytic 3D image reconstruction using all detected events. IEEE Trans. Nucl. Sci. 1989;36:964–968. [Google Scholar]
- [41].Bal G, Matej S, Lewitt RM. A fully 3D re-projection based reconstruction algorithm using time-of-flight PET for whole body imaging. J. Nucl. Med. 2006;47-Suppl:P389–390P. [Google Scholar]
- [42].De Pierro AR. On some nonlinear iterative relaxation methods in remote sensing. Matemática Aplicada e Computacional. 1989;8:153–166. [Google Scholar]
- [43].Browne JA, De Pierro AR. A row-action alternative to the EM algorithm for maximizing likelihoods in emission tomography. IEEE Trans. Med. Imaging. 1996;15(5):687–699. doi: 10.1109/42.538946. [DOI] [PubMed] [Google Scholar]
- [44].Lewitt RM. Multidimensional digital image representations using generalized Kaiser-Bessel window functions. J. Opt. Soc. Am. A. 1990;7(10):1834–1846. doi: 10.1364/josaa.7.001834. [DOI] [PubMed] [Google Scholar]
- [45].Sorensen TS, Schaeffter T, Noe KO, Hansen MS. Accelerating the nonequispaced fast Fourier transform on commodity graphics hardware. IEEE Trans. Med. Imaging. 2008;27(4):538–547. doi: 10.1109/TMI.2007.909834. [DOI] [PubMed] [Google Scholar]
- [46].Qi J, Leahy RM, Hsu C, Farquhar TH, Cherry SR. Fully 3D Bayesian image reconstruction for the ECAT EXACT HR+ IEEE Trans. Nucl. Sci. 1998;45:1096–1103. [Google Scholar]
- [47].Leahy RM, Qi J. Statistical approaches in quantitative positron emission tomography. Statistics and Computing. 2000;10(2):147–165. [Google Scholar]
- [48].Mumcuoglu EU, Leahy RM, Cherry SR, Hoffman E. Accurate geometric and physical response modeling for statistical image reconstruction in high resolution PET; 1996 IEEE Nuclear Science Symposium and Medical Imaging Conference; Anaheim, CA. 1996.pp. 1569–1573. [Google Scholar]
- [49].Rafecas M, Mosler B, Dietz M, Pogl M, Stamatakis A, McElroy DP, Ziegler SI. Use of a Monte Carlo-based probability matrix for 3-D iterative reconstruction of MADPET-II data. IEEE Trans. Nucl. Sci. 2004;51(5):2597–2605. [Google Scholar]
- [50].Alessio AM, Kinahan PE, Lewellen TK. Modeling and incorporation of system response functions in 3-D whole body PET. IEEE Trans. Med. Imaging. 2006;25(7):828–837. doi: 10.1109/tmi.2006.873222. [DOI] [PubMed] [Google Scholar]
- [51].Panin VY, Kehren F, Michel C, Casey M. Fully 3-D PET reconstruction with system matrix derived from point source measurements. IEEE Trans. Med. Imaging. 2006;25(7):907–921. doi: 10.1109/tmi.2006.876171. [DOI] [PubMed] [Google Scholar]
- [52].Wang W, Hu Z, Gualtieri EE, Parma MJ, Walsh ES, Sebok D, Hsieh Y, Tung C, Song X, Griesmer JJ, Kolthammer JA, Popescu LM, Werner ME, Karp JS, Gagnon D. Systematic and distributed time-of-flight list mode PET reconstruction; 2006 IEEE Nuclear Science Symposium and Medical Imaging Conference. Conference Record, CDROM, M04-2; San Diego, CA. 2006. [Google Scholar]
- [53].Hu Z, Wang W, Gualtieri EE, Hsieh YL, Karp JS, Matej S, Parma MJ, Tung CH, Walsh ES, Werner M, Gagnon D. An LOR-based systematic and fully-3D PET image reconstruction using a blob-basis function; 2007 IEEE Nuclear Science Symposium and Medical Imaging Conference; Honolulu, Hawaii. Oct. 28 - Nov. 3, 2007. [Google Scholar]
- [54].Sureau FC, Reader AJ, Comtat C, Leroy C, Ribeiro MJ, Buvat I, Trebossen R. Impact of image-space resolution modeling for studies with the high-resolution research tomograph. J. Nucl. Med. 2008;49(6):1000–1008. doi: 10.2967/jnumed.107.045351. [DOI] [PubMed] [Google Scholar]
- [55].Tanaka E, Nohara N, Tomitani T, Endo M. Analytical study of the performance of a multilayer positron computed tomography scanner. J. Comput. Assist. Tomo. 1982;6(2):350–364. doi: 10.1097/00004728-198204000-00021. [DOI] [PubMed] [Google Scholar]
- [56].Bendriem B, Soussaline F, Campagnolo R, Verrey B, Wajnberg P, Syrota A. A technique for the correction of scattered radiation in a PET system using time-of-flight information. J. Comput. Assist. Tomo. 1986;10(2):287–295. doi: 10.1097/00004728-198603000-00021. [DOI] [PubMed] [Google Scholar]
- [57].Ollinger JM. Model-based scatter correction for fully 3D PET. Phys. Med. Biol. 1996;41(1):153–176. doi: 10.1088/0031-9155/41/1/012. [DOI] [PubMed] [Google Scholar]
- [58].Watson CC, Newport D, Casey ME. A single scatter simulation technique for scatter correction in 3D PET. In: Grangeat P, Amans J-L, editors. Three-Dimensional Image Reconstruction in Radiology and Nuclear Medicine. Kluwer Academic Publishers; Dordrecht, The Netherlands: 1996. pp. 255–268. [Google Scholar]
- [59].Accorsi R, Adam LE, Werner ME, Karp JS. Optimization of a fully 3D single scatter simulation algorithm for 3D PET. Phys. Med. Biol. 2004;49(12):2577–2598. doi: 10.1088/0031-9155/49/12/008. [DOI] [PubMed] [Google Scholar]
- [60].Werner M, Surti S, Karp JS. Implementation and evaluation of a 3D PET single scatter simulation with TOF modeling; 2006 IEEE Nuclear Science Symposium and Medical Imaging Conference. Conference Record, CDROM, M05-3; San Diego, CA. 2006. [Google Scholar]
- [61].Watson CC. Extension of single scatter simulation to scatter correction of time-of-flight PET. IEEE Trans. Nucl. Sci. 2007;54(5):1679–1686. [Google Scholar]
- [62].Adam L-E, Karp JS, Brix G. Investigation of scattered radiation in 3D whole-body Positron Emission Tomography using Monte-Carlo simulations. Phys. Med. Biol. 1999;44:2879–2895. doi: 10.1088/0031-9155/44/12/302. [DOI] [PubMed] [Google Scholar]
- [63].Karp JS, Kuhn A, Perkins AE, Surti S, Werner M, Daube-Witherspoon ME, Popescu LM, Vandenberghe S, Muehllehner G. Characterization of a time-of-flight PET scanner based on Lanthanum Bromide; 2005 IEEE Nuclear Science Symposium and Medical Imaging Conference. Conference Record, CDROM, M04-8; San-Juan, Puerto Rico. 2005.pp. 1914–1918. [Google Scholar]
- [64].Kyba CCM, Wiener RI, Newcomer FM, Van Berg R, Dressnandt N, Karp JS. Timing measurements from TOF-PET scanner using local PMT triggering; 2007 IEEE Nuclear Science Symposium and Medical Imaging Conference. Conference Record; Honololu, Hawaii. 2007. [Google Scholar]


