

Abstract
The generation time of HIV Type 1 (HIV-1) in vivo has previously been estimated using a mathematical model of viral dynamics and was found to be on the order of one to two days per generation. Here, we describe a new method based on coalescence theory that allows the estimate of generation times to be derived by using nucleotide sequence data and a reconstructed genealogy of sequences obtained over time. The method is applied to sequences obtained from a long-term nonprogressing individual at five sampling occasions. The estimate of viral generation time using the coalescent method is 1.2 days per generation and is close to that obtained by mathematical modeling (1.8 days per generation), thus strengthening confidence in estimates of a short viral generation time. Apart from the estimation of relevant parameters relating to viral dynamics, coalescent modeling also allows us to simulate the evolutionary behavior of samples of sequences obtained over time.
The integration of mathematical modeling and experimental approaches has led to a deeper understanding of HIV-1 viral dynamics in vivo. In particular, these studies suggest that the viral population in the peripheral blood (and the secondary lymphatics) turns over rapidly, with generation times estimated to be on the order of one to two days on average (ref. 1; A. Perelson, personal communication). However, because these studies are based on abstract and simple models of a complex biological system, it is not obvious how accurate these estimates are. One way to address this is to try to estimate the same parameters by using different methods and different types of data.
Here, we apply a new method developed by Rodrigo and Felsenstein (2) which is based on a mathematical construct introduced by Kingman (3, 4) called the n-coalescent (or coalescent for short). The coalescent relies on the fundamental notion that all individuals in a population have a genealogy, so that if we begin with a sample of n individuals, each drawn randomly from a population, and we reconstruct the genealogy of these n individuals, we will begin to see lineages coalescing as we move further back in time. Each coalescent event represents the split of two lineages from a common ancestor. Obviously, if we go back far enough, we arrive at a point where all lineages have coalesced, and this point represents the most recent common ancestor of all sequences in the sample. The mathematics of coalescent theory gives us the distribution of times, measured as the number of generations, between coalescent events, as one moves back in time along the genealogy. The distribution of times itself is contingent on the dynamics of the population in question. For instance, the expected coalescence time of two individuals drawn at random, each from a compartment of a subdivided population, depends on the rate of migration between the compartments. Similarly, two individuals drawn from a growing population will have a different expected time to coalescence than two individuals drawn from a population at equilibrium (5). In fact, any population process that affects the relatedness of randomly sampled individuals will also affect the distribution of coalescent times in predictable ways, so that it becomes possible to infer the magnitude of these processes by simple models that relate population dynamics to genealogy.
One of the major problems facing HIV molecular evolutionary biologists is sampling: with 1010 virions produced daily in an infected individual, and 106–107 infected cells present, it still remains logistically infeasible to sample any more than tens or hundreds of HIV sequences per individual. How, then, can inferences be made about the evolutionary processes that modulate the genetic variation of viral populations? Fortunately, this is precisely what the coalescent allows us to do, that is, make inferences about population processes based on the genealogy of a small sample of sequences drawn from a much larger population.
Recently, Rodrigo and Felsenstein (2) extended the coalescent framework to handle the genealogy of samples of sequences drawn serially in time. Among other things, they showed that the added information afforded by serial samples allows us to estimate the average length of time of each generation. It is informative to compare estimates of generation time obtained by using the coalescent to that derived by using mathematical models of viral population dynamics. If these estimates are similar, they serve to strengthen our confidence in both the estimates and the methods themselves.
In this study, we use the coalescent method to estimate the expected generation time of the HIV-1 population in an infected individual who remained asymptomatic over the 4 years when samples were taken. Our estimated expected generation time is consistent with values obtained by Perelson et al. (1) using a mathematical model of viral dynamics, thus offering independent support for a rapid turnover of the viral population.
Theory.
The following is a description of the coalescent and the method proposed by Rodrigo and Felsenstein (2). If a nonrecombining DNA sequence is obtained from each of two haploid individuals drawn at random from a population of constant size N, where each member of the population has an equal propensity to reproduce, the probability that the two sequences do not share a common ancestor in the previous generation is
 |
1 |
If n individuals are sampled, the probability that there are no shared ancestors in the previous generation, P(t=1) or P(1) for convenience, is
 |
2 |
Assuming n ≪ N, and N is large, and ignoring all terms of order 1/N2 or smaller, Eq. 2 is approximated by
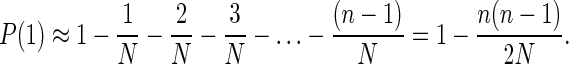 |
3 |
The probability that the first coalescent event occurs in generation t some time in the past is the probability that no coalescent events occur from generation 1 to t − 1 and that one coalescent event occurs in generation t, that is:
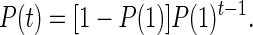 |
4 |
Eq. 4 is the density function of a geometric distribution. For continuous-valued generation times, the exponential distribution can be used as an approximation, so that Eq. 4 can be reexpressed as
 |
 |
5 |
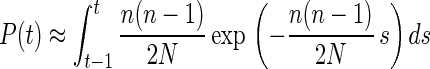
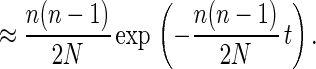
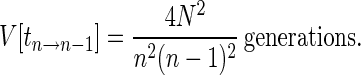
The expected time for the first coalescent event, i.e., the time taken for n lineages to coalesce to n − 1 lineages, is
 |
6 |
with variance
 |
7 |
The expected number of generations required to move from n to l lineages can be obtained by summing
 |
This is
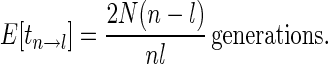 |
8 |
Since (n − l) = c is the number of coalescent events that have already occurred, Eq. 8 can be rewritten
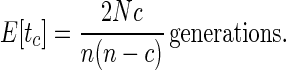 |
8a |
Eqs. 1–8 are part of the basic theory of the coalescent (3, 4). To obtain the genealogy of n individuals, one typically reconstructs the phylogeny of gene sequences obtained from each of the individuals in the sample, or if two or more samples are available, the joint phylogeny of all sequences.
Generation time, i.e., the average time taken for a viral genome (or infected cell) to produce another of its kind in a replication cycle, can be estimated if the number of generations that has elapsed between two samples collected serially is known. A joint phylogeny of the sequences collected from all serial samples allows us to estimate this. To illustrate, consider Fig. 1, in which the joint phylogeny is shown for two sets of HIV DNA partial envelope (env) nucleotide sequences obtained from peripheral blood mononuclear cells in blood drawn from the same individual 214 days apart. Sequences from the later sample (indicated by ▴) are typically more closely related to sequences from the same sample. Eleven coalescent events have occurred between lineages associated with the later sample over the 214-day period, with only 4 lineages remaining when sequences from the earlier sample appear on the joint phylogeny. The number of days per generation, τ, can be estimated as
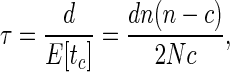 |
9 |
where d is the number of chronological units (in this case, days) between samples and N is the effective size of the viral population. For the example above, this gives us an estimate of 584.7/N.
Figure 1.

The genealogy of partial HIV env sequences obtained from sample 1 (○) and a later sample 2 (▴). Sequences from the later sample cluster together more than one would expect by chance alone, and 11 of the 14 possible coalescent events occur between lineages that exclusively include sequences from the later time point only. ∗ marks the nodes where sequences from different time points share close common ancestors.
The method outlined above makes the following assumptions: (i) the population from which the samples are drawn remains at equilibrium, i.e., N remains constant, (ii) our phylogeny is a good representation of the true genealogy of the sampled individuals, and (iii) each individual has the same potential to produce offspring. The second of these assumptions implicitly presupposes that the processes of recombination, migration, and selection do not interfere with our ability to correctly reconstruct the genealogy of the samples.
METHODS
All samples were obtained from a homosexual Caucasian male who was diagnosed as HIV-1 seropositive following an episode of aseptic meningitis in February of 1985, when he was 23 years old. Two previous reports on the clinical course of this patient have been published (patient 2 in ref. 6 and patient 1 in ref. 7). Over the course of 3 years beginning in 1989, blood was obtained at time points 7, 22, 23, and 34 months after the first specimen (obtained in April 1989, and reported in ref. 8). He started treatment with zidovudine at month 13 and continued this until after the period reported here (month 34). The CD4+ cell count during the period of study has ranged between 264 and 467 per μl.
Between 8 and 15 HIV DNA sequences of a 0.65-kb region of the env gene spanning the third to fifth variable regions were obtained from each of 5 peripheral blood mononuclear cell specimens using standard techniques (8). Nucleotide sequences (GenBank accession nos. U00804–U00822, U00831–U00850, and U00873–U00888) were aligned by using the Multiple Alignment Sequence Editor, mase (9). The evolutionary distances between pairs of sequences were estimated by using the general maximum-likelihood method (10) with γ-distributed substitution rates across sites (γ parameter α = 0.5) implemented in the computer program paup* (D. Swofford, Smithsonian Institution). A phylogenetic tree (Fig. 2) was constructed by using the neighbor-joining method (11) with the estimated evolutionary distance matrix. The reference sequence HIVRF (GenBank accession no. M17451) was used to root the neighbor-joining tree.
Figure 2.

Joint phylogeny of sequences obtained from all five samples. See text for details on phylogenetic tree reconstruction. The tree was rooted using the reference sequence HIVRF (data not shown).
To validate the assumption that there is no detectable selection acting on the molecular evolution of HIV env sequences in this individual, the proportion of nonsynonymous (dn) and synonymous substitutions (ds) per potential nonsynonymous and synonymous site were calculated for sequences obtained from each time point by using mega Ver. 1.02 [Molecular Evolutionary Genetic Analysis (12)]. Only sequences that were nonidentical over the entire length were used in these analyses. A Jukes–Cantor correction for multiple substitutions was applied (13). The standard errors of ds and dn were calculated by using the method described by Nei and Gojobori (14) and implemented in mega Ver. 1.02. Student’s t-tests for statistical differences between dn and ds from each sample failed to detect any evidence that the proportion of nonsynonymous substitutions was different from the proportion of synonymous substitutions. We assume, therefore, that even if selection is acting over the region of the envelope sampled, its effects are not likely to be strong enough to distort our phylogeny (below, we discuss in more detail how selection can influence our estimates). We also visually examined the multiple sequence alignment for patterns of recombination and found none.
Generation times were estimated by counting the number of coalescent events that occurred in the genealogy of sequences from a later sample when compared with an earlier sample (for every possible pair of samples). However, because the estimated phylogenetic tree alone does not take into account the uncertainty that is inherent in phylogenetic reconstruction, 100 replicate trees were generated by bootstrap-resampling the nucleotide sequence data (15). For each replicate tree, all sequences not associated with the pair of samples under consideration were pruned from the joint phylogeny. The generation time was estimated as
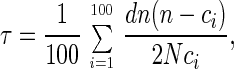 |
10 |
which is simply the average value of Eq. 9 over all bootstrap replicates. As is typical with population genetic methods, the effective population size, N, is estimated as part of the composite parameter Θ = 2Nμ, where μ is the mutation rate (note: Θ is a fundamental population genetics parameter and may be loosely characterized as a measure of genetic diversity). Θ was estimated for each sample of sequences by using the coalescent-likelihood estimation program fluctuate (16). The results are shown in Table 1. To obtain N, Θ was divided by 2μ, where μ = 4 × 10⁻⁵ mutations per site per generation (17). The average effective population size was thus estimated as n = 1,260 ± 136. This value is of the same order of magnitude as those obtained recently by Leigh Brown (18), and the relatively constant value of N (Table 1) supports our first assumption that the population size remains in equilibrium over the course of the study.
Table 1.
Summary statistics for each sequence sample set
| Sample | Days from first sample | No. of sequences | Average pairwise diversity, % | θ | N |
|---|---|---|---|---|---|
| 1 | 0 | 13 | 3.6 | 0.088 | 1100 |
| 2 | 214 | 15 | 3.9 | 0.106 | 1325 |
| 3 | 671 | 15 | 5.0 | 0.074 | 925 |
| 4 | 699 | 9 | 4.2 | 0.144 | 1800 |
| 5 | 1005 | 8 | 4.1 | 0.092 | 1150 |
Average pairwise diversity was estimated by calculating Felsenstein-81 maximum-likelihood evolutionary distances (36) between every possible pair of sequences and averaging these. Effective population size, N, was estimated by dividing θ by 2μ where μ = 4 × 10⁻⁵ mutations per site per generation.
RESULTS AND DISCUSSION
The joint phylogenetic tree of HIV partial env sequences obtained from five sampling occasions is shown in Fig. 2. There is some temporal structure to the tree, evidenced by the clustering of sequences from single time points into related groups, e.g., the majority of sequences from sample 5 cluster as a single clade, and sequences from sample 3 cluster as two closely related clades. Nonetheless, viruses from a given time point do not necessarily cluster together but may be related to viruses from earlier time points.
In Table 2, we show the average number of lineages (taken over all bootstrap replicates) of the genealogy of a later sample that intermingle with those of an earlier sample, for all possible pairs of samples. The average estimates of generation time are in bold, and the estimated number of generations that have elapsed are in parentheses. The overall mean generation time is 1.2 days per generation (median = 1.1 days per generation; interquartile range: 0.7–2 days per generation). By using average values of infected-cell clearance rate (i.e., δ = 0.7 d−1; ref. 19) and viral clearance rate (c = 3 d−1; ref. 1), one finds that the average viral generation is 1.8 days (A. Perelson, personal communication), which is close to the estimate obtained here. It is encouraging that two independent methods, each using very different data, should arrive at similar estimates of viral generation times on the order of one to two days. As noted earlier, corroboration from different sources strengthens our confidence that the estimate of generation times is correct.
Table 2.
Coalescence data
| Sample | Sample
|
|||
|---|---|---|---|---|
| 1 | 2 | 3 | 4 | |
| 2 | 5.2 (295) 0.73 | |||
| 3 | 2.0 (1038) 0.65 | 3.1 (620) 0.74 | ||
| 4 | 2.7 (596) 1.17 | 3.5 (414) 1.17 | 5.5 (175) 0.16 | |
| 5 | 3.7 (337) 2.97 | 4.1 (384) 2.78 | 3.9 (289) 1.15 | 3.7 (306) 1.00 |
Average number of lineages that have yet to coalesce, estimated number of generations, and average estimated generation times based on comparisons between all possible pairs of sequence sets over 100 bootstrap replicate trees. Values are the number of lineages of the later sample (designated by the row label) that remain as one moves back in time to when the earlier sample (designated by the column label) was obtained. Values in parentheses indicate the estimated number of generations (calculated by dividing the number of days between each pair of samples and the average generation time for that pair). Values in bold are the estimated number of days per generation, calculated using Eq. 10.
The coalescent method we use here is one of a number of molecular evolutionary techniques that are available (or are becoming available) to phylogeneticists and molecular evolutionary biologists. Kelly (37), for instance, developed a population genetic method for estimating the synonymous mutation rate and the number of generations per unit time of an HIV population in vivo. Kelly’s method requires that the progenitor sequence be known; the coalescent method developed here does not have this requirement, and may therefore be more widely applicable. Coalescent models also allow us to simulate the genealogy of samples of sequences under a variety of conditions, including changes in effective viral population size (16, 20), compartmentalization (21–23), recombination (24–27), and selection (28–30). These approaches are reviewed in Rodrigo and Felsenstein (2). The extension of these models to incorporate serial samples is a continuing effort (31), and is particularly pertinent for HIV research because it is not unusual to obtain several samples of sequences from HIV-infected individuals over the course of infection.
Under the simplest population model, i.e., one with no change in population size, and without recombination, selection, or migration, the analysis above indicates that the number of coalescent events that occur with sequences from a later sample is a function of the time interval separating the two samples. If this interval, measured in terms of the number of generations that have elapsed, is small, then only a few coalescent events, if any, will have occurred before sequences from the earlier sample are introduced into the joint phylogeny. If, on the other hand, the sampling interval is long, then most of the coalescent events would have occurred, so that sequences from each time point would cluster discretely on the joint phylogeny. It is tempting to attribute differences in phylogenetic patterns, i.e., discrete clusters of sequences from different time points versus intermingling of sequences, to differences in the biology of the virus, the host, or both. Explanations for such patterns typically invoke selection and adaptive evolution (32). Although these hypotheses may be true, it is probably fruitful in the first instance to consider the most parsimonious explanation for such patterns, i.e., that they may arise as a simple consequence of the separation of samples in time.
It is instructive to examine how many coalescent events occur in the genealogy of a sample of sequences in the interval of time separating two sampling occasions. If we assume, for instance, that the later sample has 20 sequences, the expected number of generations it takes for half the number of coalescent events in the genealogy of that sample to occur can be estimated by substituting l = (n − 1)/2 in Eq. 8 to obtain 0.22N generations. If n = 1,000, this translates into 220 generations, or 264 days, assuming a generation time of 1.2 days per generation. However, on average, the final coalescent event does not occur until approximately 2N generations have elapsed (we can obtain this result by letting l = 1 and substituting this into Eq. 8). If there are approximately 300 generations per year, as our results suggest, the expected sampling interval required to see two sets of sequences completely separated on a phylogenetic tree is 2N; with n = 1,000, this corresponds to just under 7 years. Therefore, although we may expect to see significant degrees of clustering with sampling intervals as short as 8 to 9 months, there is likely to be intermingling of at least some lineages for up to 6 years and beyond. Once again, explanations for such long-lived lineages include hypotheses of “hidden” compartments of virus that subsequently reseed the peripheral blood and infected-cell latency. These hypotheses should be considered in parallel with simple genealogical models of viral population dynamics described here, possibly using the latter as null hypotheses in appropriately constructed statistical analyses.
At this point, we revisit the issue of selection and how this may affect our estimate of generation time. Incorporating selection into the coalescent framework has been a long-standing problem. Neuhauser and Krone (28, 29) have recently described an approach that allows selection to be incorporated into genealogical models. They show that under very weak selection or very strong selection, the coalescent can still reliably describe the genealogy of a sample of sequences (the latter because fixation occurs so rapidly that after a few generations, all variants in the population are equally fit). Preliminary results by Golding (33) also appear to indicate that genealogies are resilient to relatively strong purifying selection. Although the selective forces on the HIV population in vivo are likely to vary from individual to individual and from one stage of disease to another, these results offer some circumstantial evidence that coalescent approaches may be reasonably robust in the face of selection.
In this paper, we have tried to address the issue of whether the sequences we have sampled are under any selective pressure by comparing the proportions of nonsynonymous and synonymous substitutions in env. This is, perhaps, a less than satisfactory approach: even if dn equals ds, it does not necessarily imply the absence of selection, because these values are composite quantities averaged over all sites and thus fail to take account of selective effects at individual positions. If, as has been suggested by many researchers, there is positive selection for env to diversify and evade the host’s own immune defenses, then we envisage several possibilities. First, selection may be weakly positive so that the probability of fixation of advantageous variants is not substantially greater than what is expected by genetic drift. If this were true, then the methods we have applied, and indeed the coalescent approach in general, will work, because under such weak selection, env evolution would be effectively neutral. However, most researchers would argue in support of a stronger selective effect. Possibly, positive selection results in differential reproductive potential, so that the variance of burst-sizes is greater than expected under a Poisson birth–death process. This would result in an effective population size that is smaller than the census population size (34, 35), and indeed with HIV this appears to be the case (18). However, because our estimate of generation time is a function of the estimated effective population size, it implicitly takes this type of selective effect into account.
Types of selective processes likely to affect our coalescent estimate of generation time include selective sweeps that occur periodically, or strongly positive selection, possibly at only a few sites. Under these conditions, it is conceivable that coalescent-based approaches will not apply, and our estimate of HIV-1 generation time will be correct by coincidence alone. Nonetheless, in the absence of any evidence that this is indeed the case, it is premature to discount our estimate and the applicability of the method.
The issue of selection is part of a broader problem, of course: that of the utility of simple models with assumptions that are almost certainly never satisfied. Indeed, mathematical models of HIV-1 viral dynamics in vivo have their own set of simplifying assumptions. Nonetheless, construction of the first, simple model that serves as the framework for later theoretical work is, arguably, the most difficult part of the process leading up to the development of more realistic models. Here, we have attempted to define such a framework, one based on an extension of the coalescent that will allow estimates of population parameters to be made on the basis of serially sampled sequence genealogies. Coalescent models are likely to enhance the inferential repertoire of HIV researchers, because the very process of mutation that makes the virus difficult to control also provides an alternative way to explore the dynamics of the virus in its own microcosm.
Acknowledgments
The authors thank Dr. Joe Felsenstein, whose involvement in initial discussions on the problem of longitudinal samples and the coalescent was invaluable, Drs. Jerry Learn and Yang Wang for comments on the manuscript, and Amy Berson and Richard Oh for technical support. The comments of two anonymous reviewers contributed significantly to the final version of this manuscript. This research was supported by grants from the U. S. Public Health Service.
Footnotes
References
- 1.Perelson A S, Neumann A U, Markowitz M, Leonard J M, Ho D D. Science. 1996;271:1582–1586. doi: 10.1126/science.271.5255.1582. [DOI] [PubMed] [Google Scholar]
- 2.Rodrigo A G, Felsenstein J. In: Coalescent Approaches to HIV Population Genetics. Crandall K, editor. Baltimore: Johns Hopkins Univ. Press; 1999. [Google Scholar]
- 3.Kingman J F C. J Appl Probability. 1982;19A:27–43. [Google Scholar]
- 4.Kingman J F C. Stochastic Processes Appl. 1982;13:235–248. [Google Scholar]
- 5.Slatkin M, Hudson R R. Genetics. 1991;129:555–562. doi: 10.1093/genetics/129.2.555. [DOI] [PMC free article] [PubMed] [Google Scholar]
- 6.Ho D D, Rota T R, Schooley R T, Kaplan J C, Allan J D, Groopman J E, Resnick L, Felsenstein D, Andrews C A, Hirsch M S. N Engl J Med. 1985;313:1493–1497. doi: 10.1056/NEJM198512123132401. [DOI] [PubMed] [Google Scholar]
- 7.Ho D D, Sarngadharan M G, Resnick L, Dimarzoveronese F, Rota T R, Hirsch M S. Ann Intern Med. 1985;103:880–883. doi: 10.7326/0003-4819-103-6-880. [DOI] [PubMed] [Google Scholar]
- 8.Kusumi K, Conway B, Cunningham S, Berson A, Evans C, Iversen A K N, Colvin D, Gallo M V, Coutre S, Shpaer E G, et al. J Virol. 1992;66:875–885. doi: 10.1128/jvi.66.2.875-885.1992. [DOI] [PMC free article] [PubMed] [Google Scholar]
- 9.Faulkner D V, Jurka J. Trends Biochem Sci. 1988;13:321–322. doi: 10.1016/0968-0004(88)90129-6. [DOI] [PubMed] [Google Scholar]
- 10.Kishino H, Hasegawa M. J Mol Evol. 1989;29:170–179. doi: 10.1007/BF02100115. [DOI] [PubMed] [Google Scholar]
- 11.Saitou N, Nei M. Mol Biol Evol. 1987;4:406–425. doi: 10.1093/oxfordjournals.molbev.a040454. [DOI] [PubMed] [Google Scholar]
- 12.Kumar S, Tamura K, Nei M. Comput Appl Biosci. 1994;10:189–191. doi: 10.1093/bioinformatics/10.2.189. [DOI] [PubMed] [Google Scholar]
- 13.Jukes T H, Cantor C R. In: Evolution of Protein Molecules. Munro H N, editor. New York: Academic; 1969. pp. 21–132. [Google Scholar]
- 14.Nei M, Gojobori T. Mol Biol Evol. 1986;3:418–426. doi: 10.1093/oxfordjournals.molbev.a040410. [DOI] [PubMed] [Google Scholar]
- 15.Felsenstein J. Evolution. 1985;39:783–791. doi: 10.1111/j.1558-5646.1985.tb00420.x. [DOI] [PubMed] [Google Scholar]
- 16.Kuhner M K, Yamato J, Felsenstein J. Genetics. 1998;149:429–434. doi: 10.1093/genetics/149.1.429. [DOI] [PMC free article] [PubMed] [Google Scholar]
- 17.Mansky L M. AIDS Res Hum Retroviruses. 1996;12:307–314. doi: 10.1089/aid.1996.12.307. [DOI] [PubMed] [Google Scholar]
- 18.Leigh Brown A J. Proc Natl Acad Sci USA. 1997;94:1862–1865. doi: 10.1073/pnas.94.5.1862. [DOI] [PMC free article] [PubMed] [Google Scholar]
- 19.Perelson A S, Essunger P, Cao Y, Vesanen M, Hurley A, Saksela K, Markowitz M, Ho D D. Nature (London) 1997;387:188–191. doi: 10.1038/387188a0. [DOI] [PubMed] [Google Scholar]
- 20.Griffiths R C, Tavare S. Phil Trans R Soc Lond B. 1994;344:403–410. doi: 10.1098/rstb.1994.0079. [DOI] [PubMed] [Google Scholar]
- 21.Slatkin M, Maddison W P. Genetics. 1989;123:603–613. doi: 10.1093/genetics/123.3.603. [DOI] [PMC free article] [PubMed] [Google Scholar]
- 22.Slatkin M, Maddison W P. Genetics. 1990;126:249–260. doi: 10.1093/genetics/126.1.249. [DOI] [PMC free article] [PubMed] [Google Scholar]
- 23.Beerli, P. & Felsenstein, J. (1999) Genetics, in press. [DOI] [PMC free article] [PubMed]
- 24.Griffiths R C, Marjoram P. J Computat Biol. 1996;3:479–502. doi: 10.1089/cmb.1996.3.479. [DOI] [PubMed] [Google Scholar]
- 25.Hudson R R, Kaplan N L. Genetics. 1985;111:147–164. doi: 10.1093/genetics/111.1.147. [DOI] [PMC free article] [PubMed] [Google Scholar]
- 26.Hudson R R. Genet Res. 1987;50:245–250. doi: 10.1017/s0016672300023776. [DOI] [PubMed] [Google Scholar]
- 27.Hudson R R, Kaplan N L. Genetics. 1988;120:831–840. doi: 10.1093/genetics/120.3.831. [DOI] [PMC free article] [PubMed] [Google Scholar]
- 28.Krone, S. M. & Neuhauser, C. (1997) Theoret. Popul. Biol.51. [DOI] [PubMed]
- 29.Neuhauser C, Krone S M. Genetics. 1997;145:519–534. doi: 10.1093/genetics/145.2.519. [DOI] [PMC free article] [PubMed] [Google Scholar]
- 30.Kaplan N L, Darden T, Hudson R R. Genetics. 1988;120:819–829. doi: 10.1093/genetics/120.3.819. [DOI] [PMC free article] [PubMed] [Google Scholar]
- 31.Felsenstein, J., Kuhner, M. K., Yamamoto, J. & Beerli, P. (1999) IMS Lecture Series 33, in press.
- 32.Wolinsky S M, Korber B T M, Neumann A U, Daniels M, Kuntsman K J, Whetsell A J, Furtado M R, Cao Y, Ho D D, Safrit J T, Koup R A. Science. 1996;272:537–542. doi: 10.1126/science.272.5261.537. [DOI] [PubMed] [Google Scholar]
- 33.Golding B. In: Progress in Population Genetics and Human Evolution. Donnelly P, Tavaré S, editors. Vol. 87. New York: Springer; 1997. [Google Scholar]
- 34.Wright S. Science. 1938;87:430–431. [Google Scholar]
- 35.Nei M. Molecular Evolutionary Genetics. New York: Columbia Univ. Press; 1987. [Google Scholar]
- 36.Felsenstein J. J Mol Evol. 1981;17:368–376. doi: 10.1007/BF01734359. [DOI] [PubMed] [Google Scholar]
- 37.Kelly J K. Genet Res. 1994;64:1–9. doi: 10.1017/s0016672300032481. [DOI] [PubMed] [Google Scholar]