

Abstract
Many acute cardiovascular syndromes such as heart attack and stroke are caused by atherosclerotic plaque ruptures which often happen without warning. MRI-based models with fluid-structure interactions (FSI) have been introduced to perform flow and stress/strain analysis for atherosclerotic plaques and identify possible mechanical and morphological indices for accurate plaque vulnerability assessment. In this paper, cyclic bending was added to 3D FSI coronary plaque models for more accurate mechanical predictions. Curvature variation was prescribed using the data of a human left anterior descending (LAD) coronary artery. Five computational models were constructed based on ex vivo MRI human coronary plaque data to assess the effects of cyclic bending, pulsating pressure, plaque structure, and axial stretch on plaque stress/strain distributions. In vitro experiments using a hydrogel stenosis model with cyclical bending were performed to observe effect of cyclical bending on flow conditions. Our results indicate that cyclical bending may cause more than 100% or even up to more than 1000% increase in maximum principal stress values at locations where the plaque is bent most. Stress increase is higher when bending is coupled with axial stretch, non-smooth plaque structure, or resonant pressure conditions (zero phase angle shift). Effects of cyclic bending on flow behaviors are more modest (21.6% decrease in maximum velocity, 10.8% decrease in flow rate, maximum flow shear stress changes were < 5%). Computational FSI models including cyclic bending, plaque components and structure, axial stretch, accurate in vivo measurements of pressure, curvature, and material properties should lead to significant improvement on stress-based plaque mechanical analysis and more accurate coronary plaque vulnerability assessment.
Keywords: Coronary artery, cardiovascular, cyclic bending, fluid-structure interaction, blood flow, atherosclerotic plaque rupture
1. Introduction
Cardiovascular disease (CVD) is the No. 1 killer in the United States and was responsible for 40% of all deaths in 2000 [2]. Atherosclerotic plaques may rupture without warning and cause acute cardiovascular syndromes such as heart attack and stroke. A large number of victims of the disease who are apparently healthy die suddenly without prior symptoms. About 95 percent of sudden cardiac arrest victims die before reaching the hospital. About 250,000 people a year die of coronary artery disease (CAD) without being hospitalized, about half of all deaths from CAD. Available screening and diagnostic methods are insufficient to identify the victims before the event occurs [30-31].
Plaque rupture is believed to be related to plaque morphology, mechanical forces, vessel remodeling, blood conditions (cholesterol, sugar, etc.), chemical environment, and lumen surface conditions (inflammation) [12-13,15-16,25]. However, mechanisms causing plaque rupture are not fully understood [5-7,17,32-33,39,47]. Some studies indicate that the following factors appear to be closely associated with plaque ruptures [5-6,9,15,46]: a) a large atheromatous lipid-rich core; b) a thin fibrous cap; c) weakening of the plaque cap, superficial plaque inflammation, and erosion. MRI techniques have been developed to non-invasively quantify plaque size, shape, and components (fibrous, lipid, calcification/ inflammation) [18,50]. Attempts of using ultrasound and intravascular ultrasound (IVUS) techniques have been made to quantify vessel motion, mechanical properties, and vessel wall structure, even to predict rupture locations [32-34]. In McCord and Ku’s experiments, fresh human artery rings were cyclically bent for 500,000 cycles. The cyclic bending stresses induced intimal rupture that may mimic artery fatigue and plaque rupture [27-28].
Plaque rupture must occur in the presence of supra-critical loads that exceed the material strength of the plaque cap. Plaque vulnerability should be assessed with both plaque morphology and mechanical forces (rupture triggers) taken into consideration and some reliable easy-to-use computational classification / indexing scheme should be introduced [44]. Computational simulations for plaque rupture investigation and vulnerability assessment based on MR images have been proposed but are limited to 2D or 3D structure-only or 3D flow-only models with a few exceptions due to the complexity of the problem [1,8,20,23,26,40]. Models with fluid-structure interactions (FSI) were pioneered by Peskin with his celebrated immersed boundary method [35]. Considerable effort has been devoted to numerical method development for problems involving FSI [37-38,48,51]. Computational models based on MR images from realistic human plaque specimen have been introduced by several groups to perform mechanical analysis [19,23,26,40]. However, 3D multi-component FSI models based on MRI data for human coronary plaques with cyclic bending are still lacking in the literature because: a) combining cyclic bending with FSI, multi-component and axial stretch is extremely challenging; b) construction of multi-component FSI models is very time consuming and difficult to automate due to the complexity of plaque structure; c) strong fluid-structure interactions, pulsating pressure, large strain / deformation, complex geometry lead to extremely challenging computational problems; d) 3D plaque FSI models are highly nonlinear in material properties, geometries, and flow equations. Solving such computational models and identifying critical indicators relevant to plaque rupture are real challenges.
We have introduced MRI-based 3D multi-component FSI models to perform flow and stress/strain analysis for atherosclerotic plaques and identify possible mechanical and morphological indices for accurate plaque vulnerability assessment [43-45,49]. In this paper, we are adding cyclic bending to 3D FSI coronary plaque models for more accurate computational predictions. It is known that coronary plaques are more likely to rupture compared to carotid plaques under comparable conditions (such as stenosis severity at about 50% by diameter). One possible reason is that coronary arteries are under cyclic bending caused by heart motion and compression. We hypothesize that cyclic bending of coronary atherosclerotic plaques may be a major contributor to critical stress variations in coronary plaques leading to increased plaque rupture risk. Computational models were constructed based on ex vivo MRI human coronary plaque data to assess the effect of cyclic bending on plaque stress/strain distributions.
2. In vitro experiment stenosis models
In vitro flow experiments using hydrogel stenotic tubes with cyclic bending were conducted to provide experimental data to validate our models. The diseased coronary artery was modeled using an elastic hydrogel shaped in the form of a stenosis (Fig. 1). Physiological pressure conditions and cyclic bending were imposed with a sophisticated design (see Figures 1 & 2). The rubber sliding support was powered by a motor to impose physiological curvature variations (Fig. 2(c)). Flow rate and pressure were measured by electromagnetic flow meters and pressure transducers respectively. Sagittal section ultrasound images of the stenosis were made from the B-mode of a Duplex ultrasound scan. The results were recorded to be compared with computational results for model validation. Results presented in Fig. 2 were obtained using a hydrogel stenosis model with 70% stenosis severity (by diameter) and 100% eccentricity.
Figure 1.

In vitro experimental set-up with cyclic bending for model validation. (a) Experimental set-up for steady and pulsatile flow experiments with cyclic bending; (b) Tube dimensions. L=110 mm, Ls=16mm, D=8mm, h=1mm. Stenosis severity = (D - Ds)/D × 100% (by diameter); Eccentricity Ec = e/((D-Ds)/2) × 100%.
Figure 2.

Imposed pressure and curvature conditions for the in vitro stenosis model and measured flow rates. (a) Imposed pressure conditions; (b) Flow rate obtained from experiment; (c) Imposed cyclic curvature condition (curvature: 0.052 - 0.16 1/cm); (d) Ultrasound image of the deformed hydrogel tube with stenosis.
3. MRI data acquisition, computational models, and solution procedures
3.1 MRI data acquisition
A 3D MRI data set obtained from a human coronary plaque ex vivo consisting of 36 slices with a relatively high resolution (0.25mm × 0.23mm × 0.5mm) was used as the baseline case to develop the computational model. The specimen was fixed in a 10% buffered formalin solution and placed in a polyethylene tube. It was stored at 4°C within 12 hours after removal from the heart. MRI imaging was taken within 2 days at room temperature. Multi-contrast (T1, middle-T2, T2, and proton density-weighting) MRI imaging was performed to better differentiate different components in the plaque (Fig. 3). Our individual contour plots show that T1-weighting is better to assess calcification, T2-weighting is better to assess the lumen and outer boundary, and the middle-T2 weighting is better for lipid core assessment. The MR system is 3T Siemens Allegra clinical system (Siemens Medical Solutions, Malvern, PA). A single-loop volume coil (Nova Medical, Inc, Wilmington, MA) with a diameter of 3.5 cm was used as a transmitter and receiver. After completion of MR study, the transverse sections with a thickness of 10 μm were obtained at 1 mm intervals from each specimen. These paraffin-embedded sections were stained with hematoxylin and eosin (H&E), Masson’s trichrome, and elastin van Gieson’s (EVG) stains to identify major plaque components: calcification (Ca), lipid rich necrotic core (LRNC), and fibrotic plaques (FP). Plaque vulnerability of these samples was assessed pathologically to serve as bench mark to validate computational findings. The 3D ex vivo MRI data were read by a self-developed software package Atherosclerotic Plaque Imaging Analysis (APIA) written in Matlab (Math Works, MATLAB, Natick, MA) and also validated by histological analysis. All segmented 2D slices were read into ADINA input file, pixel by pixel. 3D plaque geometry and mesh were re-constructed following the procedure described in Tang et al. [45]. 3D surfaces, volumes and computational mesh were made under ADINA computing environment. Fig. 4 shows the 36 MRI slices (selected from a set of 36 slices) of a cadaveric human coronary plaque sample, plaque component contour plots based on histological segmentation data, and the re-constructed 3D geometry. The diameter of the vessel is about 5-6 mm. Some smoothing (third-order spline) was applied to correct numerical and MR artifacts, as well as overly unsmooth spots that affect the convergence of the model. The vessel was extended uniformly at both ends by 3 cm and 6 cm respectively to avoid entrance-end flow effect.
Figure 3.

A segmentation example using multi-contrast MR Images. (a)-(c), MR images with T1, middle-T2, and T2-weighted images; (d) Contour plot of the segmented image using a multi-contrast algorithm; (e) Histological data. The location and shape of each major plaque component correlated very well with histological data.
Figure 4.

A coronary plaque sample with a large calcification block and a lipid pool. (a) A 36-slice 3D set of MR images of a human coronary plaque sample; (b) Segmented contour plots showing plaque components; (c) Re-constructed 3D plaque geometry. The position of the vessel is rotated for better viewing.
3.2. The computational multi-component model with FSI and cyclic bending
A 3D multi-component FSI model was introduced to evaluate the effects of cyclic bending on stress/strain distributions in coronary plaques using the plaque sample re-constructed in 3.1 (Fig. 4). Blood flow was assumed to be laminar, Newtonian, and incompressible. The Navier-Stokes equations with Arbitrary Lagrangian-Eulerian (ALE) formulation were used as the governing equations. Physiological pressure conditions were prescribed at both inlet and outlet (Fig. 5). Both artery vessel material and plaque components in the plaque were assumed to be hyperelastic, isotropic, incompressible and homogeneous. The 3D nonlinear modified Mooney-Rivlin (M-R) model was used to describe the material properties of the vessel wall and plaque components [3-4, 41-45, 49]. No-slip conditions and natural traction equilibrium conditions are assumed at all interfaces. Putting these together, we have (summation convention is used):
| (1) |
| (2) |
| (3) |
| (4) |
| (5) |
| (6) |
| (7) |
| (8) |
where u and p are fluid velocity and pressure, ug is mesh velocity, Λ stands for vessel inner boundary, f ·,j stands for derivative of f with respect to the jth variable, σ is the Cauchy stress tensor (superscripts indicate different materials), ε is strain tensor, v is solid displacement vector, superscript letters “r” and “s” were used to indicate different materials (fluid, or different plaque components). The strain energy function for M-R model is given by [11,14],
| (9) |
| (10) |
where I1 and I2 are the first and second strain invariants, C =[Cij] = XTX is the right Cauchy-Green deformation tensor, X=[Xij] = [∂xi/∂aj], (xi) is current position, (ai) is original position [3-4], ci and Di are material parameters chosen to match experimental measurements [20,,22,24]. 3D stress/strain relations can be obtained by finding various partial derivatives of the strain energy function with respect to proper variables (strain/stretch components). In particular, setting material density ρ= 1 g · cm-3 and assuming,
| (11) |
where λ1, λ2 and λ3 are stretch ratios in the (x,y,z) directions respectively, the uni-axial stress/stretch relation for an isotropic material is obtained from Equation (9),
| (12) |
The stress-stretch curves derived from the modified Mooney-Rivlin models are given by Fig. 6(a). Because calcification is much stiffer than normal tissue, lipid core is very soft, and actual measurement of their material properties were not currently available, calcification and necrotic lipid core parameters were chosen to be 10 times and one eighteenth of that of normal vessel tissue, respectively (by adjusting c1 and D1 values. D2 was unchanged). Cyclic arterial bending secondary to cardiac motion was introduced into the computational model by specifying a region of asymmetric repeat displacement. The displacement was adjusted to achieve desirable curvature changes [10, 29, 36]. The imposed curvature variation is given in Fig. 6(b) using the data of a human left anterior descending (LAD) coronary curvature variation data given in [36].
Figure 5.

Prescribed inlet/outlet pressure conditions and corresponding flow rates from models with/without cyclic bending. Cyclic bending reduced max flow rate by 10.8%.
Figure 6.

Material stress-stretch curves and imposed curvature conditions. (a) Stress-stretch curves derived from the modified Mooney-Rivlin models for fibrous tissue (vessel), lipid pool, and calcifications. Parameter values: Fibrous tissue, C1=92000.0, D1=36000.0, D2=2.0; Ca: C1=920000.0, D1=360000.0, D2=2.0; Lipid: C1=5000.0, D1=5000.0, D2=1.5. Units for C1 and D1: dyn/cm2. C2=0 for all models; (b) Imposed curvature conditions based on human left anterior descending (LAD) coronary curvature variation data [36].
3.3 Solution method
The coupled FSI models were solved by a commercial finite-element package ADINA (ADINA R & D, Inc., Watertown, MA, USA). ADINA uses unstructured finite element methods for both fluid and solid models. Nonlinear incremental iterative procedures were used to handle fluid-structure interactions. Proper mesh was chosen to fit the shape of each component, the vessel, and the fluid domain. Finer mesh was used for thin plaque cap and components with sharp angles to get better resolution and handle high stress concentration behaviors. The governing finite element equations for both the solid and fluid models were solved by the Newton-Raphson iteration method. ADINA has been tested by hundreds of real-life applications and has been used by Tang et al. and many other groups to solve FSI models [4]. Details of the computational models and solution methods are given in [3-4, 41-45].
4. Results
Computational simulations were conducted using the coronary plaque sample to quantify effects of cyclic bending and its combined effects with pressure (phase angle shift), plaque components, and axial stretch. Five models were considered: Model 1, Baseline model with plaque components, cyclic bending and pulsating pressure as prescribed in 3.2; Model 2 with plaque components and pulsating pressure, but no bending; Model 3 with bending and pulsating pressure the same as Model 1, but no plaque components, i.e., the same material properties were assigned to Ca and lipid core components; Model 4 is the same as Model 1, but with no phase angle between cyclic bending and pressure. Maximum pressure occurs with maximum bending; Model 5 has 10% axial pre-stretch added to Model 1. Finally, results using data from the in vitro hydrogel stenosis model were also presented.
4.1 Cyclic bending leads to considerable stress/strain variations in the plaque
Figures 7 & 8 give maximum principal stress (Stress-P1) and maximum principal strain (Strain-P1) plots from Model 1 (with bending) and Model 2 (no bending), corresponding to three curvature/pressure conditions in one cardiac cycle. For Model 1, Maximum Stress-P1 from Fig. 7(e) (maximum curvature) was 320% higher than that from Fig. 7(a) (minimum curvature) even though pressure was lower in (e). Maximum value from Fig. 7(e) was also 392% higher than that from the no-bending case (Fig. 8(e)). Fig. 8 shows that stress/strain variations are dominated by pressure changes when no cyclic bending is imposed. Strain distributions in the plaque showed similar behaviors. These results show very clearly that cyclic bending leads to large stress/strain increases (400%) in the plaque and must be included in computational models for coronary plaques for accurate stress/strain predictions.
Figure 7.

Cyclic bending leads to large stress variations: Stress-P1/Strain-P1 distributions from Model 1 (with bending) corresponding to three curvature conditions.
Figure 8.

Stress-P1/Strain-P1 distributions from Model 2 (no cyclic bending) showed only modest varitations caused by imposed pulsating pressure conditions.
4.2 Cyclic bending caused only modest flow velocity and shear stress changes
Effects of cyclic bending on flow behaviors are modest because flow is more closely related to pressure drop across the plaque segment which was kept the same for both bending and no-bending models. Cyclic bending does increase flow resistant because of the increased curvature. Fig. 9 compares flow maximum shear stress (FMSS) and velocity for the bending and no-bending cases corresponding to the time step with maximum curvature. Table 1 lists the maximum FMSS and velocity values for three curvature conditions. Maximum velocity from Model 1 corresponding to maximum curvature was 116.2 cm/s, which increased to 148.3 cm/s for the no-bending case, a 27.6% increase. It should be noted that these maximum values were observed at only one or a few computational nodal points, and may not be detectable by medical devices. A second effect of bending may be seen in the overall flow rate during the cardiac cycle (see Fig. 5). Maximum flow rates were 215 ml/min with bending, and 241 ml/min (12% increase) without bending, respectively, likely due to additional viscous losses associated with the changing curvatures. Differences in maximum flow shear stress were less than 5%.
Figure 9.

Comparison of flow maximum shear stress (FMSS) and velocity plots from Model 1 (with bending) and Model 2 (no bending) showing that cyclic bending has modest effects on flow velocity and maximum shear stress.
Table 1.
Comparison of maximum FMSS and velocity values from Model 1 (with bending) and Model 2 (no bending) showing that cyclic bending has modest effects on flow velocity and maximum shear stress
| Cases | Max Velocity | Max FMSS | Max Velocity | Max FMSS | Max Velocity | Max FMSS |
|---|---|---|---|---|---|---|
| Model 1 | κ=0.39 1/cm, Pin=101 | κ=0.78 1/cm, Pin=130 | κ=0.97 1/cm, Pin=86 | |||
| Baseline | 197.4 | 170 | 272.9 | 226.4 | 116.2 | 135.7 |
| Model 2 | κ=0, Pin=101 | κ=0, Pin=130 | κ=0, Pin=86 | |||
| No Bending | 198.3 | 167.1 | 286.2 | 231.4 | 148.3 | 129.8 |
4.3 Combined effects of bending with plaque components, phase angle and axial stretch
Our previous papers investigated the effects of major contributing factors for stress-strain distributions in the plaque. Those factors included plaque morphology, plaque structure with components, pressure condition, material properties, and axial stretch. Table 2 lists the maximum Stress-P1/Strain-P1 from the 5 models under various curvature/pressure conditions. Maximum stress values from Model 1 (with components) were about 50% higher than those from Model 3 (no components). When maximum pressure and maximum bending occurred simultaneously, maximum stress value was 20% and 60% higher than those from Model 1 corresponding to either maximum curvature or maximum pressure times, respectively. With a 10% axial stretch added to Model 1, maximum Stress-P1 value for κ=0.97 1/cm, Pin=86 mmHg increased to 456 KPa, a 151% increase from that of Model 1, and a 1,236% increase from Model 2 due to combination of maximum bending, axial stretching, and nonuniform structure.
Table 2.
Summary of maximum Stress-P1 and Strain-P1 values from five models showing that cyclic bending has large effects on stress/strain values in coronary plaques. α is the phase angle between maximum curvature and maximum pressure
| Cases | Max Stress-P1 | Max Stress-P1 | Max Stress-P1 | Max Stress-P1 | Max Stress-P1 | Max Stress-P1 |
|---|---|---|---|---|---|---|
| Model 1 | κ=0.39 1/cm, Pin=101 | κ=0.78 1/cm, Pin=130 | κ=0.97 1/cm, Pin=86 | |||
| Baseline | 43.2 | 0.396 | 136.9 | 0.651 | 181.6 | 0.709 |
| Model 2 | κ=0, Pin=101 | κ=0, Pin=130 | κ=0, Pin=86 | |||
| No Bending | 43.1 | 0.302 | 54.5 | 0.388 | 36.9 | 0.269 |
| Model 3 | κ=0.39 1/cm, Pin=101 | κ=0.78 1/cm, Pin=130 | κ=0.97 1/cm, Pin=86 | |||
| No comp. | 40.2 | 0.316 | 96.8 | 0.492 | 119.8 | 0.596 |
| Model 4 | κ=0.39 1/cm, Pin=96.4 | κ=0.97 1/cm, Pin=130 | ||||
| α=0 | 41.3 | 0.392 | 218.7 | 0.731 | ||
| Model 5 | κ=0.39 1/cm, Pin=101 | κ=0.78 1/cm, Pin=130 | κ=0.97 1/cm, Pin=86 | |||
| 10% stretch | 104.8 | 0.325 | 130.9 | 0.670 | 456.0 | 0.936 |
4.4 Local stress/strain behaviors tracked at selected critical sites
We have reported that plaque vulnerability may be more closely associated with local stress/strain behaviors than with global maximum stress/strain values [44]. Fig. 10 shows three selected sites for tracking local stress/strain behaviors and Stress-P1 variations tracked at these sites. Maximum values of the 15 tracking curves are summarized in Table 2. Track Point 1 (TP1) is the location where global maximum Stress-P1 was found under maximum curvature for Models 1, 3 and 4. Track Point 2 (TP2) is located at the plaque cap which may be more relevant to plaque rupture and vulnerability assessment. Track Point 3 (TP3) is at a location where the plaque has a “crack” with large local curvature. It should be noted that different scales were used in those plots. At TP1, Stress-P1 varied between 40 - 180 KPa in (b), but changed very little in (c), where no bending was applied. The no-component model and 10% axial stretch model showed reduced Stress-P1 variations at TP1, while zero-phase angle (the time delay between maximum curvature and maximum inlet pressure) increased the variation. Stress-P1 variation at TP2 was reduced when plaque components were treated as normal tissue (i.e., the whole plaque is made of one homogeneous material). Stress-P1 at TP3 was very sensitive to bending and axial stretch. Its variation curve from Model 2 (no bending) was almost flat and near zero. However, the maximum values of the variation curves from other models were 101 KPa (Model 1), 188.5 KPa (Model 3), and 521 KPa (Model 5)! These peak plaque stresses are close to ultimate strength values for soft tissues and in excess of most tissue-engineered arteries [8]. These results indicate that cyclic bending, pressure, plaque components, and axial stretch are major contributing factors to stress conditions in coronary plaques. Their effects on stress distributions can be in the order of 100% to more than 1000%. These numbers are far greater than what one might expect based on results from other models without cyclic bending in the current literature.
Figure 10.

Local Stress-P1 variations tracked at three selected locations from five models with different modeling assumptions showing cyclic bending causes large stress variations in the coronary plaque, especially when coupled with non-smooth plaque structure, axial stretch, and enforcing resonant pressure conditions.
4.5 Results from the model based on in vitro experimental data
The in vitro experiments were conducted to obtain accurately measured data for model validations. Our computational flow rates and wall deformation agreed well with experimental measurements with errors less than 5% for flow rate predictions and 2% for wall radii predictions [41-42]. Fig. 11 shows a Stress-P1 plot with three tracking positions and Stress-P1 variations tracked at those locations. It should be noted that the in vitro hydrogel stenosis model is considerably different from the plaque sample (Fig. 4) in the following ways: a) the stenosis shoulder is much shorter; b) the vessel wall is thinner; c) imposed curvature variation is smaller (from 0.053 1/cm to 0.105 1/cm). Stress concentration at about the middle of Fig. 11(a) was found which indicated some modest flattening of the tube caused by cyclic bending. Maximum Stress-P1 was found at TP3. Other model comparison results are similar to those found from the plaque models and are omitted here.
Figure 11.
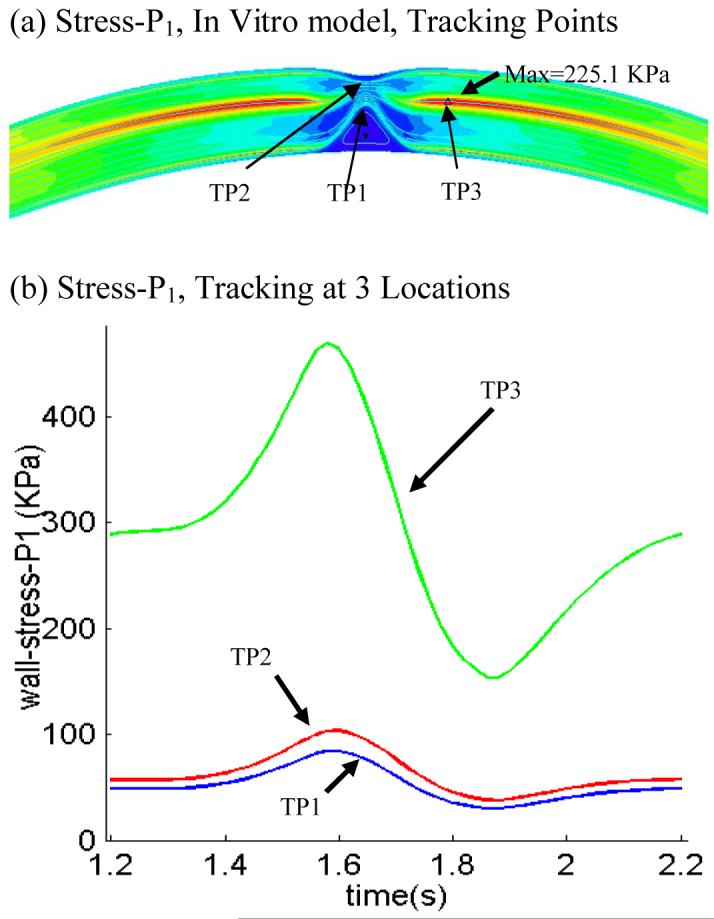
Results from the in vitro model showing cyclic bending caused high stress variation at a site distal to the stenosis (TP3). Stress values at TP3 was about 400% higher than those observed at TP1 and TP2.
5. Discussion
5.1 Adding cyclic bending to coronary plaque models with more realistic heart motion
It was evident from the results presented in this paper that adding cyclic bending to coronary plaque models will change stress predictions up to 100% or more which makes cyclic bending a necessary modeling addition to have accurate stress-strain predictions and stress-based vulnerability assessment. It should be noted that cyclic bending was added in this paper by imposing a cyclic displacement at the lower edge of the vessel. It would be more realistic if the vessel could be combined with a heart model or at least placed on a sphere so that the bending would be more realistic [36]. Axial stretch and compression from heart could also be added for better accuracies.
5.2 Order of importance of major contributing factors to plaque stress/strain distributions
While high blood pressure is a well-recognized contributor to high plaque stress and a risk-factor for cardiovascular disease, our results indicate that cyclic bending may be contributing more to critical stress and strain conditions. Critically high stress conditions can occur with relatively low lumen pressure. Combining axial stretch with bending and non-smooth plaque structure (such as a crack) led to extremely high stress levels (more than 1000% higher). The order of importance of high blood pressure, plaque components and structure, cyclic bending, material properties, and axial stretch should be carefully evaluated using more plaque samples.
5.3 Limitations on available in vivo human data
The plaque model was constructed based on ex vivo MRI data. It is known that there are considerable differences between ex vivo and in vivo MR images [21]. Artery samples have considerable shrinkages from in vivo to ex vivo conditions [21]. Lipid contents often leak out. There may be vessel deformation caused by human handling. It would be very desirable to have in vivo plaque images. At the same time, in vivo material properties, pressure and curvature conditions would also make computational plaque models more realistic. Our computational prediction accuracies could be greatly improved when the model can be constructed based on in vivo plaque morphology, pressure and curvature conditions.
6. Conclusion
Our modeling study indicates that cyclic bending affects stress variations in coronary plaques in the order of 100% or more. Stress-P1 value increases over 1000% were observed at selected critical sites. Peak wall stresses with bending may exceed critical ultimate strength values for the plaque cap suggesting induced rupture. Computational FSI models including cyclic bending, plaque components and structure, axial stretch, accurate in vivo measurements of pressure, curvature, and material properties should lead to significant improvement on stress-based plaque mechanical analysis and more accurate coronary plaque vulnerability assessment.
Table 3.
Summary of maximum Stress-P1 and Strain-P1 values at three tracking sites from five models showing that cyclic bending has large modest effects on critical stress/strain values in coronary plaques
| Model | TP1, Max Stress-P1 (KPa) | TP2, Max Stress-P1 (KPa) | TP3, Max Stress-P1 (KPa) | TP1, Max Stress-P1 | TP1, Max Stress-P1 | TP1, Max Stress-P1 |
|---|---|---|---|---|---|---|
| Model1 | 178.2 | 72.2 | 101.1 | 0.657 | 0.496 | 0.186 |
| Model2 | 8.0 | 79.3 | 1.6 | 0.111 | 0.523 | 0.044 |
| Model3 | 115.2 | 43.3 | 188.5 | 0.561 | 0.379 | 0.221 |
| Model4 | 214.7 | 63.3 | 46.4 | 0.677 | 0.466 | 0.172 |
| Model5 | 152.5 | 70.7 | 521.2 | 0.948 | 0.471 | 0.232 |
Acknowledgement
This research was supported in part by NSF/NIGMS DMS-0540684 and NIH R01 EB004759. Advices and guidance from Professor Morton Friedman at Duke University and Professor Roger Kamm at MIT are happily acknowledged.
REFERENCES
- 1.Ahrem R, Beckert A, Wendland H. A Meshless Spatial Coupling Scheme for Large-scale Fluid-structure- interaction Problems. CMES. 2006;12(2):121–136. [Google Scholar]
- 2.American Heart Association . Heart Disease and Stroke Statistics - 2003 Update. American Heart Association; Dallas, Tex: 2003. [Google Scholar]
- 3.Bathe KJ. Finite Element Procedures. Prentice Hall, Inc.; New Jersey: 1996. [Google Scholar]
- 4.Bathe KJ, editor. Theory and Modeling Guide, Vol I & II: ADINA and ADINA-F. ADINA R & D, Inc.; Watertown: 2007. [Google Scholar]
- 5.Bock RW, Gray-Weale AC, Mock FP, Stats MA, Robinson DA, Irwig L, Lusby RJ. The natural history of asymptomatic carotid artery disease. J. Vasc Surg. 1993;17:160–71. doi: 10.1067/mva.1993.43142. 1993. [DOI] [PubMed] [Google Scholar]
- 6.Boyle JJ. Association of coronary plaque rupture and atherosclerotic inflammation. J. Pathology. J. Pathology. 1997;181:93–99. doi: 10.1002/(SICI)1096-9896(199701)181:1<93::AID-PATH696>3.0.CO;2-H. 1997. [DOI] [PubMed] [Google Scholar]
- 7.Burke AP, Farb A, Malcom GT, Liang YH, Smialek JE, Virmani R. Plaque Rupture and Sudden Death Related to Exertion in Men with Coronary Artery Disease. JAMA: J. of American Medical Association. 1999;281:921–926. doi: 10.1001/jama.281.10.921. [DOI] [PubMed] [Google Scholar]
- 8.Cheng GC, Loree HM, Kamm RD, Fishbein MC, Lee RT. Distribution of circumferential stress in ruptured and stable atherosclerotic lesions, a structural analysis with histopathological correlation. Circulation. 1993;87:1179–1187. doi: 10.1161/01.cir.87.4.1179. [DOI] [PubMed] [Google Scholar]
- 9.Falk E, Shah PK, Fuster V. Coronary plaque disruption. Circulation. 1995;92:657–671. doi: 10.1161/01.cir.92.3.657. 1995. [DOI] [PubMed] [Google Scholar]
- 10.Friedman MH, Bargeron CB, Deters OJ, Hutchins GM, Mark FF. Correlation between wall shear and intimal thickness at a coronary artery branch. Atherosclerosis. 1987;68:27–33. doi: 10.1016/0021-9150(87)90090-6. [DOI] [PubMed] [Google Scholar]
- 11.Fung YC, Fronek K, Patitucci P. Pseudoelasticity of arteries and the choice of its mathematical expression. Am. J. Physio. 1979:H620–H631. doi: 10.1152/ajpheart.1979.237.5.H620. [DOI] [PubMed] [Google Scholar]
- 12.Fung YC, Liu SQ, Zhou JB. Remodeling of the constitutive equation while a tissue remodels itself under stress. J. Biomech. Engng. 1993;115(4B):453–459. doi: 10.1115/1.2895523. [DOI] [PubMed] [Google Scholar]
- 13.Fung YC, Liu SQ. Elementary mechanics of the endothelium of blood vessels. J. of Biomech. Engng. 1993;115:1–12. doi: 10.1115/1.2895465. [DOI] [PubMed] [Google Scholar]
- 14.Fung YC, Tong P. Theory of the sphering of red blood cells. J. Biophys. 1968;8:175–198. doi: 10.1016/S0006-3495(68)86484-7. [DOI] [PMC free article] [PubMed] [Google Scholar]
- 15.Fuster V, et al., editors. Identification, and Modification, AHA Monograph series. Futura Publishing; Armonk NY: 1998. The Vulnerable Atherosclerotic Plaque: Understanding. [Google Scholar]
- 16.Fuster V, Stein B, Ambrose JA, Badimon L, Badimon JJ, Chesebro JH. Atherosclerotic plaque rupture and thrombosis, evolving concept. Circulation. 1990;82(Supplement II):II-47–II-59. [PubMed] [Google Scholar]
- 17.Giddens DP, Zarins CK, Glagov S. The role of fluid mechanics in the localization and detection of atherosclerosis. J. Biomech. Engng. 1993;115:588–594. doi: 10.1115/1.2895545. [DOI] [PubMed] [Google Scholar]
- 18.Gillard JH, Hatsukami TS, Graves M, Yuan C. The Role of Imaging in Diagnosis and Management. Cambridge University Press; Cambridge, England: 2006. Carotid Disease. [Google Scholar]
- 19.Holzapfel GA, Stadler M, Schulze-Bause CAJ. A layer-specific three-dimensional model for the simulation of balloon angioplasty using Magnetic Resonance Imaging and mechanical testing. Ann. Biomed. Eng. 2002;30(6):753–767. doi: 10.1114/1.1492812. [DOI] [PubMed] [Google Scholar]
- 20.Huang H, Virmani R, Younis H, Burke AP, Kamm RD, Lee RT. The impact of calcification on the biomechanical stability of atherosclerotic plaques. Circulation. 2001;103:1051–1056. doi: 10.1161/01.cir.103.8.1051. [DOI] [PubMed] [Google Scholar]
- 21.Huang X, Yang C, Yuan C, Liu F, Canton G, Zheng J, Woodard PK, Sicard GA, Tang D. Patient-Specific Artery Shrinkage and 3D Zero-Stress State in Multi-Component 3D FSI Models for Carotid Atherosclerotic Plaques Based on In Vivo MRI Data. Molecular & Cellular Biomechanics. 2008 in press. [PMC free article] [PubMed] [Google Scholar]
- 22.Humphrey JD. Cardiovascular Solid Mechanics. Springer-Verlag; New York: 2002. [Google Scholar]
- 23.Kaazempur-Mofrad MR, Isasi AG, Younis HF, Chan RC, Hinton DP, Sukhova G, Lamuraglia GM, Lee RT, Kamm RD. Characterization of the Atherosclerotic Carotid Bifurcation Using MRI, Finite Element Modeling, and Histology. Ann. Biomed. Eng. 2004;32(7):932–946. doi: 10.1023/b:abme.0000032456.16097.e0. [DOI] [PubMed] [Google Scholar]
- 24.Kobayashi S, Tsunoda D, Fukuzawa Y, Morikawa H, Tang D, Ku DN. Flow and compression in arterial models of stenosis with lipid core; Proceedings of 2003 ASME Summer Bioengineering Conference; Miami, FL. 2003.pp. 497–498. [Google Scholar]
- 25.Ku DN. Blood flow in arteries. Annu. Rev. Fluid Mech. 1997;29:399–434. [Google Scholar]
- 26.Long Q, Xu XY, Ariff B, Thom SA, Hughes AD. Reconstruction of blood flow patterns in a human carotid bifurcation: A combined CFD and MRI study. J. Magn. Reson. Imaging. 2000;11:299–311. doi: 10.1002/(sici)1522-2586(200003)11:3<299::aid-jmri9>3.0.co;2-m. A. V. [DOI] [PubMed] [Google Scholar]
- 27.McCord BN. Ph.D Thesis. Georgia Institute of Technology; 1992. Fatigue of atherosclerotic plaque. [Google Scholar]
- 28.McCord BN, Ku DN. Mechanical rupture of the atherosclerostic plaque fibrous cap; Proceedings of 1993 Bioengineering Conference; Colorado. 1993.pp. 324–327. [Google Scholar]
- 29.Moore JE, Jr, Weydahl ES, Santamarina A. Frequency dependence of dynamic curvature effects on flow through coronary arteries. J Biomech Eng. 2001;123(2):129–33. doi: 10.1115/1.1351806. [DOI] [PubMed] [Google Scholar]
- 30.Naghavi M, et al. From vulnerable plaque to vulnerable patient: a call for new definitions and risk assessment strategies: Part I. Circulation. 2003;108(14):1664–72. doi: 10.1161/01.CIR.0000087480.94275.97. 58 co-authors. [DOI] [PubMed] [Google Scholar]
- 31.Naghavi M. From vulnerable plaque to vulnerable patient: a call for new definitions and risk assessment strategies: Part II. Circulation. 2003;108(15):1772–8. doi: 10.1161/01.CIR.0000087481.55887.C9. same as above. [DOI] [PubMed] [Google Scholar]
- 32.Ohayon J, Pierre T, Finet G, Rioufol G. In-vivo prediction of human coronary plaque rupture location using intravascular ultrasound and the finite element method. Coronary Artery Disease. 2001;12:655–663. doi: 10.1097/00019501-200112000-00009. [DOI] [PubMed] [Google Scholar]
- 33.Park JBR, Tobis JM. Spontaneous plaque rupture and thrombus formation in the left main coronary artery documented by intravascular ultrasound. Catheterization and cardiovascular Diagnosis. 1997;40:358–360. doi: 10.1002/(sici)1097-0304(199704)40:4<358::aid-ccd7>3.0.co;2-8. [DOI] [PubMed] [Google Scholar]
- 34.Pedersen PC, Chakareski J, Lara-Montalvo R. Ultrasound characterization of arterial wall structures based on integrated backscatter profiles; Proc. for the 2003 SPIE Med Imaging Symposium; San Diego. 2003.pp. 115–126. [Google Scholar]
- 35.Peskin CS. Mathematical Aspects of Heart Physiology. Lecture Notes of Courant Institute of Mathematical Sciences; New York: 1975. [Google Scholar]
- 36.Prosi M, Perktold K, Ding Z, Friedman MH. Influence of curvature dynamics on pulsatile coronary artery flow in a realistic bifurcation model. J. Biomech. 2004;37:1767–1775. doi: 10.1016/j.jbiomech.2004.01.021. [DOI] [PubMed] [Google Scholar]
- 37.Rugonyi S, Bathe KJ. On Finite Element Analysis of Fluid Flows Fully Coupled with Structural Interactions. CMES. 2001;2(2):195–212. [Google Scholar]
- 38.Scotti CM, Cornejo SL, Finol EA. Biomechanics of Abdominal Aortic Aneurysms: Flow-Induced Wall Stress Distribution. ICCES. 2007;1(1):41–48. [Google Scholar]
- 39.Shah PK. Pathophysiology of coronary thrombosis: role of plaque rupture and plaque erosion. Prog Cardiovasc Dis. 2002;44(5):357–68. doi: 10.1053/pcad.2002.123473. [DOI] [PubMed] [Google Scholar]
- 40.Steinman DA. Image-based computational fluid dynamics modeling in realistic arterial geometries. Ann. Biomed. Eng. 2002;30(4):483–97. doi: 10.1114/1.1467679. [DOI] [PubMed] [Google Scholar]
- 41.Tang D, Yang C, Kobayashi S, Zheng J, Vito RP. Effects of stenosis asymmetry on blood flow and artery compression: a 3-D FSI model. Annals of Biomedical Engineering. 2003;31:1182–1193. doi: 10.1114/1.1615577. [DOI] [PubMed] [Google Scholar]
- 42.Tang D, Yang C, Kobayashi S, Ku DN. Effect of a Lipid Pool on Stress/Strain Distributions in Stenotic Arteries: 3D FSI Models. J. Biomech. Engng. 2004;126:363–370. doi: 10.1115/1.1762898. S. [DOI] [PubMed] [Google Scholar]
- 43.Tang D. Flow in healthy and stenosed arteries. In: Akay Metin., editor. Wiley Encyclopedia of Biomedical Engineering. John Wiley & Sons, Inc.; New Jersey: 2006. pp. 1–16. Article 1525. [Google Scholar]
- 44.Tang D, Yang C, Zheng J, Woodard PK, Saffitz JE, Petruccelli JD, Sicard GA, Yuan C. Local Maximal Stress Hypothesis and Computational Plaque Vulnerability Index for Atherosclerotic Plaque Assessment. Annals of Biomedical Engineering. 2005;33(12):1789–1801. doi: 10.1007/s10439-005-8267-1. [DOI] [PMC free article] [PubMed] [Google Scholar]
- 45.Tang D, Yang C, Zheng J, Woodard PK, Sicard GA, Saffitz JE, Yuan C. 3D MRI-Based Multi-Component FSI Models for Atherosclerotic Plaques a 3-D FSI model. Ann. Biomed. Eng. 2004;32:947–960. doi: 10.1023/b:abme.0000032457.10191.e0. [DOI] [PubMed] [Google Scholar]
- 46.van der Wal AC, Becker AE, van der Loos CM, Das PK. Site of intimal rupture or erosion of thrombosed coronary atherosclerotic plaques is characterized by an inflammatory process irrespective of the dominant plaque morphology. Circulation. 1994;89:36–44. doi: 10.1161/01.cir.89.1.36. [DOI] [PubMed] [Google Scholar]
- 47.Virmani R, Kolodgie FD, Burke AP, Farb A, Schwartz SM. Lessons from sudden coronary death: a comprehensive morphological classification scheme for atherosclerotic lesions. Arterioscler Thromb Vasc Biol. 2000;20(5):1262–75. doi: 10.1161/01.atv.20.5.1262. [DOI] [PubMed] [Google Scholar]
- 48.Volokh KY, Lev Y. Growth, Anisotropy, and Residual Stresses in Arteries. MCB: Molecular & Cellular Biomechanics. 2005;2(1):27–40. [PubMed] [Google Scholar]
- 49.Yang C, Tang D, Yuan C, Hatsukami TS, Zheng J, Woodard PK. In Vivo/Ex Vivo MRI-Based 3D Models with Fluid-Structure Interactions for Human Atherosclerotic Plaques Compared with Fluid/Wall-Only Models. CMES: Comput. Model. Eng. Sci. 2007;19(3):233–245. [PMC free article] [PubMed] [Google Scholar]
- 50.Yuan C, Mitsumori LM, Beach KW, Maravilla KR. Special review Carotid atherosclerotic plaque: noninvasive MR characterization and identification of vulnerable lesions. Radiology. 2001;221:285–99. doi: 10.1148/radiol.2212001612. [DOI] [PubMed] [Google Scholar]
- 51.Zhang W, Herrera C, Atluri SN, Kassab GS. The Effect of Longitudinal Pre-Stretch and Radial Constraint on the Stress Distribution in the Vessel Wall: A New Hypothesis. MCB. 2005;2(1):41–52. [PubMed] [Google Scholar]