

Abstract
Many of the regions with the earliest atrophy in Alzheimer’s Disease (AD) do not show prominent deficits on functional imaging studies of flow or metabolism. This paradox may provide unique insights into the pathophysiology of AD. We sought to examine the relationship between function and atrophy in AD using MRI blood flow and anatomic imaging. 22 subjects diagnosed with AD, mean Mini Mental State Exam (MMSE) score 22.2, and 16 healthy elderly controls were imaged with a volumetric arterial spin labeling blood flow MRI technique and an anatomical imaging method using the identical spatial resolution, image orientation, and spatial encoding strategy. Cerebral blood flow(CBF) and gray matter (GM) maps derived from the imaging were transformed to a standard anatomical space. GM and CBF maps were tested for significant differences between groups. Additionally, images were tested for regions with significant mismatch of the CBF and GM differences between groups. CBF was significantly lower in the bilateral precuneus, parietal association cortex and the left inferior temporal lobe but was non-significantly increased in the hippocampus and other medial temporal structures. After correction for GM loss, CBF was significantly elevated in the hippocampus and other medial temporal structures. The hippocampus and other regions affected early in AD are characterized by elevated atrophy-corrected perfusion per cc of tissue. This suggests compensatory or pathological elevation of neural activity, inflammation, or elevated production of vasodilators.
INTRODUCTION
Noninvasive imaging offers several advantages as a tool for the characterization of AD pathology. Imaging can provide an unbiased sampling of pathology throughout the entire brain and highlight its anatomic distribution and evolution over time. Noninvasive imaging is particularly well suited for measurement of indicators of tissue function, including metabolism and blood flow, which are difficult or impossible to determine postmortem. Finally, noninvasive imaging can be performed repeatedly in subjects making it ideal for diagnosing the disease at its earliest stages, characterizing progression of disease, and testing potential disease-modifying therapies.
Imaging studies in AD to date have been very successful at demonstrating early loss of tissue and metabolism in the disease. High resolution imaging of the brain with Magnetic Resonance Imaging (MRI) has highlighted the early and severe loss of tissue in the hippocampus(Jack et al., 1999), entorhinal cortex(Juottonen et al., 1998; Killiany et al., 2000), and some cortical areas(Baron et al., 2001; Chetelat et al., 2002; Killiany et al., 2000). Metabolic imaging with Positron Emission Tomography(PET)(Friedland et al., 1983; Reiman et al., 1996; Small et al., 1995) and blood flow imaging with PET and Single Photon Emission Computed Tomography (SPECT)(Bonte et al., 2001; Johnson et al., 1998) have highlighted loss of activity in temporal, parietal, and frontal association cortex, along with posterior cingulate cortex and precuneus.
More detailed inspection of the imaging studies, however, suggests regional differences in pathology. While medial temporal regions suffer devastating volumetric and neuronal loss, the presence of decreased metabolism is so difficult to detect that it is controversial, even without correction for reduced tissue volume(De Santi et al., 2001; Ishii et al., 1998a, b; Jagust et al., 1993; Matsuda et al., 2002a; Matsuda et al., 2002b; Mevel et al., 2007; Rodriguez et al., 2000). To further explore abnormalities of anatomy and function in the medial temporal lobes and other regions, we employed a whole-brain MRI technique for measurement of blood flow(Alsop and Detre, 1998; Alsop et al., 2000; Johnson et al., 2005; Sandson et al., 1996; Williams et al., 1992) in combination with anatomic MRI measures for imaging of patients diagnosed with probable AD and age matched controls.
METHODS
Studies were performed on 22 patients and 16 age matched control subjects. 21 of the patients were clinically diagnosed with probable Alzheimer’s disease at the time of imaging and met NINCDS-ADRA criteria(McKhann et al., 1984) for the diagnosis. The remaining patient was diagnosed with Mild Cognitive Impairment (MCI)(Petersen et al., 1999) at the time of imaging but was subsequently clinically diagnosed with AD 18 months after imaging. All subjects were studied following a protocol approved by the Committee on Clinical Investigations of Beth Israel Deaconess Medical Center and written consent was obtained from all subjects and caregivers when appropriate.
Subjects were excluded from the study if they had clinical depression, a history of brain trauma, epilepsy, or other neurological disorder. In addition, patients with significant vascular disease, either by history or by imaging (those with territorial infarcts, lacunar infarcts and marked white matter changes), were excluded. 73% of the AD patients were receiving stable doses of cholinesterase inhibitors, 32% were receiving selective serotonin reuptake inhibitors (for treatment of behavioral symptoms, none were clinically depressed), and 82% were receiving 800–1000 I.U. of vitamin E. None were receiving Memantine. Controls were recruited largely from the spouses of the patients or other patients at the same clinical service to minimize recruitment biases.
All subjects underwent cognitive testing that included the CERAD(Morris et al., 1989) battery. All but one control were native English speakers.
MRI was performed on a 3 Tesla whole body scanner (GE Medical Systems, Milwaukee WI) using the manufacturer’s circularly polarized, transmit-receive, birdcage head coil. Cerebral Blood Flow (CBF) was measured using the Arterial Spin Labeling (ASL) technique(Alsop and Detre, 1996; Williams et al., 1992). ASL employs externally applied magnetic fields to selectively alter the magnetic properties of the endogenous hydrogen nuclei of arterial blood water before they enter tissue. The change in signal of an MRI image resulting from ASL can be quantitatively related to CBF. ASL imaging was performed with a 3D Fast Spin Echo imaging sequence with a TR of 5s, and an echo train length of 26. The first two echoes were discarded and the remaining 24 echoes were centric encoded from the center of k-space out. The echo spacing was 7 ms and the effective echo time was 21 ms. Encoding of the two phase directions was performed along radial lines in k-space to provide repeated averaging of the low spatial frequency components of the blood flow signal. 96 radial arms were acquired to provide sufficient data for a 48×48×64 matrix and a 3.8 mm spatial resolution. Reconstruction was performed using a conventional regridding and Fourier transform algorithm.
Continuous ASL (Williams et al., 1992) was performed using flow driven adiabatic inversion and an improved version of a previously published method for subtracting off-resonance saturation effects(Alsop and Detre, 1998). Labeling was applied continuously for 1.5 s followed by a 1.5 s delay after labeling to allow all labeled blood to enter the tissue(Alsop and Detre, 1996). Suppression of background signal was achieved with selective saturation pulses at 4.3s, a selective inversion pulse at 3s, and nonselective inversion pulses at 1500, 764, 334 and 84ms before imaging. Label and control were alternately applied every 5s TR and the entire ASL sequence required 16.3 minutes. The label and control images were subtracted to produce ASL difference images.
For measurement of GM density and quantification of blood flow, a second, anatomical imaging acquisition with the identical imaging sequence was performed but with two inversion preparations replacing the ASL. These anatomical images should have nearly identical spatial resolution and point spread function as the blood flow images. One sequence used non selective saturation at 4.3s and inversion at 1.65 ms prior to imaging to acquire an image with cerebrospinal fluid (CSF) signal nulled. A second sequence with saturation at 4.3s and inversions at 2408 and 511 ms was designed to simultaneously null CSF and white matter and provide an approximate gray matter image(Bedell and Narayana, 1998; Redpath and Smith, 1994).
Image analysis was performed using SPM2 (Wellcome Department of Cognitive Neurology) with some supporting mathematical calculations performed with custom software. The signal equations for the two anatomic images were numerically solved to generate relative tissue water density and T1 maps. Because of the inversion recovery sequence chosen, CSF did not contribute to the tissue water density or T1 measurement in any voxel at least partially containing tissue. The tissue water density maps were corrected for slowly varying spatial nonuniformity of imaging sensitivity using the SPM2 remove bias function. The bias correction calculated for the water density maps was also applied to the ASL difference images. Because T1 of white matter tended to be shorter in the frontal regions, we also applied the bias correction to the T1 maps to provide a more uniform separation of white and gray matter.
Images were transformed to a standard space using the SPM2 normalization function with the standard defaults except for a specially constructed template image. Because the normalization sometimes failed due to extra-cerebral signal intensity, images from six of the controls were manually stripped of non-cerebral tissues and then normalized to the standard SPM2 T1 template. The mean of the stripped and spatially normalized images was then used as a template for successful normalization of all the subjects. The water density images were used for deriving the spatial transformation and then the water density, T1 and ASL difference images were resliced to the standard space. Because the nonlinear spatial normalization does not preserve density, the water density and ASL difference images were corrected for the spatial compression or expansion caused by the normalization using the modulated option of the SPM2 normalization(Good et al., 2001).
Separation of gray and white matter was performed using the SPM2 segmentation function on the T1 maps. Since the T1 measurement does not account for the fractional volume of tissue in each voxel, the gray matter segmentation map was then multiplied by the water density image to produce a gray matter concentration map. These gray matter maps were used both for calculation of regions of significant gray matter differences across groups and for comparison to flow changes between groups.
ASL difference images were converted to blood flow using previously published equations (Alsop and Detre, 1996; Chalela et al., 2000). It was assumed that labeled water did not reach the tissue so the T1 of blood could be used for quantification. Water concentration was referenced to deep white matter assuming a white matter water concentration of 80%(Herscovitch and Raichle, 1985). Since absolute blood flow was not used in subsequent analysis, only the T1 assumption could have an effect on the regional differences analyzed in this study.
Gray matter and blood flow maps from all subjects were normalized to the value measured in a region drawn in the primary visual cortex within the atlas space. While absolute blood flow and gray matter differences are potentially of interest, normalizing to visual cortex helps to reduce intersubject variation in resting flow. In addition, a manual step in setting the relative gain of the ASL and water density images occasionally appeared to be a source of error in absolute flow measurement for a few subjects. Because our ASL labeling was performed at the base of the cerebellum, imaging coverage of the cerebellum was variable and subject to systematic error. For this reason, the cerebellum was not used for flow normalization. The cerebellum was removed from the analysis by masking in the atlas space.
Blood flow images can show differences between groups either because the volume of brain tissue differs or because the blood flow per volume of tissue changes. Brain tissue loss is already detected through anatomic MRI, so we sought to test for changes in blood flow per volume of gray matter on a pixel by pixel basis. The atrophy corrected CBF is given by
where GM indicates the dimensionless fraction of the voxel occupied by gray matter. For voxel by voxel analysis, division by the gray matter fraction amplifies signals and errors in regions of low GM density. To avoid this, one can linearize this expression in changes of CBF and GM relative to the mean across subjects by taking the first term in the Taylor expansion.
where we define
and the line above the quantity indicates the mean over subjects. Since we are only interested in changes of the atrophy corrected flow from the mean, we can write
This expression no longer has individual subject GM in the denominator but the mean GM still strongly weights the results to places where GM concentration is low. To avoid this, we chose to multiply, or weight, the images by the square of the GM density to yield
For the SPM analysis, we used this linearized version of the true atrophy corrected CBF, weighted by the square of the mean gray matter density, as a mathematically better behaved indicator of changes in atrophy corrected CBF.
By definition, the mean value of the ΔCBFwlcorr images across all subjects is zero. If the mean value of CBF and GM are not significantly different from the controls, the ΔCBFwlcorr images will also not be. Even if the GM and CBF images are different from the controls, the ΔCBFwlcorr images will not be different if the fractional changes in GM and CBF are similar. Hence we refer to these images as a measure of CBF-atrophy mismatch.
Voxelwise statistical comparison between the AD group (n=22) and the controls (n=16) was performed using the SPM2 compare groups function. SPM2’s analysis for this model is a voxel by voxel one way analysis of variance (ANOVA). Since a one way ANOVA is equivalent to a two sample t-test, a t-statistic is derived for the “contrast” representing the difference between groups. The CBF, gray matter, and CBF-atrophy mismatch images, were smoothed with an 8mm FWHM Gaussian kernel and then tested for significant differences. The tests were thresholded at a significance of p<0.05 uncorrected for multiple comparisons across brain regions and only clusters with at least 2000 voxels were retained. A few of the retained clusters were not large enough to be formally significant according to the SPM model, and were removed by adjusting the cluster threshold until all remaining clusters were significant. To systematically identify the location of clusters, a toolbox for SPM, which calculates the percentage of the cluster in each of a number of predefined regions within the atlas(Tzourio-Mazoyer et al., 2002), was employed, and all regions containing at least 2% of each cluster were recorded.
In addition to the whole brain voxel based statistical analysis, a targeted region of interest analysis was performed in 4 a priori selected anatomic regions as defined by the template of Tzourio-Mazoyer et al.(Tzourio-Mazoyer et al., 2002): hippocampus, amygdala, parahippocampus, and precuneus. Left and right regions were averaged together. Significant differences between groups were calculated with the two-tailed Wilcoxon rank square test. Additionally, Stirling’s rank correlation was used to test for significant correlation between MMSE and regional values across subjects in the AD group only.
RESULTS
All 22 subjects diagnosed with AD and 16 controls successfully completed the study. A summary of subject information and cognitive testing performance is shown in Table 1. To determine changes with disease progression, a spectrum of patients from mild to severe disease were included, but the group was predominately mild, as indicated by the median MMSE of 24.
Table 1.
Subject Demographic and Clinical Information
| Control (n=16) | AD (n=22) | |
|---|---|---|
| Age in years (SD) | 72.6 (8.9) | 75.6# (9.2) |
| Sex (F:M) | 9:7 | 12:10 |
| Years of education (SD) | 14.4 (3.8) | 15.5# (3.2) |
| MMSE (SD) | 27.9 (2.6) | 22.2* (5.9) |
| ChEI treatment (%) | 0 | 16 (73%) |
| Vitamin E | 7 (44%) | 18 (82%) |
| Psychotrophic medications (antidepressants or antipsychotics) | 7 (32%) |
p<0.001 between group difference, two-tailed T-test
p>0.3 between group difference, two-tailed T-test
ASL CBF images of acceptable quality were obtained in all subjects. In the patients, temporoparietal hypoperfusion was apparent in most cases. In some of the mild patients, prominent hyperperfusion was observed within the medial temporal lobes, figure 1, sometimes extending backwards to the choroid plexus in the lateral ventricles. Not all of the mild patients exhibited such marked medial temporal hyperperfusion, however.
Figure 1. ASL Blood flow maps before atrophy correction in two subjects.
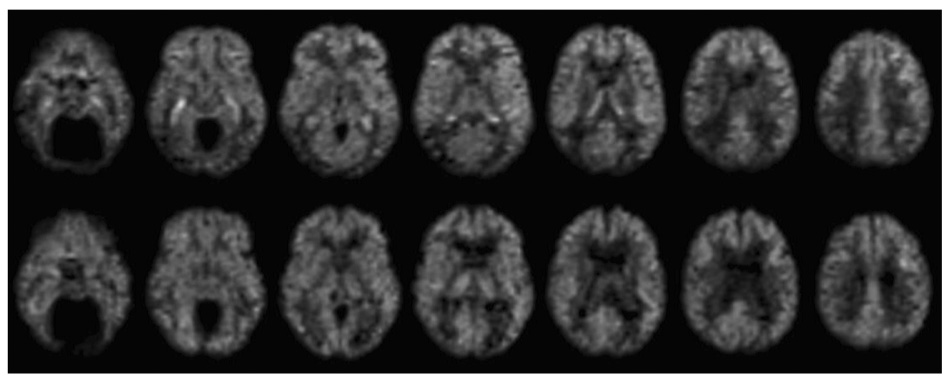
Images from a 73 year old male diagnosed with probable AD (MMSE 28), top row, demonstrate prominent hyperintensity in the hippocampal region bilaterally and reduced flow in the parietal and inferior temporal cortex, relative to 79 year old male control subject, bottom row.
Image based analysis of normalized CBF between groups revealed significant decreases in AD relative to controls in an extended cluster including precuneus and parietal cortex bilaterally and left inferior temporal cortex (Table 2 and figure 2a). No regions showed significant increases in the AD group relative to controls.
Table 2.
Clusters with significant decreases in visual cortex normalized CBF in AD relative to controls.
| N voxels | Max z | Max z position | Anatomic Locations | % | |
|---|---|---|---|---|---|
| Cluster 1 | 23412 | 4.08 | −10, −56, 20 | Precuneus_R | 8.30 |
| Precuneus_L | 6.87 | ||||
| Occipital_Mid_l | 6.68 | ||||
| Temporal_Inf_L | 5.58 | ||||
| Parieta_Sup_L | 4.49 | ||||
| Parieta_Sup_R | 4.32 | ||||
| Parietla_Inf_L | 3.67 | ||||
| Occipital_Mid_L | 3.22 | ||||
| Angular_R | 2.63 | ||||
| Fusiform_L | 2.54 | ||||
| Occipital_Sup_R | 2.46 | ||||
| Angular_L | 2.24 |
Figure 2. Regions significantly different between the AD group and controls.
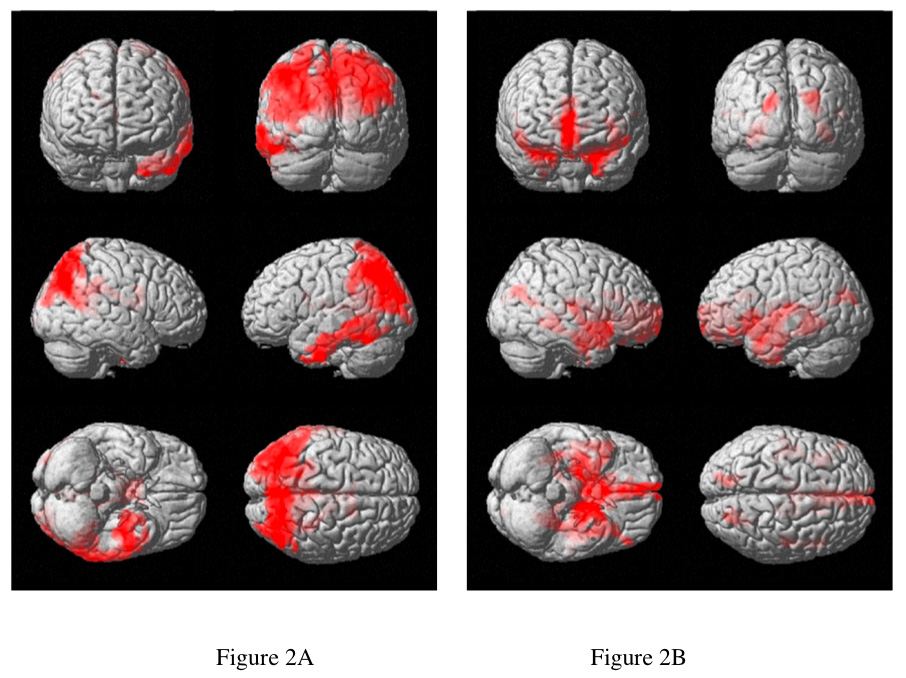

Surface projections of clusters with significantly decreased CBF (A) and GM density (B) highlight very different brain regions. Analysis of CBF-atrophy mismatch (C), shows where regions of more greatly decreased CBF (red) and more greatly decreased GM density(green) were found. The region of most significant CBF-atrophy mismatch was the hippocampus (D), as indicated by the value of the T statistic shown on the color scale.
Comparison of gray matter density between the AD group and controls showed decreased gray matter density bilaterally in regions including anterior cingulate, hippocampus and parahippocampus, and the left insula, Table 3 and figure 2b. These areas are known to be primary areas of atrophy in AD(Baron et al., 2001; Killiany et al., 2000). Two significant clusters of increased GM density were also found in the right temporal and frontal lobes. This unexpected finding will be considered in the discussion.
Table 3.
Clusters with significant differences in visual cortex normalized GM density in AD relative to controls.
| Decreases | N voxels | Max z | Max z position | Anatomic Locations | % |
|---|---|---|---|---|---|
| cluster 1 | 15842 | 4.86 | −20, 8, −32 | Insula_L | 4.82 |
| Cingulum_Ant_R | 4.57 | ||||
| ParaHippocampal_L | 3.85 | ||||
| Hippocampus_l | 3.76 | ||||
| Hippocampus_R | 3.63 | ||||
| ParaHippocampal_R | 3.52 | ||||
| Frontal_Med_Orb_R | 3.35 | ||||
| Cingulum_Ant_L | 3.33 | ||||
| Fusiform_L | 3.00 | ||||
| Thalamus_R | 2.99 | ||||
| Caudate_R | 2.58 | ||||
| Temporal_Pole_Sup_R | 2.55 | ||||
| Temporal_Pole_Sup_L | 2.08 | ||||
| Thalamus_L | 2.05 |
| Increases | N voxels | Max z | Max z position | Anatomic Locations | % |
|---|---|---|---|---|---|
| cluster 1 | 14978 | 3.99 | 66 −36 −16 | Temporal_Mid_R | 20.38 |
| Temporal_Inf_R | 14.12 | ||||
| Temporal_Sup_R | 8.38 | ||||
| Angular_R | 7.63 | ||||
| Postcentral_R | 6.23 | ||||
| Occipital_Mid_R | 6.18 | ||||
| Fusiform_R | 2.5 | ||||
| Parietal_Sup_R | 2.28 | ||||
| Temporal_Pole_Mid_R | 2.17 | ||||
| cluster 2 | 3931 | 3.23 | 32 15 30 | Frontal_Mid_R | 32.15 |
| Frontal_Inf_Tri_R | 21.5 | ||||
| Frontal_Inf_Orb_R | 8.37 | ||||
| Frontal_Sup_R | 5.21 | ||||
| Frontal_inf_Oper_R | 4.86 | ||||
| Precentral_R | 2.93 |
Significant mismatches in blood flow and atrophy changes between groups were detected. CBF-atrophy mismatch was significantly lower in the inferior temporal lobes, precuneus, and superior parietal lobes, indicating greater reduction of CBF than GM. CBF-atrophy mismatch was significantly higher in the AD group in hippocampus, parahippocampus, caudate, and the superior regions of the anterior temporal lobes (table 4 and figure 2c and 2d), indicating greater reduction of GM than CBF.
Table 4.
Clusters where a significant difference of the CBF-atrophy mismatch measure between AD subjects and controls was detected. An increase means greater GM density decrease than CBF decrease in AD. A decrease means greater CBF decrease than GM density decrease.
| Decreases | N voxels | Max z | Max z position | Anatomic Locations | % |
|---|---|---|---|---|---|
| Cluster 1 | 38475 | 4.73 | −44, −8, −38 | Temporal_Inf_R | 6.95 |
| Temporal_Inf_L | 6.85 | ||||
| Temporal_Mid_R | 5.77 | ||||
| Occipital_Mid_L | 5.48 | ||||
| Precuneus_R | 4.64 | ||||
| Precuneus_L | 4.5 | ||||
| Temporal_Mid_L | 4.41 | ||||
| Angular_R | 4.07 | ||||
| Occipital_Mid_R | 3.97 | ||||
| Parietal_Sup_R | 3.15 | ||||
| Parietal_Sup_L | 2.85 | ||||
| Angular_L | 2.26 | ||||
| Parietal_Inf_L | 2.24 |
| Increases | N voxels | Max z | Max z position | Anatomic Locations | % |
|---|---|---|---|---|---|
| cluster 1 | 13046 | 4.32 | 38, −38, −2 | Caudate_R | 6.02 |
| Temporal_Pole_Sup_R | 5.29 | ||||
| Hippocampus_R | 4.78 | ||||
| Parahippocampal_R | 4.57 | ||||
| Hippocampus_L | 4.32 | ||||
| Caudate_L | 3.27 | ||||
| Parahippocampal_L | 3.25 | ||||
| Temporal_Pole_Sup_L | 3.09 | ||||
| Temporal_Sup_R | 3.09 | ||||
| Temporal_Sup_L | 3.09 | ||||
| Cingulum_Ant_R | 2.41 |
Region of interest analysis in the medial temporal lobes and precuneus support the findings described above (Table 5). Uncorrected hippocampal CBF was non-significantly increased (~5%) in the AD group compared to controls but when corrected for atrophy, CBF was a significant 25% higher. CBF decrease in the precuneus was much greater than any gray matter loss. Most region of interest measures were not significantly correlated with MMSE within the AD group except for hippocampal volume decrease. Precuneus CBF decrease approached significance.
Table 5.
Average CBF and GM Values in Selected Region
| hippocampus | amygdale | parahippocampus | precuneus | |
|---|---|---|---|---|
| GM | ||||
| (% of visual cortex) | ||||
| mean AD (sd) | 109.5 (15.3) | 174.7 (14.2) | 128.9 (17.2) | 123.9 (11.6) |
| mean CN (sd) | 127.3 (10.6) | 194.2 (10.0) | 148.0 (9.8) | 121.8 (12.9) |
| Ratio | 0.860 | 0.900 | 0.871 | 1.017 |
| Prob. of difference | 0.0003 | 0.00004 | 0.0003 | 0.38 |
| Prob. of MMSE | ||||
| corr. within AD grp. | 0.004 (pos) | 0.20 (pos) | 0.10 (pos) | 0.07 (pos) |
| CBF | ||||
| (% of visual cortex) | ||||
| mean AD (sd) | 102.9 (23.5) | 105.7 (29.7) | 93.3 (18.8) | 79.0 (15.8) |
| mean CN (sd) | 97.2 (21.8) | 100.5 (22.6) | 91.0 (17.8) | 89.1 (12.7) |
| ratio | 1.059 | 1.052 | 1.025 | 0.887 |
| Prob. of difference | 0.19 | 0.32 | 0.24 | 0.017 |
| Prob. of MMSE | ||||
| corr. within AD grp. | 0.76 (neg) | 0.72 (neg) | 0.80 (neg) | 0.08 (pos) |
| CBF/GM | ||||
| mean AD (sd) | 0.96 (0.29) | 0.61 (0.19) | 0.74 (0.20) | 0.64 (0.14) |
| mean CN (sd) | 0.77 (0.17) | 0.52 (0.11) | 0.62 (0.14) | 0.75 (0.17) |
| ratio | 1.247 | 1.173 | 1.194 | 0.853 |
| Prob. of difference | 0.008 | 0.043 | 0.017 | 0.031 |
| Prob. of MMSE | ||||
| corr. within AD grp. | 0.11 (neg) | 0.20 (neg) | 0.28 (neg) | 0.12 (pos) |
DISCUSSION
While our results largely confirm prior functional imaging and atrophy studies, these combined results emphasize the elevation of blood flow in the hippocampus even early in Alzheimer’s disease. While most prior studies using PET or SPECT for the measurement of blood flow have not highlighted this phenomenon, our findings are not irreconcilable. Most PET or SPECT flow studies do not correct for the severe atrophy which occurs in the medial temporal lobes early in the disease(Bonte et al., 2001; Matsuda et al., 2002b) yet they fail to show significant decreases of flow in the medial temporal lobes. A recent PET blood flow(Scarmeas et al., 2004) study used a covariance analysis to find elevation of flow in parahippocampus and other nearby structures that was diagnostic for AD and cognitive impairment. Any remaining discrepancies may be explained by methodological limitations. PET studies with H2O15 are prone to underestimate flow in regions with high flow both because of the limited permeability of water through the microvasculature(Berridge et al., 1991) and because of limited spatial resolution(Iida et al., 2000). Though ASL also uses water as a tracer, it is much less affected by water permeability because of the timescales of imaging and tracer decay(Buxton et al., 1998). SPECT also can suffer from saturation effects in the uptake of tracer(Tsuchida et al., 1996) and its lower spatial resolution might partially conceal this phenomenon.
Since our CBF findings in the hippocampus were unremarkable until after atrophy correction, the meaning of atrophy correction is worthy of discussion. Changes in functional images can be caused by altered activity per volume of gray matter or by altered amounts of gray matter. The meaning of blood flow increases or decrease can become uncertain in this context. Part of this uncertainty relates to the definition of tissue specific activity. CBF, for example, is the volume of blood flowing through a mass of tissue per unit time. In imaging studies, typically density changes are neglected and the volume of tissue in each voxel is assumed to be equal to the volume of the voxel. CSF and white matter are much less metabolically active than gray matter, however, so it would usually be more appropriate to assign the volume of tissue in each voxel to be the volume of gray matter. The atrophy corrected CBF used in this study is the imaged CBF divided by the volume of gray matter in each voxel. The CBF-atrophy mismatch measure used for SPM analysis is closely related. Today, with the high quality of anatomic imaging and statistical techniques for voxel based morphometry(VBM), one could argue that functional measures are primarily of interest when the atrophy corrected CBF differs from normal.
Otherwise functional changes simply mirror tissue loss and VBM could just be used. For example, in our study, flow decrease exceeded gray matter loss in the precuneus. This suggests decreased activity of the tissue and added value of CBF imaging over VBM. In other pathologies, blood flow and gray matter loss tend to go together, so the blood flow measure provides little additional information. When applied to the medial temporal lobes in this study, however, atrophy correction shows that flow is paradoxically high for the reduced amount of metabolic tissue present. This implies a lower, tissue specific CBF in gray matter. As discussed below, this has important implications. In contrast, if uncorrected CBF decreased proportional to the gray matter loss, and consequently atrophy corrected CBF was unchanged, this would suggest little additional information in the CBF.
Whether this elevated flow is coupled to elevated metabolism is not certain. FDG PET studies typically do not detect changes in glucose consumption in the medial temporal lobes without atrophy correction. Some targeted studies with high resolution PET have shown no significant differences in glucose consumption(Ishii et al., 1998b; Jagust et al., 1993) while some have reported small declines after correction for age and gender(De Santi et al., 2001). Post-mortem studies of cytochrome oxidase concentration, which typically mirrors metabolic activity, are also conflicting. One spectrophotometric study found a nonsignificant 20% elevation in Alzheimer’s disease(Kish et al., 1992), while other studies using histochemical methods found decreases(Simonian and Hyman, 1993). One possible explanation for a partial decoupling of flow and metabolism is the release of nitric oxide, a potent vasodilator, which can occur during inflammation(Haas et al., 2002) and in connection with NMDA receptor signaling and plastic remodeling(Brenman and Bredt, 1997). Significant reduction of medial temporal oxygen metabolism in the absence of significant decrease of flow has been reported in AD(Ishii et al., 1996), suggesting decoupling of flow and metabolism.
Our finding of two clusters of elevated gray matter density in right temporal and frontal cortex of the AD subjects compared to controls is difficult to explain based on existing literature. The effect is small at each voxel, but significant based on the large number of voxels in the clusters. It could result from a methodological error in the process of normalizing and segmenting the images for analysis, perhaps due to a systematic effect of global atrophy on segmentation thresholds. Alternatively it could result from group differences unrelated to AD linked to recruitment or diagnosis biases. Finally, it could indicate slower GM volume loss in these regions than in the primary visual cortex. The significant effect is reported here for completeness.
In some of the AD subjects, the hyperperfusion in the hippocampal region extended posteriorly into what was apparently choroid plexus. Because of the limited spatial resolution of our study, we cannot exclude the possibility that the thin section of choroid plexus that runs immediately adjacent to the hippocampus is a contributor to the blood flow signal observed in the hippocampal region of all the AD patients. However, the hyperperfusion is much more statistically significant in the hippocampal region than in any other location adjacent to the choroid plexus. Since the hippocampus is in direct physical contact with the choroid plexus, it is plausible that products of hippocampal activity, such as nitric oxide or estrogen(Mukai et al., 2006), could stimulate increased flow in the neighboring choroid plexus as well(Faraci and Heistad, 1992).
While the hippocampus is devastatingly damaged in Alzheimer’s Disease, there is growing evidence of elevated neuronal plasticity in the relatively well preserved dentate gyrus region(Geddes et al., 1985; Jin et al., 2004; Mikkonen et al., 1999). The dentate gyrus receives excitatory inputs from the entorhinal cortex through the perforant pathway in the subiculum and outputs through the CA3 to the CA1 region. The entorhinal cortex and the subiculum/CA1 regions are the first sites of neurofibrillary tangle formation in AD(Braak and Braak, 1991) and severe neuronal loss also occurs(GomezIsla et al., 1996; West et al., 1994). It is plausible that disconnection induces elevated activity in the dentate gyrus region that is merely a side effect of the primary pathology of AD. A provocative alternative, however, is that hyperactivity of the dentate gyrus region reflects a pathologic form of plasticity that spreads damage to afferents and efferents through excitotoxic and other mechanisms(Mesulam, 2000).
Outside of the hippocampus, elevated flow per tissue volume was seen in the parahippocampal gyrus, the superior temporal pole, and the anterior cingulate regions. These are all regions where gray matter loss occurs in early AD(Baron et al., 2001; Chetelat et al., 2002) but are not generally regions where neurofibrillary pathology or plaque formation is concentrated(Braak and Braak, 1991).
Interestingly, the areas of early tissue loss(Chetelat et al., 2002) and elevated flow coincide with the paths of the major cerebral vessels and their first few branches. While perhaps a coincidence, this spatial distribution suggests that the large cerebral vessels might be a source of toxicity that initiates AD. This would be consistent with the overlap between vascular disease risk factors and AD risk factors(De La Torre, 2002). Permeability of these vessels to neurotoxic substances such as metal ions might increase with age because of their high physical stress from pulsatile flow and the presence of atherosclerotic disease(Roher et al., 2003) and because blood brain barrier repair mechanisms, possibly including amyloid deposition, are less effective in the large vessels(Atwood et al., 2003). Elevated concentrations of metal ions have been shown to induce rapid aggregation of amyloid and might stimulate amyloid production(Bush, 2003). Our finding of elevated flow in the medial temporal lobes and other regions is in disagreement, however, with theories of chronic hypoperfusion as a primary mechanism of AD(De La Torre, 2002). Severely reduced blood flow was observed in cortical association areas but not in the medial temporal lobes where the earliest Alzheimer’s pathology is believed to occur.
The prominent hypoperfusion in the inferior temporal and parietal areas is a consistent finding of functional imaging studies that does not strongly correlate with tissue loss in these regions. Primate studies have shown that experimental damage to the entorhinal cortex(Meguro et al., 1999), and possibly the basal forebrain(Kiyosawa et al., 1989; Le Mestric et al., 1998), induces similar hypometabolism in the cortex. This hypoperfusion may thus serve more as a distant indicator of medial temporal lobe damage than as a marker of local tissue pathology.
In summary, ASL MRI results in Alzheimer’s disease demonstrate hyperperfusion in the hippocampus and, to a lesser extent, in other brain regions, that suggest hyperactivity. The increase in atrophy-corrected blood flow has implications for the pathophysiology in this region. ASL blood flow MRI offers a unique opportunity to monitor these hippocampal changes with disease progression and with potential interventions.
ACKNOWLEDGEMENTS
This work was supported in part by a research grant from the Alzheimer’s Association, and by the National Institutes of Health through grants AG19599, MH65434, and NS047431.
Footnotes
Publisher's Disclaimer: This is a PDF file of an unedited manuscript that has been accepted for publication. As a service to our customers we are providing this early version of the manuscript. The manuscript will undergo copyediting, typesetting, and review of the resulting proof before it is published in its final citable form. Please note that during the production process errors may be discovered which could affect the content, and all legal disclaimers that apply to the journal pertain.
References
- Alsop DC, Detre JA. Reduced Transit-Time Sensitivity in Non-invasive Magnetic Resonance Imaging of Human Cerebral Blood Flow. J Cereb Blood Flow Metab. 1996;16:1236–1249. doi: 10.1097/00004647-199611000-00019. [DOI] [PubMed] [Google Scholar]
- Alsop DC, Detre JA. Multisection Cerebral Blood Flow MR Imaging with Continuous Arterial Spin Labeling. Radiology. 1998;208:410–416. doi: 10.1148/radiology.208.2.9680569. [DOI] [PubMed] [Google Scholar]
- Alsop DC, Detre JA, Grossman M. Assessment of cerebral blood flow in Alzheimer's disease by spin-labeled magnetic resonance imaging. Ann Neurol. 2000;47:93–100. [PubMed] [Google Scholar]
- Atwood CS, Bowen RL, Smith MA, Perry G. Cerebrovascular requirement for sealant, anti-coagulant and remodeling molecules that allow for the maintenance of vascular integrity and blood supply. Brain Res Brain Res Rev. 2003;43:164–178. doi: 10.1016/s0165-0173(03)00206-6. [DOI] [PubMed] [Google Scholar]
- Baron JC, Chetelat G, Desgranges B, Perchey G, Landeau B, de la Sayette V, Eustache F. In vivo mapping of gray matter loss with voxel-based morphometry in mild Alzheimer's disease. Neuroimage. 2001;14:298–309. doi: 10.1006/nimg.2001.0848. [DOI] [PubMed] [Google Scholar]
- Bedell BJ, Narayana PA. Volumetric analysis of white matter, gray matter, and CSF using fractional volume analysis. Magn Reson Med. 1998;39:961–969. doi: 10.1002/mrm.1910390614. [DOI] [PubMed] [Google Scholar]
- Berridge MS, Adler LP, Nelson AD, Cassidy EH, Muzic RF, Bednarczyk EM, Miraldi F. Measurement of human cerebral blood flow with [15O]butanol and positron emission tomography. J Cereb Blood Flow Metab. 1991;11:707–715. doi: 10.1038/jcbfm.1991.127. [DOI] [PubMed] [Google Scholar]
- Bonte FJ, Weiner MF, Bigio EH, White CL., 3rd SPECT imaging in dementias. J Nucl Med. 2001;42:1131–1133. [PubMed] [Google Scholar]
- Braak H, Braak E. Neuropathological Staging of Alzheimer-Related Changes. Acta Neuropathol. 1991;82:239–259. doi: 10.1007/BF00308809. [DOI] [PubMed] [Google Scholar]
- Brenman JE, Bredt DS. Synaptic signaling by nitric oxide. Curr Opin Neurobiol. 1997;7:374–378. doi: 10.1016/s0959-4388(97)80065-7. [DOI] [PubMed] [Google Scholar]
- Bush AI. The metallobiology of Alzheimer's disease. Trends Neurosci. 2003;26:207–214. doi: 10.1016/S0166-2236(03)00067-5. [DOI] [PubMed] [Google Scholar]
- Buxton RB, Frank LR, Wong EC, Siewert B, Warach S, Edelman RR. A general kinetic model for quantitative perfusion imaging with arterial spin labeling. Magn Reson Med. 1998;40:383–396. doi: 10.1002/mrm.1910400308. [DOI] [PubMed] [Google Scholar]
- Chalela JA, Alsop DC, Gonzalez-Atavales JB, Maldjian JA, Kasner SE, Detre JA. Magnetic resonance perfusion imaging in acute ischemic stroke using continuous arterial spin labeling. Stroke. 2000;31:680–687. doi: 10.1161/01.str.31.3.680. [DOI] [PubMed] [Google Scholar]
- Chetelat G, Desgranges B, De La Sayette V, Viader F, Eustache F, Baron JC. Mapping gray matter loss with voxel-based morphometry in mild cognitive impairment. Neuroreport. 2002;13:1939–1943. doi: 10.1097/00001756-200210280-00022. [DOI] [PubMed] [Google Scholar]
- De La Torre JC. Vascular basis of Alzheimer's pathogenesis. Ann N Y Acad Sci. 2002;977:196–215. doi: 10.1111/j.1749-6632.2002.tb04817.x. [DOI] [PubMed] [Google Scholar]
- De Santi S, de Leon MJ, Rusinek H, Convit A, Tarshish CY, Roche A, Tsui WH, Kandil E, Boppana M, Daisley K, Wang GJ, Schlyer D, Fowler J. Hippocampal formation glucose metabolism and volume losses in MCI and AD. Neurobiol Aging. 2001;22:529–539. doi: 10.1016/s0197-4580(01)00230-5. [DOI] [PubMed] [Google Scholar]
- Faraci FM, Heistad DD. Does basal production of nitric oxide contribute to regulation of brain-fluid balance? Am J Physiol. 1992;262:H340–H344. doi: 10.1152/ajpheart.1992.262.2.H340. [DOI] [PubMed] [Google Scholar]
- Friedland RP, Budinger TF, Ganz E, Yano Y, Mathis CA, Koss B, Ober BA, Huesman RH, Derenzo SE. Regional cerebral metabolic alterations in dementia of the Alzheimer type: positron emission tomography with [18F]fluorodeoxyglucose. J Comput Assist Tomogr. 1983;7:590–598. doi: 10.1097/00004728-198308000-00003. [DOI] [PubMed] [Google Scholar]
- Geddes JW, Monaghan DT, Cotman CW, Lott IT, Kim RC, Chui HC. Plasticity of hippocampal circuitry in Alzheimer's disease. Science. 1985;230:1179–1181. doi: 10.1126/science.4071042. [DOI] [PubMed] [Google Scholar]
- GomezIsla T, Price JL, McKeel DW, Morris JC, Growdon JH, Hyman BT. Profound loss of layer II entorhinal cortex neurons occurs in very mild Alzheimer's disease. J Neurosci. 1996;16:4491–4500. doi: 10.1523/JNEUROSCI.16-14-04491.1996. [DOI] [PMC free article] [PubMed] [Google Scholar]
- Good CD, Johnsrude IS, Ashburner J, Henson RN, Friston KJ, Frackowiak RS. A voxel-based morphometric study of ageing in 465 normal adult human brains. Neuroimage. 2001;14:21–36. doi: 10.1006/nimg.2001.0786. [DOI] [PubMed] [Google Scholar]
- Haas J, Storch-Hagenlocher B, Biessmann A, Wildemann B. Inducible nitric oxide synthase and argininosuccinate synthetase: co-induction in brain tissue of patients with Alzheimer's dementia and following stimulation with beta-amyloid 1–42 in vitro. Neurosci Lett. 2002;322:121–125. doi: 10.1016/s0304-3940(02)00095-2. [DOI] [PubMed] [Google Scholar]
- Herscovitch P, Raichle ME. What is the correct value for the brain--blood partition coefficient for water? J Cereb Blood Flow Metab. 1985;5:65–69. doi: 10.1038/jcbfm.1985.9. [DOI] [PubMed] [Google Scholar]
- Iida H, Law I, Pakkenberg B, Krarup-Hansen A, Eberl S, Holm S, Hansen AK, Gundersen HJ, Thomsen C, Svarer C, Ring P, Friberg L, Paulson OB. Quantitation of regional cerebral blood flow corrected for partial volume effect using O-15 water and PET: I. Theory, error analysis, and stereologic comparison. J Cereb Blood Flow Metab. 2000;20:1237–1251. doi: 10.1097/00004647-200008000-00009. [DOI] [PubMed] [Google Scholar]
- Ishii K, Kitagaki H, Kono M, Mori E. Decreased medial temporal oxygen metabolism in Alzheimer's disease shown by PET. J Nucl Med. 1996;37:1159–1165. [PubMed] [Google Scholar]
- Ishii K, Sasaki M, Yamaji S, Sakamoto S, Kitagaki H, Mori E. Paradoxical hippocampus perfusion in mild-to-moderate Alzheimer's disease. J Nucl Med. 1998a;39:293–298. [PubMed] [Google Scholar]
- Ishii K, Sasaki M, Yamaji S, Sakamoto S, Kitagaki H, Mori E. Relatively preserved hippocampal glucose metabolism in mild Alzheimer's disease. Dement Geriatr Cogn Disord. 1998b;9:317–322. doi: 10.1159/000017083. [DOI] [PubMed] [Google Scholar]
- Jack CR, Petersen RC, Xu YC, O'Brien PC, Smith GE, Ivnik RJ, Boeve BF, Waring SC, Tangalos EG, Kokmen E. Prediction of AD with MRI-based hippocampal volume in mild cognitive impairment. Neurology. 1999;52:1397–1403. doi: 10.1212/wnl.52.7.1397. [DOI] [PMC free article] [PubMed] [Google Scholar]
- Jagust WJ, Eberling JL, Richardson BC, Reed BR, Baker MG, Nordahl TE, Budinger TF. The Cortical Topography of Temporal-Lobe Hypometabolism in Early Alzheimers-Disease. Brain Res. 1993;629:189–198. doi: 10.1016/0006-8993(93)91320-r. [DOI] [PubMed] [Google Scholar]
- Jin K, Peel AL, Mao XO, Xie L, Cottrell BA, Henshall DC, Greenberg DA. Increased hippocampal neurogenesis in Alzheimer's disease. Proc Natl Acad Sci U S A. 2004;101:343–347. doi: 10.1073/pnas.2634794100. [DOI] [PMC free article] [PubMed] [Google Scholar]
- Johnson KA, Jones K, Holman BL, Becker JA, Spiers PA, Satlin A, Albert MS. Preclinical prediction of Alzheimer's disease using SPECT. Neurology. 1998;50:1563–1571. doi: 10.1212/wnl.50.6.1563. [DOI] [PubMed] [Google Scholar]
- Johnson NA, Jahng GH, Weiner MW, Miller BL, Chui HC, Jagust WJ, Gorno-Tempini ML, Schuff N. Pattern of cerebral hypoperfusion in Alzheimer disease and mild cognitive impairment measured with arterial spin-labeling MR imaging: initial experience. Radiology. 2005;234:851–859. doi: 10.1148/radiol.2343040197. [DOI] [PMC free article] [PubMed] [Google Scholar]
- Juottonen K, Laakso MP, Insausti R, Lehtovirta M, Pitkanen A, Partanen K, Soininen H. Volumes of the entorhinal and perirhinal cortices in Alzheimer's disease. Neurobiol Aging. 1998;19:15–22. doi: 10.1016/s0197-4580(98)00007-4. [DOI] [PubMed] [Google Scholar]
- Killiany RJ, Gomez-Isla T, Moss M, Kikinis R, Sandor T, Jolesz F, Tanzi R, Jones K, Hyman BT, Albert MS. Use of structural magnetic resonance imaging to predict who will get Alzheimer's disease. Ann Neurol. 2000;47:430–439. [PubMed] [Google Scholar]
- Kish SJ, Bergeron C, Rajput A, Dozic S, Mastrogiacomo F, Chang LJ, Wilson JM, DiStefano LM, Nobrega JN. Brain cytochrome oxidase in Alzheimer's disease. J Neurochem. 1992;59:776–779. doi: 10.1111/j.1471-4159.1992.tb09439.x. [DOI] [PubMed] [Google Scholar]
- Kiyosawa M, Baron JC, Hamel E, Pappata S, Duverger D, Riche D, Mazoyer B, Naquet R, MacKenzie ET. Time course of effects of unilateral lesions of the nucleus basalis of Meynert on glucose utilization by the cerebral cortex. Positron tomography in baboonsq. Brain. 1989;112(Pt 2):435–455. doi: 10.1093/brain/112.2.435. [DOI] [PubMed] [Google Scholar]
- Le Mestric C, Chavoix C, Chapon F, Mezenge F, Epelbaum J, Baron JC. Effects of damage to the basal forebrain on brain glucose utilization: a reevaluation using positron emission tomography in baboons with extensive unilateral excitotoxic lesion. J Cereb Blood Flow Metab. 1998;18:476–490. doi: 10.1097/00004647-199805000-00003. [DOI] [PubMed] [Google Scholar]
- Matsuda H, Kanetaka H, Ohnishi T, Asada T, Imabayashi E, Nakano S, Katoh A, Tanaka F. Brain SPET abnormalities in Alzheimer's disease before and after atrophy correction. Eur J Nucl Med Mol Imaging. 2002a;29:1502–1505. doi: 10.1007/s00259-002-0930-2. [DOI] [PubMed] [Google Scholar]
- Matsuda H, Kitayama N, Ohnishi T, Asada T, Nakano S, Sakamoto S, Imabayashi E, Katoh A. Longitudinal evaluation of both morphologic and functional changes in the same individuals with Alzheimer's disease. J Nucl Med. 2002b;43:304–311. [PubMed] [Google Scholar]
- McKhann G, Drachmann D, Folstein M, Katzman R, Price D, Stadian EM. Clinical diagnosis of Alzheimer's disease: Report on the NINCDS-ADRDA work group under the auspices of the Department of Health and Human Services Task Force on Alzheimer's disease. Neurology. 1984;34:939–944. doi: 10.1212/wnl.34.7.939. [DOI] [PubMed] [Google Scholar]
- Meguro K, Blaizot X, Kondoh Y, Le Mestric C, Baron JC, Chavoix C. Neocortical and hippocampal glucose hypometabolism following neurotoxic lesions of the entorhinal and perirhinal cortices in the nonhuman primate as shown by PET - Implications for Alzheimer's disease. Brain. 1999;122:1519–1531. doi: 10.1093/brain/122.8.1519. [DOI] [PubMed] [Google Scholar]
- Mesulam MM. A plasticity-based theory of the pathogenesis of Alzheimer's disease. Ann N Y Acad Sci. 2000;924:42–52. doi: 10.1111/j.1749-6632.2000.tb05559.x. [DOI] [PubMed] [Google Scholar]
- Mevel K, Desgranges B, Baron JC, Landeau B, De la Sayette V, Viader F, Eustache F, Chetelat G. Detecting hippocampal hypometabolism in Mild Cognitive Impairment using automatic voxel-based approaches. Neuroimage. 2007 doi: 10.1016/j.neuroimage.2007.04.048. [DOI] [PubMed] [Google Scholar]
- Mikkonen M, Soininen H, Tapiola T, Alafuzoff I, Miettinen R. Hippocampal plasticity in Alzheimer's disease: changes in highly polysialylated NCAM immunoreactivity in the hippocampal formation. Eur J Neurosci. 1999;11:1754–1764. doi: 10.1046/j.1460-9568.1999.00593.x. [DOI] [PubMed] [Google Scholar]
- Morris JC, Heyman A, Mohs RC, Hughes JP, van Belle G, Fillenbaum G, Mellits ED, Clark C. The Consortium to Establish a Registry for Alzheimer's Disease (CERAD). Part I. Clinical and neuropsychological assessment of Alzheimer's disease. Neurology. 1989;39:1159–1165. doi: 10.1212/wnl.39.9.1159. [DOI] [PubMed] [Google Scholar]
- Mukai H, Takata N, Ishii HT, Tanabe N, Hojo Y, Furukawa A, Kimoto T, Kawato S. Hippocampal synthesis of estrogens and androgens which are paracrine modulators of synaptic plasticity: synaptocrinology. Neuroscience. 2006;138:757–764. doi: 10.1016/j.neuroscience.2005.09.010. [DOI] [PubMed] [Google Scholar]
- Petersen RC, Smith GE, Waring SC, Ivnik RJ, Tangalos EG, Kokmen E. Mild cognitive impairment - Clinical characterization and outcome. Arch Neurol. 1999;56:303–308. doi: 10.1001/archneur.56.3.303. [DOI] [PubMed] [Google Scholar]
- Redpath TW, Smith FW. Technical note: use of a double inversion recovery pulse sequence to image selectively grey or white brain matter. Br J Radiol. 1994;67:1258–1263. doi: 10.1259/0007-1285-67-804-1258. [DOI] [PubMed] [Google Scholar]
- Reiman EM, Caselli RJ, Yun LS, Chen KW, Bandy D, Minoshima S, Thibodeau SN, Osborne D. Preclinical evidence of Alzheimer's disease in persons homozygous for the epsilon 4 allele for apolipoprotein E. N Engl J Med. 1996;334:752–758. doi: 10.1056/NEJM199603213341202. [DOI] [PubMed] [Google Scholar]
- Rodriguez G, Vitali P, Calvini P, Bordoni C, Girtler N, Taddei G, Mariani G, Nobili F. Hippocampal perfusion in mild Alzheimer's disease. Psychiatry Res. 2000;100:65–74. doi: 10.1016/s0925-4927(00)00071-8. [DOI] [PubMed] [Google Scholar]
- Roher AE, Esh C, Kokjohn TA, Kalback W, Luehrs DC, Seward JD, Sue LI, Beach TG. Circle of willis atherosclerosis is a risk factor for sporadic Alzheimer's disease. Arterioscler Thromb Vasc Biol. 2003;23:2055–2062. doi: 10.1161/01.ATV.0000095973.42032.44. [DOI] [PubMed] [Google Scholar]
- Sandson TA, O'Connor M, Sperling RA, Edelman RR, Warach S. Noninvasive perfusion MRI in Alzheimer's disease: a preliminary report. Neurology. 1996;47:1339–1342. doi: 10.1212/wnl.47.5.1339. [DOI] [PubMed] [Google Scholar]
- Scarmeas N, Habeck CG, Zarahn E, Anderson KE, Park A, Hilton J, Pelton GH, Tabert MH, Honig LS, Moeller JR, Devanand DP, Stern Y. Covariance PET patterns in early Alzheimer's disease and subjects with cognitive impairment but no dementia: utility in group discrimination and correlations with functional performance. Neuroimage. 2004;23:35–45. doi: 10.1016/j.neuroimage.2004.04.032. [DOI] [PMC free article] [PubMed] [Google Scholar]
- Simonian NA, Hyman BT. Functional alterations in Alzheimer's disease: diminution of cytochrome oxidase in the hippocampal formation. J Neuropathol Exp Neurol. 1993;52:580–585. [PubMed] [Google Scholar]
- Small GW, Mazziotta JC, Collins MT, Baxter LR, Phelps ME, Mandelkern MA, Kaplan A, Larue A, Adamson CF, Chang L, Guze BH, Corder EH, Saunders AM, Haines JL, Pericakvance MA, Roses AD. Apolipoprotein-E Type-4 Allele and Cerebral Glucose-Metabolism in Relatives at Risk for Familial Alzheimer-Disease. JAMA. 1995;273:942–947. [PubMed] [Google Scholar]
- Tsuchida T, Yonekura Y, Nishizawa S, Sadato N, Tamaki N, Fujita T, Magata Y, Konishi J. Nonlinearity correction of brain perfusion SPECT based on permeability-surface area product model. J Nucl Med. 1996;37:1237–1241. [PubMed] [Google Scholar]
- Tzourio-Mazoyer N, Landeau B, Papathanassiou D, Crivello F, Etard O, Delcroix N, Mazoyer B, Joliot M. Automated anatomical labeling of activations in SPM using a macroscopic anatomical parcellation of the MNI MRI single-subject brain. Neuroimage. 2002;15:273–289. doi: 10.1006/nimg.2001.0978. [DOI] [PubMed] [Google Scholar]
- West MJ, Coleman PD, Flood DG, Troncoso JC. Differences in the pattern of hippocampal neuronal loss in normal ageing and Alzheimer's disease. Lancet. 1994;344:769–772. doi: 10.1016/s0140-6736(94)92338-8. [DOI] [PubMed] [Google Scholar]
- Williams DS, Detre JA, Leigh JS, Koretsky AP. Magnetic Resonance Imaging of Perfusion Using Spin Inversion of Arterial Water. Proc Natl Acad Sci U S A. 1992;89:212–216. doi: 10.1073/pnas.89.1.212. [DOI] [PMC free article] [PubMed] [Google Scholar]