Abstract
Rationale and Objectives
Global data and local instance based machine learning methods and classifiers have been widely used to optimize computer-aided detection (CAD) schemes to classify between true-positive and false-positive detections. In this study the authors investigated the correlation between these two types of classifiers using a new independent testing dataset and assessed the potential improvement of a CAD scheme performance by combining the results of the two classifiers in detecting breast masses.
Materials and Methods
The CAD scheme first used image filtering and a multi-layer topographic region growth algorithm to detect and segment suspicious mass regions. The scheme then used an image feature based classifier to classify these regions into true-positive and false-positive regions. Two classifiers were used in this study. One was a global data based machine learning classifier, an artificial neural network (ANN), and the other one was a local instance based machine learning classifier, a k-nearest neighbor (KNN) algorithm. An independent image database involving 400 mammography examinations was used in this study. Among them, 200 were cancer cases and 200 were negative cases. The pre-optimized CAD scheme was applied twice to the database using the two different classifiers. The correlation between the two sets of classification results was analyzed. Three sets of CAD performances using the ANN, KNN, and average detection scores from both classifiers were assessed and compared using the free-response receiver operating characteristics (FROC) method.
Results
The results showed that the ANN achieved higher performance than the KNN with a normalized area under the performance curve (AUC) of 0.891 versus 0.845. The correlation coefficients between the detection scores generated by the two classifiers were 0.436 and 0.161 for the true-positive and false-positive detections, respectively. The average detection scores of the two classifiers improved CAD performance and reliability by increasing AUC to 0.912 and reducing the standard error of the estimated AUC by 14.4%. The detection sensitivity was also increased from 75.8% (ANN) and 65.9% (KNN) to 80.3% at the false-positive detection rate of 0.3 per image.
Conclusions
The study demonstrates that the global and local data based machine learning classifiers (ANN and KNN) generate low correlated detection results and combining the detection scores of these two classifiers can significantly improve overall CAD performance (p < 0.01) and reduce standard error in CAD performance assessment.
Keywords: Computer-aided diagnosis, Performance assessment, Machine learning, Mass detection
I. INTRODUCTION
Computer-aided detection and diagnosis (CAD) has emerged as a rapidly developing and promising technology in assisting radiologists with reading and interpreting screening mammograms [1–3], as well as other medical images. Most mammography CAD schemes typically involve three stages in an attempt to automatically detect suspicious beast lesions and classify their likelihood of being malignant. The first stage uses image filtering and threshold methods to detect initially suspicious pixels or areas. The second stage applies a region growth or segmentation algorithm to define the lesion areas and the boundary contours. From the segmented lesion area, a set of image features is then extracted and computed. The third stage uses a pre-trained machine learning classifier to classify between the true-positive and false-positive detections. A large number of supervised machine learning methods have been investigated and tested for this purpose, which include, but are not limited to, a) linear discriminant analysis [4], b) decision-tree [5], c) artificial neural network [6], d) Bayesian believe network [7], e) support vector machine [8], f) rule-based expert system [9], g) information-theoretic based template matching [10], and h) k-nearest neighbor algorithm [11]. Although these classifiers use different machine learning concepts and methods, they basically can be divided into two categories, namely the global data and the local instance based machine learning methods [12].
The global data based machine learning method is to train a classifier that generates a “global” optimization function to cover the entire instance space. For example, the artificial neural network (ANN) is a typical classifier trained using the global data based machine learning method. The advantage of the ANN is that it provides a robust approach to approximate general and explicit target functions with potentially noisy or incomplete training data. The local data based machine learning method is an instance-based “lazy” learning method. Instead of estimating the global target function once for the entire instance space, the local-based machine learning method estimates the target function locally and differently for each new queried instance to be classified. The k-nearest neighbor (KNN) algorithm is one of the most widely used classifiers when using the local data based machine learning method. Similar to an adaptive approach, an important advantage of the KNN algorithm is that it provides an option of selecting a different hypothesis or local approximation to the target function for each unknown (or test) query.
In order to improve CAD performance, combining the detection results from different machine learning classifiers has also been attracting research interest in CAD development. Previous studies in this area have demonstrated improved results by focusing on the combination of detection results of multiple global data based machine learning classifiers [13, 14]. One previous study reported a research effort of using a local instance based machine learning classifier to assess the reliability of CAD schemes developed and optimized using different global data based machine learning classifiers, including deterministic and nondeterministic ANN and support vector machines [15]. However, to the best of our knowledge, the performance level difference and the detection result correlation between an ANN and a KNN have never been tested and compared using the same testing datasets to date. Due to the completely different learning concepts between global and local data based machine learning classifiers, we hypothesize that, although once the database has been established it is possible that no global data based machine learning classifier is superior to a local data based machine learning classifier or vice versa, the correlation between the two types of classifiers will be quite low and potentially improve CAD performance by combining the results of these two types of classifiers. This preliminary study aims to investigate and test this hypothesis. For this purpose, we applied both a global data based machine learning classifier (the ANN [16]) and a local instance based machine learning classifier (the KNN algorithm [17]) to classify suspicious breast mass regions detected by the first two stages of a CAD scheme. Specifically, we assembled a new independent image dataset in this study and used the free-response receiver operating characteristic (FROC) method to test and compare the estimated performance of the CAD scheme using both the ANN and KNN classifiers. We then investigated (1) the correlation coefficient between two sets of CAD results generated by the ANN and KNN classifiers and (2) the feasibility of improving CAD performance and reducing standard error of estimated performance curves by combining these two sets of CAD results. The detailed description of our experimental design and results are reported as follows.
II. MATERIALS AND METHODS
A. A CAD scheme with two machine learning classifiers
In our prior studies, we developed a CAD scheme to detect breast masses depicted on digitized mammograms [18, 19]. In brief, the first stage of the scheme uses a difference-of-Gaussian (DOG) filtering and threshold method to detect initially suspicious mass regions. These two Gaussian filters have zero mean and standard deviations of σ1 = 0.117 mm and σ2 = 0.85 mm. This stage typically detects between 10 and 30 suspicious mass regions per image depending on the breast tissue density and distribution. The second stage applies a multi-layer topographic region growth algorithm to segment and define the mass region boundary. The growth seed is automatically selected as the pixel that has the “global” minimum digital value inside the initially labeled region and the growth step (threshold) is adaptively determined based on the computation of region contrast. In each growth layer a small set of image features (i.e., region size, circularity, contrast, and growth ratio) is also computed by the scheme. Only the regions that pass a set of feature-based classification rules will continue to grow to the next layer; while others are deleted as false-positive regions. Our previous studies have shown that when using this three layer topographic region growth algorithm, a large fraction (i.e., >75%) of initially detected suspicious mass regions are deleted while the CAD scheme maintains high detection sensitivity (i.e., >95% of case-based sensitivity or >85% of region-based sensitivity). For each of the detected and segmented mass regions, the CAD scheme computes a new set of 36 morphology and intensity distribution based image features to represent the detected region (as we have previously reported [17, 19]). A similar multi-layer topographic region growth algorithm and its effectiveness in defining mass boundary contours has also been tested and reported by another research group [20].
The third stage of the CAD scheme uses a feature-based machine learning classifier to further classify the detected suspicious mass regions into true-positive and false-positive regions. Using a large training image database and the initial pool of 36 computed image features for each CAD-segmented mass (growth) region; we applied a genetic algorithm in our previous study to optimize a number of classifiers including an ANN and a KNN. The optimized ANN has a simple three-layer feed-forward topology which includes 13 input neurons (connecting to 13 image features), one hidden layer with seven neurons, and one output neuron [19]. A nonlinear sigmoid function, g(z)= 1/(1+e−z), is used as the ANN activation function and generates a detection score from 0 to 1 representing the likelihood of a segmented testing region being a true-positive mass region. Our genetic algorithm optimized KNN based classifier [17] searches for and identifies 15 of the most “similar” suspicious mass regions to the testing region from a pre-established reference library (feature database). The similarity is measured by the Euclidean distance (d) between a testing mass region (yT)and each of the reference regions (xi) in a multi-dimensional space with 14 selected image features.
The detailed definition and computing methods of these 14 selected features have previously been reported [17]. A smaller distance indicates a higher degree of “similarity” between two compared regions. The KNN classifier then computes a detection score:
where (a distance weight), and are the distance weights for the true-positive (i) and false-positive (j) mass regions, respectively. N is the number of verified true-positive (TP) mass regions, M is the number of CAD-cued false-positive (FP) regions, and N+M = 15. Our current reference library includes 3,553 regions of interest (ROI). Among them, 1,792 depict malignant masses and 1,761 depict CAD-cued false-positive mass regions [21].
B. A testing image dataset
To test the performance of the CAD scheme using the global data based and local (instance) data based machine learning classifiers, we selected a testing image dataset that has not been used for the purpose of training and optimizing the two classifiers (ANN and KNN). This image dataset includes mammograms acquired from 400 women who underwent mammography screening examinations. Each examination included four images, namely craniocaudal (CC) and mediolateral oblique (MLO) views of the left and right breast. Among these 400 women, 200 were diagnosed and verified with breast cancer. For each verified cancer case one malignant mass was detected and considered visible by the radiologists on both CC and MLO views. The remaining 200 examinations were verified as negative screening cases. The image characteristics of these masses (including size and subjective subtleness rating) have been reported elsewhere [22]. In brief, the average measured mass size is 1.5 cm2 (median 1.1 cm2 ) with the range of 0.1 to 9.5 cm2. Approximately one-half of the masses were rated subjectively as “somewhat subtle” to “very subtle” by the radiologists. All film-based mammograms were digitized using a Howtek digitizer (iCAD Inc., Nashua, NH) with original pixel sizes of 43μm × 43μm. For the purpose of mass detection, these images were then sub-sampled using a pixel averaging method to reduce image size by 8-fold in two dimensions (with pixel size of 0.344mm × 0.344mm). For each detected and verified mass region, a rectangular frame that covers the depicted mass was visually determined by the radiologists and recorded in the “truth file.” If the center of a CAD-cued region is located inside the “truth” frame, the detected region is considered a true-positive mass region (the mass region is detected). Otherwise, this CAD-cued region is identified as a false-positive region.
C. Assessment of the performance of two classifiers
In this study, the previously optimized CAD scheme, including the ANN classifier [19], was first applied “as is” to each image of the testing dataset. Each of the suspicious mass regions that were classified by the ANN was then reclassified by the KNN based classifier. As a result, each suspicious mass region detected by the topographic region growth algorithm (the second stage of the CAD scheme) has two detection scores. One is generated by the ANN and the other by the KNN classifier. Since the CAD scheme can detect and cue multiple suspicious mass regions on one image or one case (four images), we computed and plotted an FROC curve based on either the ANN or KNN generated detection scores to assess the CAD performance. In our previous study we proposed the following method to generate an FROC curve [23]. We first assume that all detected suspicious mass regions are independent and apply a conventional ROC method and program (i.e., ROCFIT [24]) to generate an ROC curve. In an ROC curve the scale of both true-positive fraction (y-axis) and false-positive fraction (x-axis) ranges from 0 to 1. Second, we compute the maximum detection sensitivity and the maximum false-positive detection rate of the CAD scheme. Third, we generate an FROC curve by linearly expanding the x-axis of the ROC curve from 0 to the maximum false-positive detection rate and compressing the y-axis of the ROC curve from 0 to the maximum sensitivity (≤1). This method has also been used by other research groups to generate FROC curves to assess CAD performance [25]. A previous study showed that the FROC curves generated and fitted using this method was effective and very comparable to those generated by two recently developed FROC curve fitting models [26].
Because in this study the ANN and KNN classifiers are applied to the same set of suspicious mass regions and each detected suspicious mass region has two detection scores generated by the ANN and KNN classifiers respectively, the maximum sensitivity levels and the maximum false-positive detection rates are the same when using the CAD scheme incorporated with either the ANN or KNN classifier. Therefore, we can compute the correlation coefficient between the ANN and KNN generated detection scores, as well as assess the statistically significant difference between two FROC curves using the available ROC program (ROCFIT [24]). Because two FROC curves end at the same point, represented by the maximum detection sensitivity (y axis) and the maximum false-positive detection rate (x axis), the normalized areas under these FROC curves can be represented and compared by the areas under the ROC curves that are initially computed by the ROC program.
Our hypothesis in this study is that because the ANN and KNN classifiers are optimized based on two totally different machine learning concepts, the detection or classification results of these two classifiers should not be highly correlated. Thus, the combination (or fusion) of two detection scores generated by the two classifiers should improve overall CAD detection performance. The degree of improvement is inversely related to the correlation coefficients of the two sets of detection scores [27]. Although previous study [28] has shown that averaging two lower correlated detection scores usually achieves the best performance than other fusion methods, we tested different methods to combine the ANN and KNN generated detection scores in this study. First, we computed the final detection score by averaging ANN and KNN generated detection scores. We also compared two scores generated by ANN and KNN for each detected suspicious mass region and then used either the larger (“the maximum”) or the smaller (“the minimum”) one to represent the final detection score of the region. Second, we weighted ANN and KNN generated scores differently and then computed the weighted average scores. In data analyses, we computed and plotted three FROC curves using the (1) ANN, (2) KNN, and (3) combined detection scores. Based on the FROC curves, we assessed and compared the detection sensitivity levels at the same false-positive detection rate (e.g., 0.3 per image that is very comparable to the false-positive rate used in current leading commercial CAD schemes [16]). We also used the expanded binormal model and the maximum likelihood (ML) method to assess and compare the statistically significant difference (p-value) between the different performance curves.
In the clinical application, a suspicious mass region is cued by the CAD scheme only if the region has a detection score above the CAD operating threshold. In this study each CAD-cued mass region has another (the second) detection score generated by either the ANN or KNN classifier. We also investigated whether using the second score to reassess the originally CAD-generated detection score (the first score) can improve mass detection performance or raise the reliability of the detection results. Specifically, we computed, plotted, and analyzed CAD performance curves using the second scores for those mass regions detected by the original CAD scheme (namely, their first detection scores are higher than the CAD operating threshold).
III. RESULTS
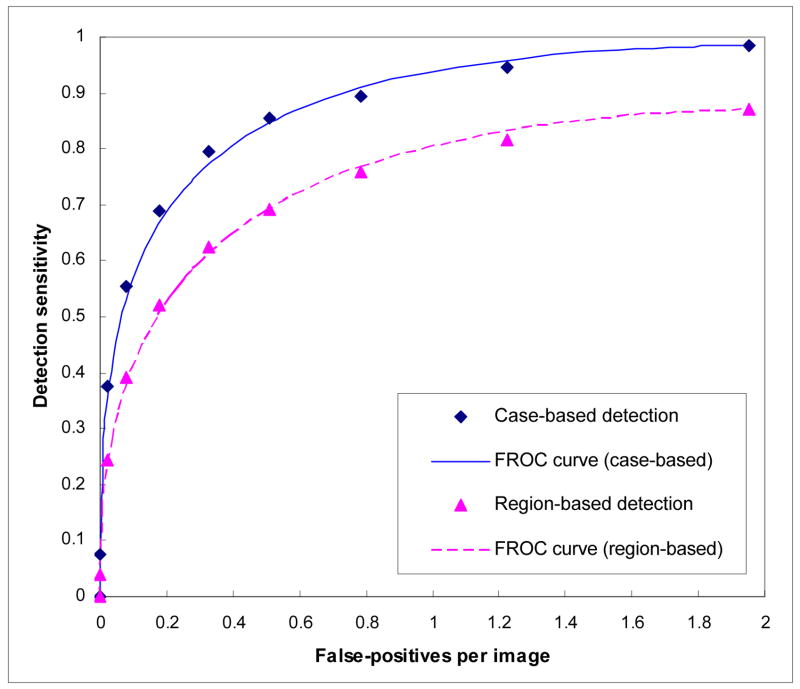
After applying the topographic region growth algorithm, our CAD scheme initially detected 3,469 suspicious mass regions in the image dataset. Among them, 347 were true-positive mass regions and 3,122 were false-positive mass regions. Thus, the maximum mass region detection sensitivity was 86.8% (347 out of 400) and the maximum false-positive detection rate was 1.95 per image (3122/1600). The 347 detected true-positive mass regions represent 197 independent masses resulting in 98.5% (197 of 200) case-based detection sensitivity in which a mass is counted as detected if it is detected by the CAD scheme on either one or two views. Figure 1 demonstrates two FROC curves of the CAD scheme using the ANN classifier.
Figure 1.
Two FROC curves of the CAD scheme using ANN classifier.
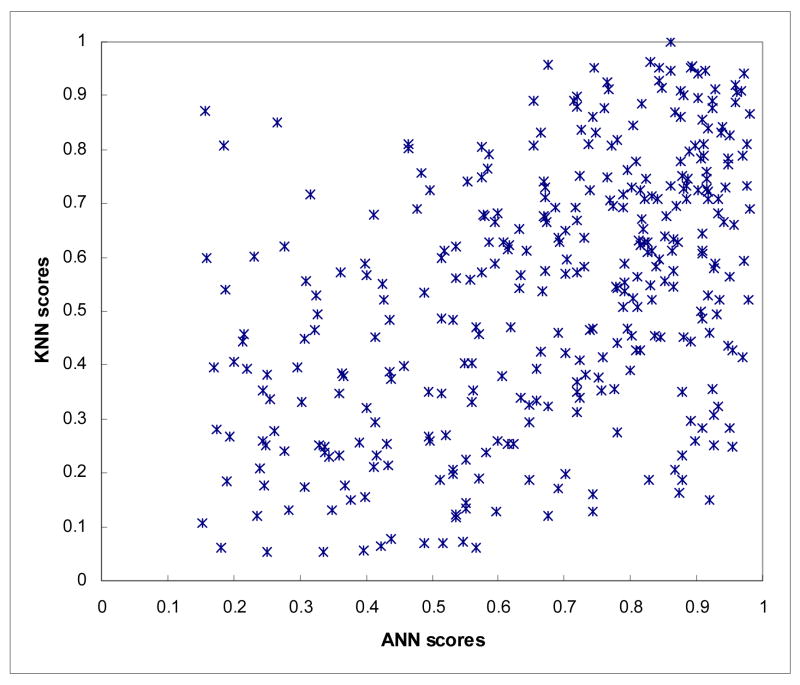
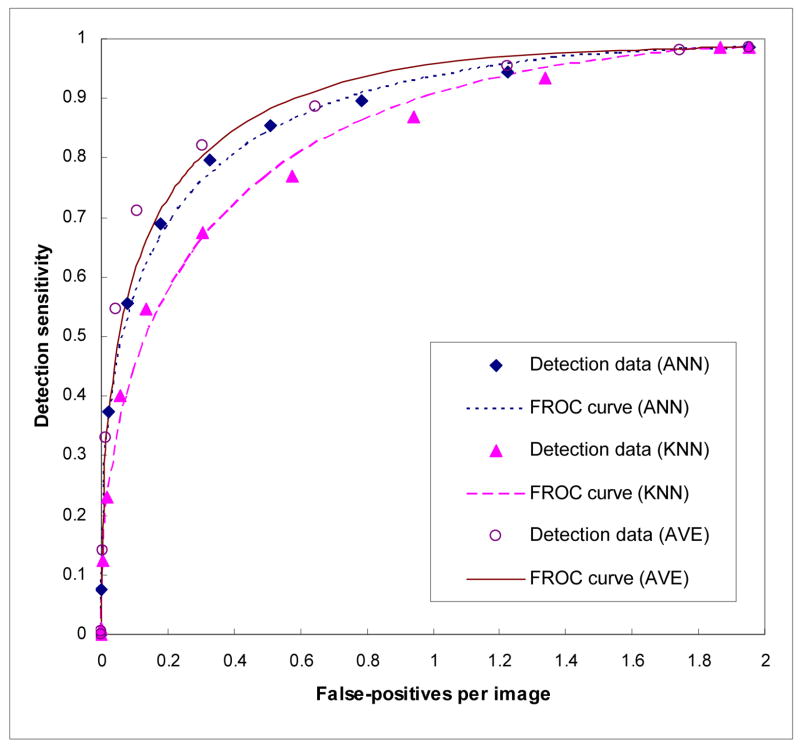
A scatter diagram shows the distribution between the ANN and KNN generated detection scores among 347 detected true-positive mass regions (Figure 2). The wide scattering distribution of scores indicates a low correlation between the ANN and KNN generated detection scores. The computed correlation coefficients for true-positive mass regions and for false-positive mass regions were 0.436 and 0.161, respectively. Figure 3 shows and compares three case-based FROC curves. The normalized areas under these three FROC-type performance curves (AUC) when using the ANN, KNN, and average detection scores were 0.8905, 0.8448, and 0.9115, respectively. The corresponding standard errors of the computed AUCs were 0.0125, 0.0155, and 0.0107, respectively. The performance change between each pair of the curves was statistically significant (p < 0.01). At the 0.3 false-positive detections per image, CAD detection sensitivity levels were 75.8%, 65.9%, and 80.3%when using the ANN, KNN, and average detection scores, respectively.
Figure 2.
Distribution between ANN and KNN generated detection scores among 347 detected true-positive mass regions.
Figure 3.
Three case-based FROC curves using the ANN, KNN, and average scores.
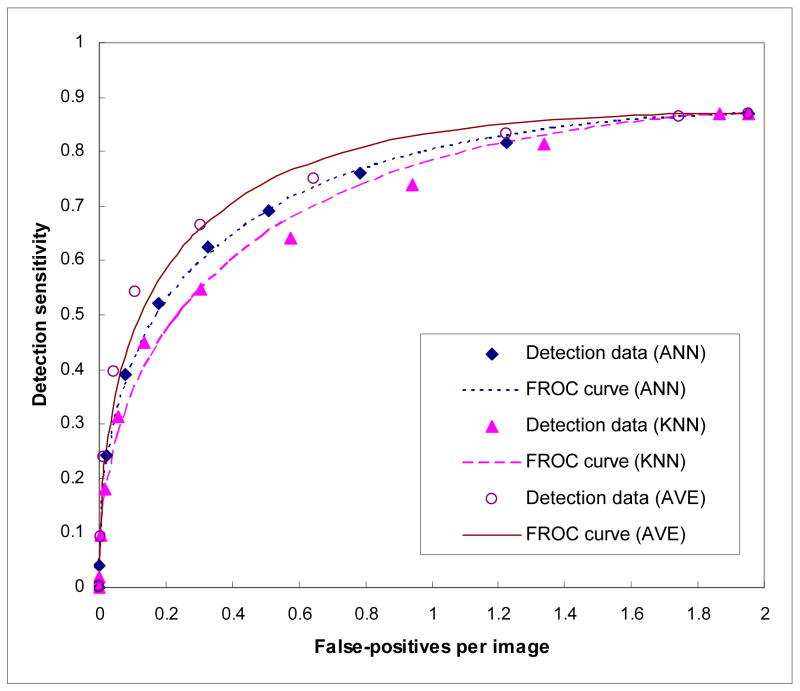
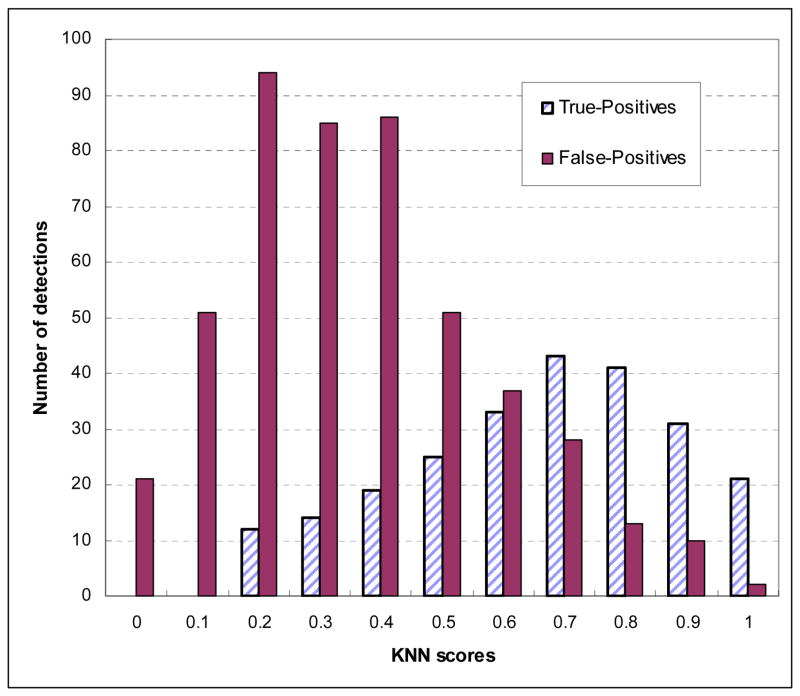
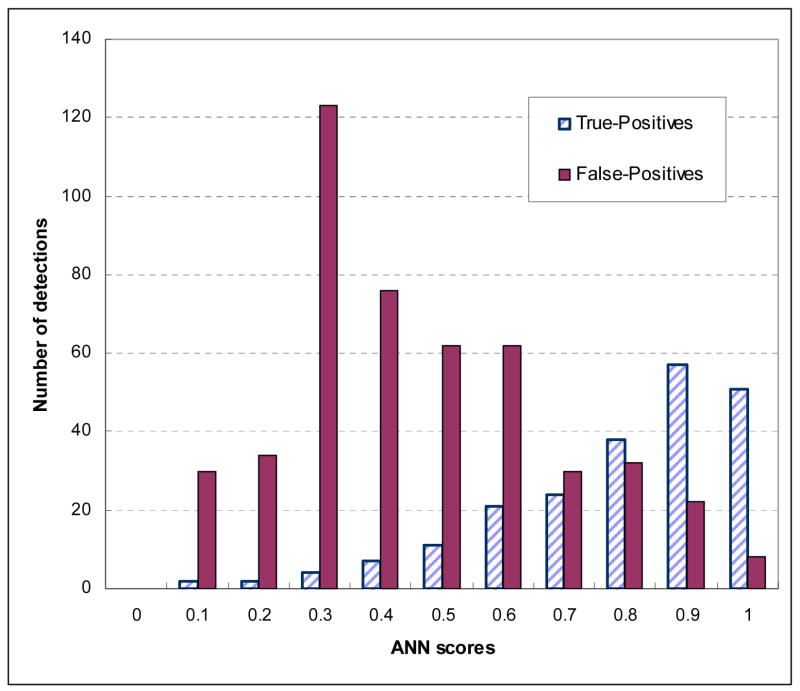
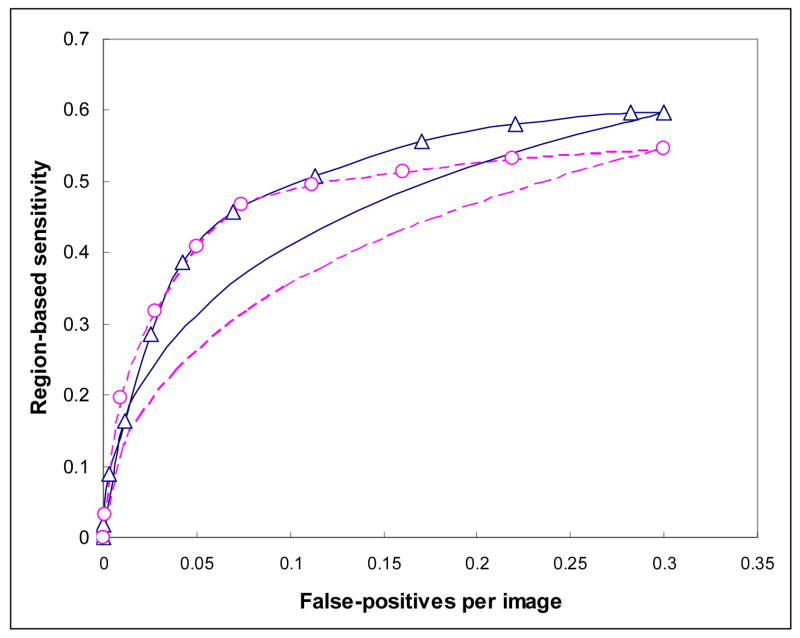
Figure 4 shows three region-based FROC curves using the ANN, KNN, and average detection scores. The corresponding normalized areas under the three FROC curves were 0.8513±0.0094, 0.8231±0.0104, and 0.8868±0.0074, respectively. At the same false-positive rate of 0.3 per image, the region-based detection sensitivities were 59.6%, 54.7%, and 65.8%, respectively. Figure 5 shows the distribution of KNN-generated scores for all suspicious mass regions detected by the CAD scheme using the ANN classifier at this operating threshold level (with 0.3 false-positives per image), while Figure 6 shows the distribution of ANN-generated scores for all suspicious regions detected by the CAD scheme using the KNN classifier. Based on these two histograms, two FROC-type performance curves were computed and plotted in Figure 7. These two performance curves were also compared with the original performance curves as shown in Figure 4 at the false-positive detection rate of < 0.3 per image. The comparison results show that if we first accept all suspicious mass regions detected by the CAD scheme with one classifier (either ANN or KNN), we can increase CAD sensitivity at the lower false-positive rate by using another classifier generated detection scores as the final detection scores. For example, at 0.1 false-positive detections per image, the region-based sensitivity was increased from 40.9% to 49.2% when the KNN generated scores were used to replace the original (ANN generated) scores, or from 35.8% to 47.2% when the ANN generated scores were used to replace KNN generated scores.
Figure 4.
Three region-based FROC curves using the ANN, KNN, and average scores.
Figure 5.
Histogram of KNN-generated scores for all suspicious mass regions detected and cued by the CAD scheme using the ANN classifier.
Figure 6.
Histogram of ANN-generated scores for all suspicious mass regions detected and cued by the CAD scheme using the KNN classifier.
Figure 7.
Comparison of CAD performance after using the second scores to replace the original scores of the detected mass regions. The curve marked with “Δ ” indicates CAD performance after using KNN generated scores to replace the original ANN generated scores; while curve marked with “O” indicates CAD performance after using ANN generated scores to replace original KNN generated scores. The two smooth curves (without marks) represent sections of the original FROC curves copied from Figure 4 in which the solid curve is generated by CAD using the ANN and the dashed curve is generated by CAD using the KNN.
Table 1 compares the CAD performance levels of using the average, the maximum, and the minimum of ANN and KNN generated detection scores. The results show that using the average scores achieves the highest performance measured by AUC value followed by using the maximum scores. However; the difference between these two performance levels is not statistically significant for both case-based and region-based comparisons as shown in Table 1. The performance level using the minimum scores is significantly lower than using the average scores (p < 0.01). Table 2 lists the performance levels of using a series of weighted average scores. Although the AUC value reaches the maximum level (0.9136±0.0102) when the weight applying to ANN scores is 1.25 (indicating 56% contribution from ANN scores and 44% contribution from KNN scores), it is not significantly different from the performance level (AUC = 0.9115±0.0107) achieved using the un-weighted average scores (p = 0.745).
Table 1.
Comparison of both case-based and region-based detection performance levels (AUC values) using the average, the maximum, and the minimum score of ANN and KNN classifier (Note that the p-values were computed between the average and the maximum or the minimum detection scores)
| Average | Maximum | Minimum | |
|---|---|---|---|
| Case-based | 0.9115±0.0107 | 0.8946±0.0099 (p = 0.374) | 0.8713±0.0118 (p < 0.001) |
| Region-based | 0.8868±0.0074 | 0.8671±0.0091 (p = 0.365) | 0.8502±0.0095 (p = 0.006) |
Table 2.
Comparison of case-based detection performance levels (AUC values) using the average of ANN and KNN detection scores in which the ANN scores are weighted by multiplying a set of ratios from 0.5 to 2.0
| Weight | 0.5 | 0.75 | 1.0 | 1.25 | 1.5 | 1.75 | 2.0 |
|---|---|---|---|---|---|---|---|
| AUC | 0.8967 | 0.9080 | 0.9115 | 0.9136 | 0.9125 | 0.9111 | 0.8946 |
| Standard deviation | 0.0107 | 0.0101 | 0.0107 | 0.0102 | 0.0105 | 0.0109 | 0.0101 |
IV. DISCUSSION
The ANN and KNN classifiers are the two most popular global data and local instance based machine learning classifiers used in CAD schemes for mammograms and other medical images. Both classifiers have advantages and limitations [12]. The ANN is typically trained using a large and diverse image database to build a single “global” optimization target function to cover the entire case domain. The major advantage of the ANN is that it is relatively robust to noise in the training data. However, over-fitting the training data is an important issue or risk in ANN optimization, which produces poor results to the new testing data. As a local instance-based learning method, the KNN adaptively builds different local approximations to the target function depending on the neighborhood of the new queried (or testing) instance. This has great advantage when the target function is very complex because the KNN can still be described by a collection of less complex local approximations. One major disadvantage of the KNN is that it is much more sensitive to the data noise (including the selection of neighbors and features) than the ANN. In this study we investigated and compared the performance of these two classifiers when applied to a new independent testing dataset. We found that the CAD scheme using the ANN classifier achieved significantly higher performance than the CAD scheme using the KNN classifier. Specifically, using the ANN increased normalized areas under the FROC curve by 5.4% (from 0.8448 to 0.8905) and reduced the standard error by 19.4% (from 0.0155 to 0.0125). This result is consistent with the machine learning characteristic of the ANN and KNN. Due to the large variability and overlap between the subtle masses and normal breast tissues as well as the error in mass region segmentation, the computed features can be quite noisy and the feature difference between subtle masses and some false-positive regions may be small and subtle. As expected for this situation, the performance of the ANN is likely to be less sensitive to, or impacted by, the training (or reference) data than the KNN.
In CAD development, all classifiers (including ANN, KNN, and others) are developed to achieve optimal performance from the available training database. However, due to the limitation in size, diversity, and noise level in the image database as well as the errors in imaging processing (including feature computation and selection), many of the current CAD schemes using either a global or a local data based machine learning classifier have not achieved the performance that is high enough to meet the requirement of clinical applications. In this study we investigated and compared several methods to combine ANN and KNN generated detection scores in an attempt to improve the final CAD performance. Our experimental results indicate that among the three commonly used score combination methods (namely, taking the average, the maximum, and the minimum score), only the method using the average score achieves the significant high performance than both classifiers; while the performance using the minimum score is actually lower than using only the ANN score. As a result, using the average score in general can achieve the optimal performance, which is consistent with previously reported theoretical analysis and experimental results in combining correlated diagnostic information [28]. In this study, compared to the CAD scheme using only the ANN, the scheme using the average scores of the ANN and KNN classifiers increased normalized areas under the FROC curve by 2.4% (from 0.8905 to 0.9115) and reduced the standard error by 14.4% (from 0.0125 to 0.0107). This means that using the average detection scores improves both detection performance and the reliability of the estimated FROC curve (or AUC). At the false-positive detection rate of 0.3 per image (similar to the operating false-positive detection rate of the current leading commercial CAD schemes [16]), using the average detection scores of two classifiers increases the case-based CAD sensitivity by 5.9% (from 75.8% to 80.3%) as compared to using the ANN-generate scores only or 21.9% (from 65.9% to 80.3%) as compared to using the KNN-generated scores only. The results demonstrate that applying this detection score combination method, the CAD schemes can potentially cue more true-positive lesions in the clinical practice without increase of false-positive cueing rate.
In addition, because the ANN achieves the higher performance than the KNN using this specific dataset, taking the weighted average score in which the ANN score is weighted more than the corresponding KNN score slightly improves the performance level in this study. Although the performance improvement using weighted average scores is not statistically significant as compared to using the regular un-weighted average scores in this study, how to adaptively define the optimal weighted score averaging methods remains a promising research topic in future development and optimization of CAD schemes involving multiple or hybrid machine learning classifiers.
This study also raises a potentially important issue that should be investigated further in future studies. Most current CAD schemes for mammograms (including the commercial schemes) have two major limitations that are (1) relatively higher false-positive detection rates and (2) relatively high correlation with radiologists in detecting true-positive breast lesions [16]. As a result, whether using current CAD schemes (or systems) can help improve radiologists’ performance in the clinical practice is still under debate and investigation [29, 30]. Besides improving the overall detection performance (i.e., improve FROC curve as shown in Figure 3 and 4), another potential advantage of combining two global and local data based machine learning classifiers is that CAD will cue different true-positive mass regions as compared to the original CAD scheme without the increase of false-positive detection rate. As shown in Figure 2, although using the KNN generated scores may increase the overall scores of some true-positive mass regions with relatively lower ANN generated detection scores, the KNN generated scores reduces the overall scores of the other true-positive mass regions with higher ANN detection scores. This result clearly indicates that using the average detection scoring method cues some of the initially missed (un-cued) true-positive mass regions by CAD using either the ANN or KNN classifier only, but it also discards some of the initially detected mass regions. Because current CAD is used based on “the second reader” concept in the clinical practice, the primary goal of using CAD-cued results in the clinical practice is to mark more subtle abnormalities that are likely to be missed or overlooked by the radiologists. Thus, although combining two detection scores can eliminate a fraction of easy masses (with higher scores generated by the original CAD scheme), as long as the new cueing results can include more subtle masses without increasing the false-positive cueing rate, the new scheme may reduce the correlation between CAD cueing results and radiologists’ detection results. This will make the CAD-cueing results more useful in clinical applications. We believe that this is an important issue that needs to be further investigated before a CAD scheme combining these two types of machine learning classifiers can be applied to the clinical practice.
In conclusion, we investigated and compared the correlation of CAD results on mass detection between using a global data based machine learning classifier (the ANN) and a local instance based machine learning classifier (the KNN) in this preliminary study. Although each classifier has its unique advantages and limitations, we found in this study that the correlation between the detection results (scores) of these two classifiers is low. Therefore, combining the detection results of these two classifiers can significantly improve CAD performance and reduce the standard error of the performance estimation. Despite the encouraging results, a number of issues should be investigated further before the new CAD scheme that combines detection scores generated by the two classifiers can be used in the clinical practice. These include (1) finding an optimal approach to combine the two sets of detection scores and (2) investigating whether the new method can cue more subtle mass regions that are likely to be missed or overlooked by radiologists.
References
- 1.Khoo LA, Taylor P, Given-Wilson RM. Computer-aided detection in the United Kingdom National Breast Screening Programme: prospective study. Radiology. 2005;237:444–449. doi: 10.1148/radiol.2372041362. [DOI] [PubMed] [Google Scholar]
- 2.Ko JM, Nicholas MJ, Mendel JB, Slanetz PJ. Prospective assessment of computer-aided detection in interpretation of screening mammograms. Am J Roentgenol. 2006;187:1483–1491. doi: 10.2214/AJR.05.1582. [DOI] [PubMed] [Google Scholar]
- 3.Nishikawa RM. Current status and future directions of computer-aided diagnosis in mammography. Comput Med Imaging Graph. 2007;31:224–235. doi: 10.1016/j.compmedimag.2007.02.009. [DOI] [PubMed] [Google Scholar]
- 4.Shi J, Sahiner B, Chan HP, et al. Characterization of mammographic masses based on level set segmentation with new image features and patient information. Med Phys. 2007;34:280–290. doi: 10.1118/1.2820630. [DOI] [PMC free article] [PubMed] [Google Scholar]
- 5.Rymon R, Zheng B, Chang YH, Gur D. Incorporation of a set enumeration trees-based classifier into a hybrid computer-assisted diagnosis scheme for mass detection. Acad Radiol. 1998;5:181–187. doi: 10.1016/s1076-6332(98)80282-1. [DOI] [PubMed] [Google Scholar]
- 6.te Brake G, Karssemeijer N. Segmentation of suspicious densities in digital mammograms. MedPhys. 2001;28:259–266. doi: 10.1118/1.1339884. [DOI] [PubMed] [Google Scholar]
- 7.Wang XH, Zheng B, Good WF, King JL, Chang YH. Computer-assisted diagnosis of breast cancer using a data-driven Bayesian belief network. Int J Med Informatics. 1999;54:115–126. doi: 10.1016/s1386-5056(98)00174-9. [DOI] [PubMed] [Google Scholar]
- 8.Wei L, Yang Y, Nishikawa RM, Jiang Y. A study on several machine learning methods for classification of malignant and benign clustered microcalcifications. IEEE Trans Med Imaging. 2005;24:371–380. doi: 10.1109/tmi.2004.842457. [DOI] [PubMed] [Google Scholar]
- 9.Li L, Zhang Y, Zheng L, Clark RA. False-positive reduction in CAD mass detection using a competitive classification strategy. Med Phys. 2001;28:250–258. doi: 10.1118/1.1344203. [DOI] [PubMed] [Google Scholar]
- 10.Tourassi GD, Harrawood B, Singh S, Lo JY, Floyd CE. Evaluation of information-theoretic similarity measures for content-based retrieval and detection of masses in mammograms. Med Phys. 2007;34:140–150. doi: 10.1118/1.2401667. [DOI] [PubMed] [Google Scholar]
- 11.Zheng B, Mello-Thoms C, Wang XH, et al. Interactive computer aided diagnosis of breast masses: computerized selection of visually similar image sets from a reference library. Acad Radiol. 2007;14:917–927. doi: 10.1016/j.acra.2007.04.012. [DOI] [PMC free article] [PubMed] [Google Scholar]
- 12.Mitchell TM. Machine learning. WCB/McGraw-Hill; Boston, MA: 1997. [Google Scholar]
- 13.Jesneck JL, Noite LW, Floyd CE, Lo JY. Optimized approach to decision fusion of heterogeneous data for breast cancer diagnosis. Med Phys. 2006;33:2945–2954. doi: 10.1118/1.2208934. [DOI] [PMC free article] [PubMed] [Google Scholar]
- 14.Elter M, Schulz-Wendtland R, Wittenberg T. The predication of breast cancer biopsy outcomes using two CAD approaches that emphasize an intelligible decision process. Med Phys. 2007;34:4164–4172. doi: 10.1118/1.2786864. [DOI] [PubMed] [Google Scholar]
- 15.Habas PA, Zurada JM, Elmaghraby AS, Tourassi GD. Reliability analysis framework for computer-assisted medical decision systems. Med Phys. 2007;34:763–772. doi: 10.1118/1.2432409. [DOI] [PubMed] [Google Scholar]
- 16.Gur D, Stalder J, Hardesty LA, et al. CAD performance on sequentially ascertained mammographic examinations of masses: an assessment. Radiology. 2004;233:418–423. doi: 10.1148/radiol.2332040277. [DOI] [PubMed] [Google Scholar]
- 17.Zheng B, Lu A, Hardesty LA, et al. A method to improve visual similarity of breast masses for an interactive computer-aided diagnosis environment. Med Phys. 2006;33:111–117. doi: 10.1118/1.2143139. [DOI] [PubMed] [Google Scholar]
- 18.Zheng B, Chang YH, Gur D. Computerized detection of masses in digitized mammograms using single image segmentation and a multi-layer topographic feature analysis. Acad Radiol. 1996;2:959–966. doi: 10.1016/s1076-6332(05)80696-8. [DOI] [PubMed] [Google Scholar]
- 19.Zheng B, Sumkin JH, Good WF, et al. Applying computer-assisted detection schemes to digitized mammograms after JPEG data compression. Acad Radiol. 2000;7:595–602. doi: 10.1016/s1076-6332(00)80574-7. [DOI] [PubMed] [Google Scholar]
- 20.Eltonsy NH, Tourassi GD, Elmaghraby AS. A concentric morphology model for the detection of masses in mammography. IEEE Trans Med Imaging. 2007;26:880–889. doi: 10.1109/TMI.2007.895460. [DOI] [PubMed] [Google Scholar]
- 21.Park SC, Sukthankar R, Mummert L, et al. Optimization of reference library used in content-based medical image retrieval scheme. Med Phys. 2007;34:4331–4339. doi: 10.1118/1.2795826. [DOI] [PMC free article] [PubMed] [Google Scholar]
- 22.Zheng B, Leader JK, Abrams G, et al. Computer-aide detection schemes: the effect of limiting the number of cued regions in each case. Am J Roentgenol. 2004;182:579–582. doi: 10.2214/ajr.182.3.1820579. [DOI] [PubMed] [Google Scholar]
- 23.Zheng B, Shah R, Wallace L, et al. Computer-aided detection in mammography: An assessment of performance on current and prior images. Acad Radiol. 2002;9:1245–1250. doi: 10.1016/s1076-6332(03)80557-3. [DOI] [PubMed] [Google Scholar]
- 24.Metz CE. University of Chicago; Chicago, IL: 1998. ROCFIT 0.9B Beta version. http://www.radiology.uchicago.edu/krl/ [Google Scholar]
- 25.Bellotti R, De Carlo F, Tangaro S, et al. A completely automated CAD system for mass detection in a large mammographic database. Med Phys. 2006;33:3066–3077. doi: 10.1118/1.2214177. [DOI] [PubMed] [Google Scholar]
- 26.Yoon HJ, Zheng B, Sahiner B, Chakraborty DP. Evaluating computer-aided detection algorithms. Med Phys. 2007;34:2024–2038. doi: 10.1118/1.2736289. [DOI] [PMC free article] [PubMed] [Google Scholar]
- 27.Swensson RG, King JL, Good WF, Gur D. Observer variation and the performance accuracy gained by averaging ratings of abnormality. Med Phys. 2000;27:1920–1933. doi: 10.1118/1.1286589. [DOI] [PubMed] [Google Scholar]
- 28.Liu B, Metz CE, Jiang Y. Effect of correlation on combining diagnostic information from two images of the same patient. Med Phys. 2005;32:3329–3338. doi: 10.1118/1.2064787. [DOI] [PubMed] [Google Scholar]
- 29.Nishikawa RM, Kallergi K. Computer-aided detection in its present form is not an effective aid for screening mammography. Med Phys. 2006;33:811–814. doi: 10.1118/1.2168063. [DOI] [PubMed] [Google Scholar]
- 30.Fenton JJ, Taplin SH, Carney PA, et al. Influence of computer-aided detection on performance of screening mammography. N Engl J Med. 2007;356:1399–1409. doi: 10.1056/NEJMoa066099. [DOI] [PMC free article] [PubMed] [Google Scholar]


