Abstract
Characterizing patterns of genetic variation within and among human populations is important for understanding human evolutionary history and for careful design of medical genetic studies. Here, we analyze patterns of variation across 443,434 single nucleotide polymorphisms (SNPs) genotyped in 3845 individuals from four continental regions. This unique resource allows us to illuminate patterns of diversity in previously under-studied populations at the genome-wide scale including Latin America, South Asia, and Southern Europe. Key insights afforded by our analysis include quantifying the degree of admixture in a large collection of individuals from Guadalajara, Mexico; identifying language and geography as key determinants of population structure within India; and elucidating a north–south gradient in haplotype diversity within Europe. We also present a novel method for identifying long-range tracts of homozygosity indicative of recent common ancestry. Application of our approach suggests great variation within and among populations in the extent of homozygosity, suggesting both demographic history (such as population bottlenecks) and recent ancestry events (such as consanguinity) play an important role in patterning variation in large modern human populations.
Recent advances in sequencing and genotyping technology have transformed the study of human population genetics (Hinds et al. 2005; The International HapMap Consortium 2007). Analysis of dense genotype data has greatly expanded our understanding of the role natural selection has played in the recent evolution of our species (Voight et al. 2006; Sabeti et al. 2007; Williamson et al. 2007), the nature and causes of recombination rate variation (Myers et al. 2006; Coop et al. 2008), and the extent of structural variation within and among human genomes (Redon et al. 2006; Jakobsson et al. 2008; Kidd et al. 2008).
Arguably, some of the most important insights have come from refining our views of human population structure and recent demographic history (The International HapMap Consortium 2005, 2007; Schaffner et al. 2005; Keinan et al. 2007; Jakobsson et al. 2008; Li et al. 2008). For example, the HapMap Project (The International HapMap Consortium 2005, 2007) has afforded unprecedented insight into fine-scale patterns of genotype and haplotype variation across more than 3.1 million single nucleotide polymorphisms (SNPs) genotyped in 270 individuals from three major continental populations. Likewise, analysis of samples collected by the Human Genome Diversity Project (HGDP) (Jakobsson et al. 2008; Li et al. 2008) has elucidated patterns of diversity across ∼650,000 SNPs genotyped in nearly a 1000 individuals from 51 populations. One key feature of these projects is that they have focused on comparing geographically discontinuous populations with small-to-moderate sample sizes per group. Populations of known recent admixture were largely absent from these studies.
In this paper, we analyze dense genotype data from 3845 individuals from the Population Reference Sample (POPRES; Nelson et al. 2008), with self-identified ancestry from four continental regions (Supplemental Table S1). The POPRES is comprised of samples from a number of studies, and includes individuals designated as healthy or with undisclosed disease status (Nelson et al. 2008). Individuals were generally sampled in urban locations, and were genotyped on the Affymetrix GeneChip Mapping Array 500K. Depending on the original study for which the samples were collected, further non-genetic data are often available, including self-reported ancestry up to, and including, grandparental information, and primary spoken language.
The POPRES provides a complementary resource to both the HapMap and HGDP datasets, and presents an opportunity to further understand human genetic diversity. The POPRES has already been used to investigate fine-scale population structure in Europe (Novembre et al. 2008) and its implications on case-control association studies (Nelson et al. 2008). In this paper, we have investigated population structure, haplotype diversity, and patterns of homozygosity in the POPRES. Some of the key findings we have uncovered include evidence of historical South European admixture with the Mexican population, population stratification within South Asia, a gradient of haplotype diversity within Europe, and extended runs of homozygosity in almost all individuals examined. Together these analyses suggest the growing utility of large diverse samples of worldwide human populations.
Results
Population structure
Consistent with all previous studies of human genetic variation, we find that the vast majority of common genetic variation is shared across major continental populations. Specifically, we observed a low degree of population differentiation, as measured by Wright's fixation index, of FST = 5.2% across autosomal SNPs for the four main continental groupings of East Asia, South Asia, Europe, and Mexico. Interestingly, we observed a significantly higher degree of divergence in allele frequency across X chromosome SNPs, where we estimate FST to be 9.7%. This value is about 40% higher than the expected value of 6.8% derived from a many-deme island model and accounting for the 4:3 ratio of autosomes to sex chromosome (see Supplemental material). The higher degree of population divergence at X chromosome SNPs suggests a smaller effective population size of the X than that predicted from Mendelian genetics. Alternatively, deviations from the simple Wright-Fisher model, such as a shorter mean generation time for females relative to males, smaller female population size, or male-biased dispersal, could also contribute to the observed difference (Schaffner 2004).
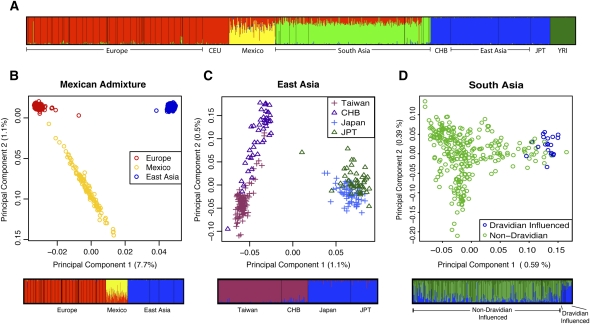
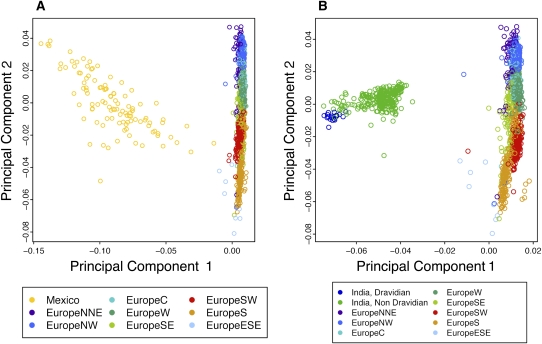
In order to quantify patterns of population structure and admixture, we utilized structure (Pritchard et al. 2000), a commonly used Bayesian clustering method. Due to computational limitations of the algorithm, we applied structure to a subset of the data (see Methods). For comparison and further validation of the POPRES data, we also included the four HapMap (release 23) populations in this analysis using the same SNP subset. Setting the number of clusters (K) to five revealed structures largely corresponding to continental regions (Fig. 1A). Interestingly, all Mexican and many South Asian individuals showed a proportion of the genome clustering with European individuals. In the case of individuals from Mexico, the European component, most likely reflects recent admixture, whereas the smaller European component in South Asia perhaps represents the recent common ancestry of the two populations (Patterson et al. 2006). When combined with the POPRES European samples alone, a principal component analysis (PCA) reveals that the Mexican individuals form a slightly elongated cluster extending from South/South West Europe (Fig. 2A). Conversely, in a similar analysis, South Asians form a tighter cluster that exhibits no preference for any one region of Europe (Fig. 2B). However, weak structuring by spoken language group is visible within the South Asian cluster, which is consistent with geographic structure (see below and Supplemental material).
Figure 1.
Global and regional patterns of population structure. (A) structure analysis with K = 5 for the POPRES populations combined with the HapMap populations. (B–D) For each region, the first two principal components are shown, with the proportion of variance explained by each component shown in parentheses. Results from structure are shown below the PCA results, with K = 2 for East Asia, and K = 3 for South Asia and Mexico. HapMap samples have been included in the East Asia analysis for comparison. In South Asia, individuals have been colored by spoken language group, with each individual's spoken language shown in Supplemental Figure S5.
Figure 2.
Principal component analysis of Europe and Mexico (A) and Europe and South Asia (B). Each point represents an individual and is colored by the assigned population group.
To investigate the level of admixture in the Mexican population, we combined the Mexican samples with a sample of European and East Asian populations. Using structure with K = 3 we estimated an average of 32.5% European ancestry in Mexican individuals (95% ± 3.3% confidence interval [C.I.]; see Fig. 1B), which is lower than some previous estimates based on microsatellite or “ancestry informative” markers (Salari et al. 2005; Price et al. 2007; Tian et al. 2007; Wang et al. 2008). However, it should be noted that the variability between individuals is high, and that the Mexican samples in our study originate from a single location (Guadalajara).
Analysis of the East and South Asian populations reveals structuring at a subcontinental level. In East Asia (Fig. 1C), we observe clear separation of the Japanese populations from the Taiwanese and HapMap CHB populations, with weaker separation of the Taiwanese from the CHB.
The South Asian individuals in the POPRES were sampled in London with self-identified South Asian ancestry (Nelson et al. 2008). For this reason, we lack data regarding ancestral geographic location. However, we observe weak clustering by spoken language (Fig. 1D; Supplemental Fig. S5). Assuming language to be a reasonable proxy for ancestral geographic location, the observed structure is therefore correlated with geographic spacing as seen in studies using fewer markers (Basu et al. 2003; Kashyap et al. 2006; Indian Genome Variation Consortium 2008). Furthermore, of the two South Asian populations, the Dravidian-influenced group is slightly more diverged from the other continental populations (Supplemental Table S4), suggesting stronger genetic isolation of this population.
To understand how representative the POPRES samples are of human diversity, we combined the POPRES with the HGDP data set (Jakobsson et al. 2008). These two studies used very different sampling strategies, with the POPRES mainly sampling individuals in urban locations, and the HGDP focusing on more isolated populations. However, analysis of the combined data set revealed global patterns of population structure consistent with those previously observed, with the POPRES samples clustering with the corresponding HGDP populations (Supplemental Fig. S1). It is perhaps worth noting that the HGDP populations form tighter clusters than the POPRES populations, which is to be expected given the disparate sampling schemes of the two studies. Furthermore, while the POPRES populations tend to cluster around their HGDP counterparts, the Mexican population forms an elongated cluster similar to that observed in the Mexican/European PCA (Fig. 2A) extending between the European and Native American populations (Supplemental Fig. S1B).
Patterns of haplotype diversity
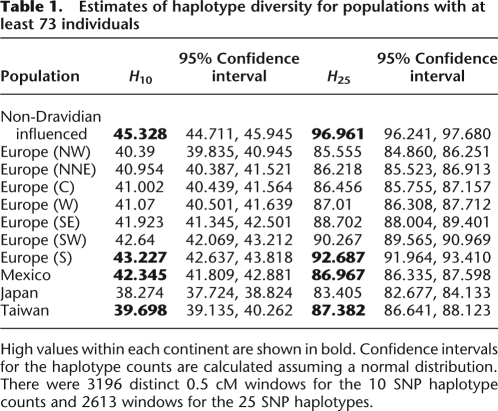
Patterns of LD among SNPs provide important information regarding human evolutionary history. As a summary of LD within populations, we considered the average haplotype diversity in each population. We chose to summarize haplotype diversity for each population by the average number of distinct haplotypes in 0.5 cM windows spread throughout the autosomal genome. To circumvent the problem of differential SNP ascertainment biases between population groups, we only considered SNPs with MAF > 10% in all populations (having corrected for sample size—see Methods). We controlled for heterogeneity in SNP density by first discarding windows containing less than 10 SNPs. The remaining windows containing up to 25 SNPs were thinned to 10 SNPs, and those with 25 SNPs or more were thinned to 25 SNPs. Using the retained SNPs, the number of distinct haplotypes in the 10 SNP windows (H10) and the 25 SNP windows (H25) were estimated separately.
Table 1 shows the mean and estimated confidence intervals of the distribution of the number of haplotypes. For 10 SNP haplotypes, the East Asian populations have the fewest haplotypes, consistent with a smaller effective population size in East Asia relative to Central Asia and Europe, as well as with previous studies of haplotype diversity (Conrad et al. 2006; Jakobsson et al. 2008; Li et al. 2008) and SNP diversity (Keinan et al. 2007). Interestingly, we find that the Japanese population shows lower diversity than the Taiwanese population. This could be explained by either lower levels of migration or a more severe bottleneck in Japan relative to Taiwan. The non-Dravidian-influenced group has the highest haplotype diversity of all the sampled populations (and the Dravidian-influenced group shows similar levels of diversity—see Supplemental material), which is the expected pattern if humans migrated out of Africa via the Middle East and into India. The Mexican population has a higher number of haplotypes relative to the East Asian populations, but less diversity than Southern European populations (for both H10 and H25). This pattern is consistent (and expected) under a model with East Asian origin of ancestral Native American populations and recent European admixture. Under this model, the initial founder population likely had lower haplotype diversity than the East Asian populations, but European admixture led to increased diversity.
Table 1.
Estimates of haplotype diversity for populations with at least 73 individuals
High values within each continent are shown in bold. Confidence intervals for the haplotype counts are calculated assuming a normal distribution. There were 3196 distinct 0.5 cM windows for the 10 SNP haplotype counts and 2613 windows for the 25 SNP haplotypes.
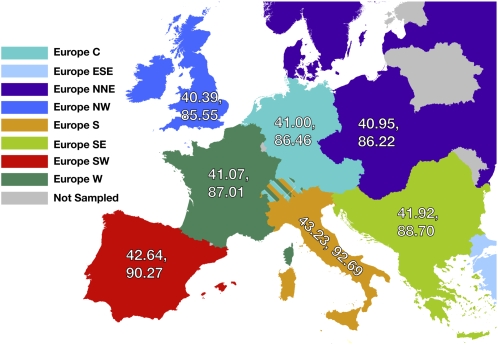
The high number of samples spanning Europe allowed us to investigate geographic patterns of haplotype diversity at a more localized level. We see a north–south gradient in the number of haplotypes present for both H10 and H25 (Fig. 3A) with the highest levels of diversity being found in the southern regions. In particular, South Western Europe has a higher mean number of haplotypes than South Eastern Europe and Western and Central Europe. This is unexpected, as many current models of historical human migration predict numerous migrations into Europe from Africa via the Middle East, and one would therefore expect the highest diversity in the south and east, with decreasing diversity moving north and west (Chikhi et al. 2002; Barbujani and Goldstein 2004; Hellenthal et al. 2008). The excess haplotype diversity in South Western Europe has at least two possible explanations. First, it may reflect direct migration from North Africa across the Mediterranean. Alternatively, it may represent a recolonization of Europe after a period of glaciation during which the Southern areas of Europe became a refugium for the prehistorical human population (Willis and Whittaker 2000; Barbujani and Goldstein 2004).
Figure 3.
Haplotype diversity within Europe. Geographic regions are color coded. Individuals from Switzerland (striped region) were grouped into adjoining regions on the basis of spoken language. Two numbers are shown within each region, with the first representing H10 and the second representing H25.
To address this issue, we investigated the level of haplotype sharing between African and European populations. In the absence of 500K data from North African populations (the HGDP having been genotyped on a different platform), we investigated patterns of haplotype sharing with the HapMap Yoruba (YRI) population. Using the 25 SNP haplotype windows outlined above, we found that South West Europe had the highest proportion of haplotypes that are shared with YRI (Supplemental Table S5). Furthermore, there were significantly more shared haplotypes between South West Europe and YRI relative to South East Europe and YRI (P-value 0.0072; Mann-Whitney U-test), which suggests that the unusually high haplotype diversity in South Western Europe is indicative of gene flow from Africa. However, it is perhaps worth noting that this does not preclude the refugium hypothesis from also contributing to the pattern.
Similarly, we investigated the level of haplotype sharing between Mexico and the European populations. Consistent with historical evidence, the highest proportion of haplotypes in Mexico is shared with South West Europe (Supplemental Table S6). However, while the level of haplotype sharing declines from South West Europe, differences between regions do not reach significance. This suggests either incomplete power to detect Mexican haplotypes within Europe, or that European haplotypes are not sufficiently diverged to be isolated to a single region.
Identification of recent common ancestry
Runs of homozygosity (i.e., stretches of the genome devoid of heterozygous SNPs) are expected within an individual when both homologous chromosomes share a recent common ancestor. In randomly mating populations, runs of homozygosity may be indicative of historical population demographics, with more runs of homozygosity expected in populations with a small founder population. Alternatively, long runs of homozygosity (LROHs) are potentially indicative of autozygosity due to recent consanguinity (Li et al. 2006).
To identify LROHs in the POPRES samples, we have developed a method based on a simple hidden Markov model (HMM). The HMM consists of two states for each SNP, which represent either a LROH or a heterozygous region. The emission probabilities at each SNP for each state are dependent on the probability of observing a heterozygote, based on the heterozygosity of the SNP within the population, and the estimated rate of genotyping error. Transition probabilities between the two states are a function of the per-generation recombination rate between SNPs and the (assumed) number of generations since a common ancestor of the two chromosomes. In practice, we call a LROH when the HMM reports the homozygous state as being the most likely state in a region of at least 1 cM and containing at least 50 SNPs with a minimum minor allele frequency of 5%. Since hemizygous deletions may also appear as a run of homozygous calls on the genotyping platform, we used GeneChip oligonucleotide hybridization intensities to detect and remove any possible hemizygote deletions from the analysis (see Supplemental material).
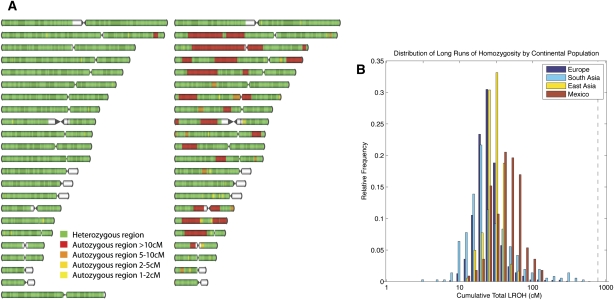
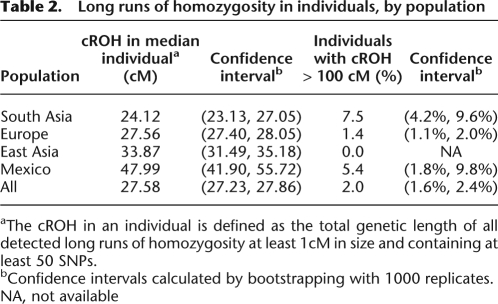
Examples of the detection of LROH in two individuals are shown in Figure 4A. We observe that the majority of individuals exhibit low levels of autozygosity. The median individual in the POPRES has ∼27.6 cM of the autosomal genome contained within LROHs (0.8% of the genome, assuming an autosomal map length of 3614.71 cM; Kong et al. 2002). Furthermore, the median individual within each population shows similarly low levels of autozygosity (Table 2). However, the median individuals in Mexico and East Asia have a slightly greater cumulative length of runs of homozygosity (cROH) than the other populations, which most likely reflects smaller founder population sizes in these populations.
Figure 4.
Patterns of homozygosity in the human genome. (A) Genome ideograms (ordered by chromosome number with chromosome 1 at the top) showing LROHs in two European individuals. The female individual shown on the left shows typical levels of homozygosity, whereas the male individual shown on the right shows the most LROHs in the study. (B) Distribution of the cumulative total LROH per individual by continental population (shown on a log scale). The location of the most extreme individual (shown in A) is indicated by a vertical dashed black line. Note that the total genetic length of the human genome is ∼3614 cM (Kong et al. 2002).
Table 2.
Long runs of homozygosity in individuals, by population
aThe cROH in an individual is defined as the total genetic length of all detected long runs of homozygosity at least 1cM in size and containing at least 50 SNPs.
bConfidence intervals calculated by bootstrapping with 1000 replicates.
NA, not available
While the median individual within each population has relatively low levels of autozygosity, the distribution of cROH per individual exhibits long tails, with some individuals showing LROH in a large fraction of the genome (Fig. 4B). All populations have a small number of individuals that are homozygous in over 3% of the genome, and a few individuals are homozygous in over 10% of the genome. These very long runs are suggestive of recent consanguinity. Approximately 2% of individuals in the POPRES have more than 100 cM of sequence contained in LROH (Table 2), and this proportion varies by population (P-value = 3 × 10⁻¹¹; two-tailed Fisher's exact test).
Certain large regions of the genome appear to be homozygous in a high proportion of individuals. We define highly homozygous regions (HHRs) as regions of at least 50 SNPs that are found to be LROH's in at least 10.0% of individuals within a population. We find 39 HHRs in the four subcontinental populations (Supplemental Fig. S8; Supplemental Table S8). The majority of HHRs are found in the East Asian and Mexican populations with 22 and 15 HHRs, respectively, compared to one HHR apiece in the European and South Asian populations. This suggests stronger foundational bottlenecks for the East Asian and Mexican populations (see Supplemental material).
Discussion
Genome-wide patterns of nucleotide and haplotype diversity within and among human populations can inform our understanding of ancient events in our species history. In contrast, individual genomic patterns are informative of a person's very recent ancestry and can potentially be used to reconstruct personalized genetic history.
In this paper, we have presented a genome-wide study of genotypic and haplotypic variation among 3845 individuals with ancestry spanning four major geographic regions. As the majority of the data were collected from individuals living in urban areas, it can be considered a cross section of typical human genetic diversity in these populations. The data are also of interest due to both the depth of sampling, and the inclusion of two populations (Mexico and South Asia) for which genome-wide genotype data have not been extensively available. The data set is therefore complementary to other large studies of genetic variation, such as the HapMap and the HGDP.
Our data provide new insights into the nature of human population structure. The historical admixture between Native American and European populations is clearly visible in the Mexican samples. However, it is perhaps worth noting the relative difficulty in identifying the European region with the highest degree of haplotype sharing with the Mexican individuals. While individuals from South West Europe do share the highest proportion of haplotypes with the Mexican individuals, the difference from other European populations is not statistically significant. As the level of genetic differentiation within Europe is small (Novembre et al. 2008), this is perhaps not surprising. However, with the advent of full sequence data, it will be possible to identify markers that are highly informative of European geographic origin, and hence better understand the history of Mexican population admixture.
To date, few high-density genome-wide SNP studies have been performed in South Asian populations, and the level of genetic diversity in this region is still open to debate (Rosenberg et al. 2006; Indian Genome Variation Consortium 2008). We observe relatively high levels of haplotype diversity in this region, and while regional geographic information was not available for the South Asian individuals in our study, clustering by spoken language suggests the geographic separation is likely an important factor in determining genetic separation in this population as well. Further studies are warranted using genome-wide data in order to further elucidate the genetic history of this region.
Our analyses also have direct relevance to current debates in human population genetics regarding the extent of historical gene flow among Africa, Europe, and the Middle East (Rando et al. 1998; Bosch et al. 2000, 2002; Simoni et al. 2000). Our observation of a north–south gradient in diversity with the highest estimates of diversity in the southern part of the continent is consistent with the initial founding of Europe from the Middle East, the influence of Neolithic farmers within the last 10,000 yr, or migrations south followed by a recolonization of Europe after the last glacial maximum. The unusually high number of haplotypes in South Western Europe is indicative of recurrent gene flow into these regions. Furthermore, when we considered the extent of haplotype sharing with the HapMap YRI population in Europe, we found that the South and South-Western subpopulations showed the highest proportion of shared haplotypes. If gene flow had occurred solely through the Middle East, we would expect the South-Eastern subpopulations to have the highest haplotype diversity and sharing of YRI haplotypes. These two results therefore suggest that while the initial migrations into Europe came via the Middle East, at least some degree of subsequent gene flow has occurred directly from Africa.
A potential concern is that the HapMap YRI are not representative of diversity in North Africa, and the levels of haplotype sharing must be interpreted with this in mind. It is currently unclear how patterns of genetic diversity in the Yoruba are representative of the wider region, although genetic similarity appears to decline with distance (Conrad et al. 2006; Jakobsson et al. 2008). Nonetheless, the haplotype sharing between Europe and the YRI are suggestive of gene flow from Africa, albeit from West Africa and not necessarily North Africa. Future studies will hopefully be able to better resolve this question by comparing haplotypes from further populations around the Mediterranean.
We have also applied a novel method to identify regions of each individual's genome with elevated levels of homozygosity. The vast majority of individuals within the POPRES show low levels of homozygosity likely reflective of the recent large effective population size of our species. The small fraction of individuals who show significantly higher levels of homozygosity are likely offspring of consanguineous unions. We also find a number of regions in the human genome that are homozygous across a high proportion of individuals. These regions provide an indication of the relative strength of the founding bottlenecks of each population, and suggest stronger founding bottlenecks in East Asian and Mexican populations.
The POPRES collection is expected to grow both in terms of the number of individuals within the study, and the number of SNPs genotyped as new genotyping technologies become available. As such, we expect that POPRES will become an important resource for ongoing studies in both population and medical genetics.
Methods
Description of the data
Individuals were genotyped at 500,568 SNPs on the Affymetrix GeneChip Mapping Array 500K set by GlaxoSmithKline as part of the POPRES initiative. As such, a full description of the sampling protocol can be found in Nelson et al. (2008). Briefly, individuals were sampled in eight batches between November 2005 and March 2007. In total, six studies contributed to the POPRES samples studied in this paper, details of which can be found in Nelson et al. (2008); The CoLaus study (2508 individuals sampled in Lausanne, Switzerland), the LOLIPOP study (843 individuals sampled in London, England), healthy Caucasian controls (201 individuals sampled in Adelaide, Australia, North Carolina, USA or Ottawa, Canada), healthy Mexican controls (112 individuals sampled in Guadalajara, Mexico), healthy Taiwanese controls (108 individuals sampled in Taipei, Taiwan) and healthy Japanese controls (73 individuals sampled in Sydney, Australia).
Individuals in the CoLaus study (covering individuals of European and South Asian ancestry) were asked for information regarding parental and grandparental country of birth. Primary language information was also collected for sections of the CoLaus and LOLIPOP studies. For certain analyses detailed in this paper, we used a “strict” data set of 2943 individuals that excludes individuals with either ambiguous or reported mixed ancestry, PCA outliers, and those with estimated identity by descent with another individual in the sample greater than 20%.
European individuals were assigned to countries using grandparental country of birth where possible. If all observed grandparents originate from a single country, then that country was used as the ancestral location for the individual. In the case of mixed ancestry, individuals were assigned to a separate group (Mix). In the absence of grandparental information, individuals were assigned on the basis of country of birth. Mexican and East Asian individuals were assigned to groups on the basis of self-identified ancestry. Finally, South Asian individuals were assigned to groups on the basis of spoken language. Full details of the ancestral data available, and assigned groupings, for each individual are available as a supplementary table. For certain subsequent analyses, country and language groupings were combined to form larger groups, as detailed in Supplemental Table S1.
SNP positions were mapped to NCBI build 36.1 (UCSC hg18). After applying quality control filters (Nelson et al. 2008), a total of 443,434 SNPs remained, giving an average SNP spacing of 1 SNP every 6.4 kb in the assembled genome. Individuals have an average missing genotype rate of ∼2.3%. Summaries of minor allele frequency spectra are given in the Supplemental material.
Principal component analysis
Principal component analysis (PCA) was conducted using the program SMARTPCA contained in version 2.0 of the EIGENSOFT package (Patterson et al. 2006). The analysis was run without the removal of outliers. To avoid artifacts due to linkage disequilibrium we first used PLINK (Purcell et al. 2007) to thin the data by excluding SNPs with pairwise genotype r2 > 0.8 within a sliding window of 50 SNPs.
For the global PCA analysis, we combined the POPRES data set with 479 individuals from the HGDP (Jakobsson et al. 2008). As the two data sets were obtained using separate genotyping platforms, only a subset of SNPs are common to both. After requiring that no SNP have more than 5% missing data, and removing SNPs in high LD as described above, the combined data set consisted of 73,520 SNPs in 3448 individuals.
For the Asian subcontinental PCA analysis we excluded related individuals and kept 271 individuals from Japan, Taiwan, and HapMap JPT and CHB. In our analysis of regional structure within South Asia, we included 315 individuals from India and Sri Lanka whose language information was known and not primarily English. For the Mexican admixture analysis, we created a set of 778 individuals that included the Mexican individuals, a small subset of mainland Europeans used in the world structure analysis, and East Asian populations used in the Asian subcontinental analysis.
structure analysis
For the global structure analysis, we selected a subset of individuals from the strict data set (including the HapMap samples). Due to the large number of European samples, we applied additional filters to individuals from this continent, including only individuals with self-reported ancestry from European countries. Furthermore, any European country with more than 15 individuals was reduced to 15 individuals, selected at random from the population. We also excluded individuals found to be outliers based on preliminary PCA runs conducted separately on the East Asian, European, and South Asian samples. PCA-based outliers were determined by using SMARTPCA with default settings (Patterson et al. 2006). This approach removes individuals whose PC coordinates are more than six standard deviations from the mean coordinate along any of the top 10 principal components, and repeats this process for a maximum of five iterations. After applying these filters, 1245 individuals remained.
In order to make the run-time tractable, we reduced the number of markers to 6567 SNPs by selecting those with MAF > 0.2 and a minimal separation of 400 kb. The relatively high MAF threshold was selected in an attempt to minimize SNP ascertainment effects biasing toward one population or another. However, alternative SNP selection schemes give qualitatively similar results, including those using lower MAF thresholds. We ran structure version 2.2 without prior population assignment, using the correlated alleles model, with 10,000 iterations burn-in and 10,000 run time. We used the INFERALPHA option under the admixture model (also known as the F model), with the allele frequency prior parameter LAMBDA set to 1. Results were plotted using DISTRUCT (Rosenberg 2004). The results for K = 2 to K = 6 are shown in Supplemental Figure S3(A). Repeated runs of structure give qualitatively similar results.
The subcontinental analyses are described in the Supplemental material using a similar SNP selection method with markers selected independently for each analysis.
Haplotype diversity
As described in the main text, we summarized haplotype diversity by the number of distinct haplotypes contained within 0.5 cM windows. Haplotypes were obtained by phasing the genotype data using Beagle (Browning and Browning 2007), as described in the Supplemental material. While the amount of ascertainment bias for the Affymetrix 500K chips is difficult to characterize, it is likely to vary from population to population. In order to circumvent the problem of ascertainment bias, we only considered SNPs with MAF > 10% in all of the studied population groups (after sample size correction; see below). By only including the SNPs common to all populations in the diversity analyses, differences in haplotype diversity among populations are largely governed by differences in the effective population size between populations.
Using the Phase II HapMap genetic map (The International HapMap Consortium 2007), we divided the genome into 0.5 cM windows. For each chromosome, the first window started at the position of the first SNP and then extended 0.5 cM downstream. The second window started at the position where the first window ended, regardless of SNP locations. To ensure that separate regions of the genome had similar numbers of SNPs for the estimation of haplotype diversity, we selected a subset of SNPs within each window. We classified each of the 0.5 cM windows into one of three groups: (1) <10 SNPs, (2) 10–24 SNPs, and (3) ≥25 SNPs. Windows having <10 SNPs were excluded from the analysis, as it was likely that haplotype diversity would be low in all populations. For windows having 10–24 SNPs, we selected a random subset of 10 SNPs for each window. For windows with ≥25 SNPs, we selected a random subset of 25 SNPs for each window. For each window, the same set of SNPs was chosen for all of the population groupings. In the subsequent analyses, the windows with 10 SNPs were analyzed separately from the windows with 25 SNPs.
The number of haplotypes in each region of the genome is confounded by the number of chromosomes sampled in each population, as populations with more sampled chromosomes will be more likely to include more rare haplotypes. As the number of individuals sampled from each population varies quite dramatically with some populations having small sample sizes (Supplemental Table S1), we focused our attention on populations with more than 20 individuals. In practice, this threshold excluded only two populations with less than 73 individuals, namely the Dravidian-influenced and Europe ESE groups. We then selected a random subset of individuals (without replacement) from each remaining population to use for subsequent analyses. Minor allele frequencies were calculated for each SNP in each population using these smaller subsamples of 73 individuals from each population. We repeated the haplotype analyses using several different random subsets of 73 individuals and did not see a substantial difference between replicates.
Identification of runs of homozygosity
To identify runs of homozygosity, we developed a novel method based on a hidden Markov model (HMM). The model consists of two hidden states, namely autozygous (A) and non-autozygous (¬A). If SNP i has genotypic state Xi (equals 0, 1, 2, where 1 is the heterozygous state), and hidden state Si, the emission probabilities for the two states at each SNP are given by
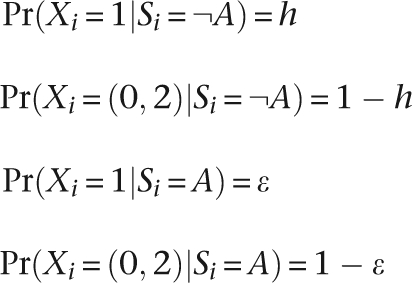 |
where h is the observed SNP heterozygosity in the population and ɛ is the assumed genotyping error. We set ɛ = 0.2%.
The transition probabilities between hidden states are a function of the genetic map distance between SNPs, as estimated by the Phase II HapMap (The International HapMap Consortium 2007), and the expected number of meioses (M) since a recent common ancestor:
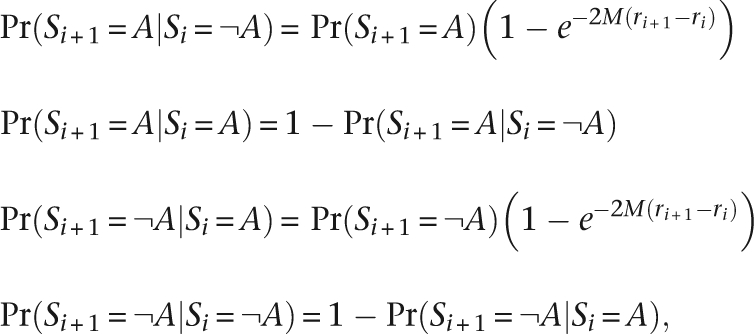 |
where ri is the genetic map location of SNP i in Morgans. In practice, we chose M to be 4, to reflect our interest in homozygosity caused by recent common ancestry. However, we have found the method to be largely robust to values of M up to 10 (data not shown). For the prior probabilities of being in the autozygous or non-autozygous state, we chose 0.05 and 0.95, respectively.
We use the Viterbi algorithm to find the most likely hidden state path (see, for example, Durbin et al. 1999).
Acknowledgments
We dedicate this paper to the memory of our friend and colleague, Scott Williamson. We thank Brian Browning for providing the program Beagle and advice for phasing. We also thank Jonathan Pritchard for making the structure source code available. Andy Clark, Hong Gao, Ryan Hernandez, Sean Myles, and Keyan Zhao provided numerous helpful insights. This work was supported by NIH R01GM083606 (C.D.B., K.B.), NIH 1U01HL084706 (A.R.B., A.I.), an NSF graduate research fellowship (K.E.L.), an NSF Postdoctoral Research Fellowship in Biological Informatics (J.N.), NSF-DBI 0701382 (A.R., M.H.W.), and NSF 0516310 (J.D.). Performed analyses: A.A., K.B., A.R.B., K.E.L., J.D., R.N.G.; conceived analyses: A.A., K.B., A.R.B., K.E.L., J.N., C.D.B.; contributed data: K.S.K., M.R.N.; quality control of data: A.R.B., M.H.W., A.I., A.R.; wrote the paper: A.A., C.D.B.
Footnotes
[Supplemental material is available online at www.genome.org. The POPRES data used in this study is available in the dbGaP archive, http://www.ncbi.nlm.nih.gov/gap.]
Article is online at http://www.genome.org/cgi/doi/10.1101/gr.088898.108.
References
- Barbujani G., Goldstein D. Africans and Asians abroad: Genetic diversity in Europe. Annu. Rev. Genomics Hum. Genet. 2004;5:119–150. doi: 10.1146/annurev.genom.5.061903.180021. [DOI] [PubMed] [Google Scholar]
- Basu A., Mukherjee N., Roy S., Sengupta S., Banerjee S., Chakraborty M., Dey B., Roy M., Roy B., Bhattacharyya N., et al. Ethnic India: A genomic view, with special reference to peopling and structure. Genome Res. 2003;13:2277–2290. doi: 10.1101/gr.1413403. [DOI] [PMC free article] [PubMed] [Google Scholar]
- Bosch E., Calafell F., Perez-Lezaun A., Clarimon J., Comas D., Mateu E., Martinez-Arias R., Morera B., Brakez Z., Akhayat O., et al. Genetic structure of north-west Africa revealed by STR analysis. Eur. J. Hum. Genet. 2000;8:360–366. doi: 10.1038/sj.ejhg.5200464. [DOI] [PubMed] [Google Scholar]
- Bosch E., Lee A.C., Calafell F., Arroyo E., Henneman P., de Knijff P., Jobling M.A. High resolution Y chromosome typing: 19 STRs amplified in three multiplex reactions. Forensic Sci. Int. 2002;125:42–51. doi: 10.1016/s0379-0738(01)00627-2. [DOI] [PubMed] [Google Scholar]
- Browning S.R., Browning B.L. Rapid and accurate haplotype phasing and missing-data inference for whole-genome association studies by use of localized haplotype clustering. Am. J. Hum. Genet. 2007;81:1084–1097. doi: 10.1086/521987. [DOI] [PMC free article] [PubMed] [Google Scholar]
- Chikhi L., Nichols R.A., Barbujani G., Beaumont M.A. Y genetic data support the Neolithic demic diffusion model. Proc. Natl. Acad. Sci. 2002;99:11008–11013. doi: 10.1073/pnas.162158799. [DOI] [PMC free article] [PubMed] [Google Scholar]
- Conrad D.F., Jakobsson M., Coop G., Wen X., Wall J.D., Rosenberg N.A., Pritchard J.K. A worldwide survey of haplotype variation and linkage disequilibrium in the human genome. Nat. Genet. 2006;38:1251–1260. doi: 10.1038/ng1911. [DOI] [PubMed] [Google Scholar]
- Coop G., Wen X., Ober C., Pritchard J.K., Przeworski M. High-resolution mapping of crossovers reveals extensive variation in fine-scale recombination patterns among humans. Science. 2008;319:1395–1398. doi: 10.1126/science.1151851. [DOI] [PubMed] [Google Scholar]
- Durbin R., Eddy S.R., Krogh A., Mitchison G. Biological sequence analysis: Probabilistic models of proteins and nucleic acids. Cambridge University Press; 1999. [Google Scholar]
- Hellenthal G., Auton A., Falush D. Inferring human colonization history using a copying model. PLoS Genet. 2008;4:e1000078. doi: 10.1371/journal.pgen.1000078. [DOI] [PMC free article] [PubMed] [Google Scholar]
- Hinds D.A., Stuve L.L., Nilsen G.B., Halperin E., Eskin E., Ballinger D.G., Frazer K.A., Cox D.R. Whole-genome patterns of common dna variation in three human populations. Science. 2005;307:1072–1079. doi: 10.1126/science.1105436. [DOI] [PubMed] [Google Scholar]
- Indian Genome Variation Consortium. Genetic landscape of the people of India: A canvas for disease gene exploration. J. Genet. 2008;87:3–20. doi: 10.1007/s12041-008-0002-x. [DOI] [PubMed] [Google Scholar]
- The International HapMap Consortium. A haplotype map of the human genome. Nature. 2005;437:1299–1320. doi: 10.1038/nature04226. [DOI] [PMC free article] [PubMed] [Google Scholar]
- The International HapMap Consortium. A second generation human haplotype map of over 3.1 million SNPs. Nature. 2007;449:851–861. doi: 10.1038/nature06258. [DOI] [PMC free article] [PubMed] [Google Scholar]
- Jakobsson M., Scholz S.W., Scheet P., Gibbs J.R., VanLiere J.M., Fung H.C., Szpiech Z.A., Degnan J.H., Wang K., Guerreiro R., et al. Genotype, haplotype and copy-number variation in worldwide human populations. Nature. 2008;451:998–1003. doi: 10.1038/nature06742. [DOI] [PubMed] [Google Scholar]
- Kashyap V., Guha S., Sitalaximi T., Bindu G., Hasnain S., Trivedi R. Genetic structure of Indian populations based on fifteen autosomal microsatellite loci. BMC Genet. 2006;7:28. doi: 10.1186/1471-2156-7-28. [DOI] [PMC free article] [PubMed] [Google Scholar]
- Keinan A., Mullikin J., Patterson N., Reich D. Measurement of the human allele frequency spectrum demonstrates greater genetic drift in East Asians than in Europeans. Nat. Genet. 2007;39:1251–1255. doi: 10.1038/ng2116. [DOI] [PMC free article] [PubMed] [Google Scholar]
- Kidd J., Cooper G., Donahue W., Hayden H., Sampas N., Graves T., Hansen N., Teague B., Alkan C., Antonacci F., et al. Mapping and sequencing of structural variation from eight human genomes. Nature. 2008;453:56–64. doi: 10.1038/nature06862. [DOI] [PMC free article] [PubMed] [Google Scholar]
- Kong A., Gudbjartsson D.F., Sainz J., Jonsdottir G.M., Gudjonsson S.A., Richardsson B., Sigurdardottir S., Barnard J., Hallbeck B., Masson G., et al. A high-resolution recombination map of the human genome. Nat. Genet. 2002;31:241–247. doi: 10.1038/ng917. [DOI] [PubMed] [Google Scholar]
- Li L., Ho S., Chen C., Wei C., Wong W., Li L., Hung S., Chung W., Pan W., Lee M., et al. Long contiguous stretches of homozygosity in the human genome. Hum. Mutat. 2006;27:1115–1121. doi: 10.1002/humu.20399. [DOI] [PubMed] [Google Scholar]
- Li J.Z., Absher D.M., Tang H., Southwick A.M., Casto A.M., Ramachandran S., Cann H.M., Barsh G.S., Feldman M., Cavalli-Sforza L.L., et al. Worldwide human relationships inferred from genome-wide patterns of variation. Science. 2008;319:1100–1104. doi: 10.1126/science.1153717. [DOI] [PubMed] [Google Scholar]
- Myers S., Spencer C.C., Auton A., Bottolo L., Freeman C., Donnelly P., McVean G. The distribution and causes of meiotic recombination in the human genome. Biochem. Soc. Trans. 2006;34:526–530. doi: 10.1042/BST0340526. [DOI] [PubMed] [Google Scholar]
- Nelson M., Bryc K., King K., Indap A., Boyko A., Novembre J., Briley L., Maruyama Y., Waterworth D., Waeber G., et al. The population reference sample, POPRES: A resource for population, disease, and pharmacological genetics research. Am. J. Hum. Genet. 2008;83:347–358. doi: 10.1016/j.ajhg.2008.08.005. [DOI] [PMC free article] [PubMed] [Google Scholar]
- Novembre J., Johnson T., Bryc K., Boyko A., Auton A., Indap A., King K., Bergmann S., Nelson M., Stephens M., et al. Genes mirror geography within Europe. Nature. 2008;456:98–101. doi: 10.1038/nature07331. [DOI] [PMC free article] [PubMed] [Google Scholar]
- Patterson N., Price A.L., Reich D. Population structure and eigenanalysis. PLoS Genet. 2006;2:e190. doi: 10.1371/journal.pgen.0020190. [DOI] [PMC free article] [PubMed] [Google Scholar]
- Price A., Patterson N., Yu F., Cox D., Waliszewska A., McDonald G., Tandon A., Schirmer C., Neubauer J., Bedoya G., et al. A genomewide admixture map for latino populations. Am. J. Hum. Genet. 2007;80:1024–1036. doi: 10.1086/518313. [DOI] [PMC free article] [PubMed] [Google Scholar]
- Pritchard J.K., Stephens M., Donnelly P. Inference of population structure using multilocus genotype data. Genetics. 2000;155:945–959. doi: 10.1093/genetics/155.2.945. [DOI] [PMC free article] [PubMed] [Google Scholar]
- Purcell S., Neale B., Todd-Brown K., Thomas L., Ferreira M.A., Bender D., Maller J., Sklar P., de Bakker P.I., Daly M.J., et al. PLINK: A tool set for whole-genome association and population-based linkage analyses. Am. J. Hum. Genet. 2007;81:559–575. doi: 10.1086/519795. [DOI] [PMC free article] [PubMed] [Google Scholar]
- Rando J., Pinto F., Gonzalez A., Hernandez M., Larruga J., Cabrera V., Bandelt H. Mitochondrial DNA analysis of Northwest African populations reveals genetic exchanges with European, Near-Eastern, and sub-Saharan populations. Ann. Hum. Genet. 1998;62:531–550. doi: 10.1046/j.1469-1809.1998.6260531.x. [DOI] [PubMed] [Google Scholar]
- Redon R., Ishikawa S., Fitch K.R., Feuk L., Perry G.H., Andrews T.D., Fiegler H., Shapero M.H., Carson A.R., Chen W., et al. Global variation in copy number in the human genome. Nature. 2006;444:444–454. doi: 10.1038/nature05329. [DOI] [PMC free article] [PubMed] [Google Scholar]
- Rosenberg N. DISTRUCT: A program for the graphical display of population structure. Mol. Ecol. Notes. 2004;4:137–138. [Google Scholar]
- Rosenberg N., Mahajan S., Gonzalez-Quevedo C., Blum M., Nino-Rosales L., Ninis V., Das P., Hegde M., Molinari L., Zapata G., et al. Low levels of genetic divergence across geographically and linguistically diverse populations from India. PLoS Genet. 2006;2:e215. doi: 10.1371/journal.pgen.0020215. [DOI] [PMC free article] [PubMed] [Google Scholar]
- Sabeti P.C., Varilly P., Fry B., Lohmueller J., Hostetter E., Cotsapas C., Xie X., Byrne E.H., McCarroll S.A., Gaudet R., et al. Genome-wide detection and characterization of positive selection in human populations. Nature. 2007;449:913–918. doi: 10.1038/nature06250. [DOI] [PMC free article] [PubMed] [Google Scholar]
- Salari K., Choudhry S., Tang H., Naqvi M., Lind D., Avila P., Coyle N., Ung N., Nazario S., Casal J., et al. Genetic admixture and asthma-related phenotypes in Mexican American and Puerto Rican asthmatics. Genet. Epidemiol. 2005;29:76–86. doi: 10.1002/gepi.20079. [DOI] [PubMed] [Google Scholar]
- Schaffner S.F. The X chromosome in population genetics. Nat. Rev. Genet. 2004;5:43–51. doi: 10.1038/nrg1247. [DOI] [PubMed] [Google Scholar]
- Schaffner S.F., Foo C., Gabriel S., Reich D., Daly M.J., Altshuler D. Calibrating a coalescent simulation of human genome sequence variation. Genome Res. 2005;15:1576–1583. doi: 10.1101/gr.3709305. [DOI] [PMC free article] [PubMed] [Google Scholar]
- Simoni L., Calafell F., Pettener D., Bertranpetit J., Barbujani G. Geographic patterns of mtDNA diversity in Europe. Am. J. Hum. Genet. 2000;66:262–278. doi: 10.1086/302706. [DOI] [PMC free article] [PubMed] [Google Scholar]
- Tian C., Hinds D., Shigeta R., Adler S., Lee A., Pahl M., Silva G., Belmont J., Hanson R., Knowler W., et al. A genomewide single-nucleotide–polymorphism panel for Mexican American admixture mapping. Am. J. Hum. Genet. 2007;80:1014–1023. doi: 10.1086/513522. [DOI] [PMC free article] [PubMed] [Google Scholar]
- Voight B., Kudaravalli S., Wen X., Pritchard J. A map of recent positive selection in the human genome. PLoS Biol. 2006;4:e72. doi: 10.1371/journal.pbio.0040072. [DOI] [PMC free article] [PubMed] [Google Scholar]
- Wang S., Ray N., Rojas W., Parra M.V., Bedoya G., Gallo C., Poletti G., Mazzotti G., Hill K., Hurtado A.M., et al. Geographic patterns of genome admixture in Latin American Mestizos. PLoS Genet. 2008;4:e1000037. doi: 10.1371/journal.pgen.1000037. [DOI] [PMC free article] [PubMed] [Google Scholar]
- Williamson S.H., Hubisz M.J., Clark A.G., Payseur B.A., Bustamante C.D., Nielsen R. Localizing recent adaptive evolution in the human genome. PLoS Genet. 2007;3:e90. doi: 10.1371/journal.pgen.0030090. [DOI] [PMC free article] [PubMed] [Google Scholar]
- Willis K., Whittaker R. The refugial debate. Science. 2000;287:1406–1407. doi: 10.1126/science.287.5457.1406. [DOI] [PubMed] [Google Scholar]


