Abstract
LIN9 has been described as a regulator of G1/S and G2/M progression of the cell cycle in invertebrates and human cell lines. To elucidate the in vivo function of LIN9 during vertebrate development, we took advantage of the teleost zebrafish (Danio rerio). By means of antisense morpholinos we show here that Lin9-depleted embryonic cells accumulate in mitosis. Flow cytometry and confocal microscopy data demonstrate that the delay in mitotic progression is followed by apoptosis, which strongly manifests in the developing central nervous system. In accordance with these findings, we identified a cohort of Lin9-regulated genes required for different mitotic processes, including mitotic entry, metaphase/anaphase transition, and cytokinesis. Our data establish LIN9 as an essential regulator of mitosis in vertebrate development.
The transition from G1 to S phase marks the starting point of the eukaryotic cell to replicate its chromosomal set of DNA. This event is followed by the G2 period that prepares the cell for mitosis, a process that results in the separation of the duplicate chromosome set into two nuclei. The progression through the cell cycle is regulated by multiple processes, including regulated gene transcription. For example, E2F transcription factors play a key role in the activation of S phase entry genes during the G1 phase of the cell cycle (reviewed in Ref. 1). Likewise, several transcription factors are implicated to play a role in the activation of mitotic genes during S phase, among them NF-Y, B-MYB, and FOXM1 (2-4).
LINC/DREAM is a recently identified multiprotein complex that is required for two transcriptional processes that act on cell cycle regulation, namely repression of genes that drive G1/S transition and activation of genes required for G2/M progression (3, 5, 6). LINC/DREAM consists of the core members LIN9, LIN54, LIN37, LIN52, and RBAP48. Interestingly, LINC/DREAM undergoes a dynamic and cell cycle-dependent switch of subunits (7, 8). In G0/G1, the complex is associated with p130 and E2F4, whereas in late S phase it interacts with B-MYB and activates G2/M promoters.
LINC/DREAM is evolutionarily highly conserved. A DREAM-like complex was first purified from Drosophila embryo lysates and was named Myb-MuvB (MMB) or dREAM (for Drosophila RBF-, dE2F2-, and dMyb-interacting proteins) (9, 10). Although initially described as complexes involved in the repression of E2F target genes during fly development, a recent study indicates that dREAM/Myb-MuvB also regulate the activation of genes required for mitotic progression (11). Furthermore, a related complex has also been identified in Caenorhabditis elegans (12).
B-MYB, a subunit of the activating LINC complex in S phase and G2, is essential for early mouse embryogenesis, and its short hairpin RNA-mediated knockdown in murine ES cells results in a delay of G2/M progression, mitotic spindle and centrosome defects, and polyploidy (13, 14). In zebrafish, the bmyb loss-of-function mutation crash&burn (crb) results in a similar phenotype. crb fish exhibit defects in spindle formation and show genomic instability (15). crb embryonic cells accumulate in G2/M, and down-regulation of cyclin B is at least in part causative for this delay in cell cycle progression.
We and others have shown that LIN9, a core subunit of LINC, activates G2/M genes in human cells together with B-MYB. Mice carrying an 84-amino acid N-terminal deletion LIN9 have recently been generated (16). However, except for a mild increase in body size, they do not show any obvious phenotype. Since highly conserved regions of LIN9 are still retained, it is unlikely that Δ84 LIN9 represents a complete loss-of-function protein. Thus, the role of LIN9 in vertebrate development is still unclear.
To address the role of LIN9 in vertebrate development we now used zebrafish as a model system. We found that lin9 is essential for early zebrafish development. The loss of lin9 leads to an accumulation of embryonic cells in mitosis and an increase of apoptosis. Genome-wide gene expression analysis shows that Lin9 regulates a cluster of genes required for mitotic processes, among them the G2/M and the spindle assembly checkpoint, chromosome segregation, and cytokinesis. Our data suggest an overlap of B-MYB and LIN9 function throughout vertebrate development and establish the latter as a critical regulator of mitotic progression.
EXPERIMENTAL PROCEDURES
Morpholino and mRNA Injections—TÜAB zebrafish were maintained and staged as described (17, 18). The indicated times refer to hours postfertilization (hpf)2 at 28.5 °C. Embryos were kept in 1× Danieau solution (58 mm NaCl, 0.7 mm KCl, 0.4 mm MgSO4, 0.6 mm Ca(NO3)2, 5 mm HEPES, pH 7.6, 0.0001% methylene blue). Morpholinos (Gene Tools, Philomath, OR) were designed against Danio rerio lin9 homolog (GenBank™ accession NM_001044946). The morpholino (MO) sequences were as follows: MO-ATG, 5′-CTCGAGCTCCGCCATCTTGAATTAG-3′; MO-E1, 5′-GTTAGTTTTATTACTCACTCTCGTC-3′; 5-base mismatch morpholino MO-E1mis, 5′-GTTACTTTTAATACTGACTGTCCTC-3′. The indicated amounts of morpholinos were injected into one- or two-cell stage embryos. To follow morpholino uptake, a small amount (3.5 pmol) of fluorescein isothiocyanate-dextran (Sigma) was cooinjected. For capped RNA synthesis, plasmids containing full-length cDNAs for lin9 and ccnb1 (clone IRBOp991B0331D, obtained from imaGenes (Berlin, Germany)) were used. Linearized plasmids were transcribed in vitro with SP6 RNA polymerase using the mMessage mMachine kit from Ambion (Austin, TX).
RNA Isolation, Reverse Transcription (RT), PCR, and Cloning—20 embryos were dechorionated, washed in PBS, transferred to a 2 ml tube and homogenized in RLT buffer (Qiagen) with a micropestle. Total RNA was purified by means of an RNeasy minikit (Qiagen) according to the manufacturer's protocol. 0.65 μg of RNA were applied to RT by incubation with 0.5 μg of oligo(dT)17 primer and 100 units of Moloney murine leukemia virus reverse transcriptase (Promega) in a total volume of 25 μl. For end point PCR, we used the following primers: ef1a (NM_131263, bases 415-969), forward (5′-TGATTGTTGCTGGTGGTGTT-3′) and reverse (5′-GAGACTCGTGGTGCATCTCA-3′); lin54 (NM_001076567, bases 2037-2392), forward (5′-AGGCTGCAACTGCAAGAAAT-3′) and reverse (5′-CCTGCGGTTGATTGGTAAGT-3′); bmyb (NM_ 001003867, bases 797-1185), forward (5′-AGAACTGCCTGTCGAATGCT-3′) and reverse (5′-GACTCAGGATGGATGGAGGA-3′); lin9 (NM_001044946, bases 502-1043), forward (5′-AGTTGACCCGAGTTGAATGG-3′) and reverse (5′-CAGAGTCTCTCCGTCGGTTC-3′). For whole mount in situ hybridizations, the PCR product generated with the last pair of primers was TA-cloned into pCRII (Invitrogen). Clones were obtained with inserts in sense and antisense orientation. For amplification of full-length zebrafish lin9, we used the following primers: forward, 5′-TTTTGGATCCATGGCGGAGCTCGAGCAGCT-3′; reverse, 5′-TTTGCGGCCGCTCACGTTCTGTTGGTGTTGTTT-3′. The PCR product was cloned into pcDNA3 via BamHI and NotI restriction sites. Sequencing revealed that lin9 cDNA differed from GenBank™ accession number NM_001044946 in bases 155 (G to T) and 434 (T to A), resulting in an alteration of amino acid residue 39 (Gln to His). Quantitative PCR was performed using ABsolute™ QPCR SYBR Green Mix (ThermoScientific, Epsom, UK) and the Mx3000P real time detection system (Stratagene, La Jolla, CA) using the following primers: actb (NM_131031, bases 10-100), forward (5′-GATCTTCACTCCCCTTGTTCA-3′) and reverse (5′-ATACCGGAGCCGTTGTCA-3′); pif1 (NM_ 198807, bases 1697-1774), forward (5′-GCAGCTGCCACTCAAACTG-3′) and reverse (5′-GAGATCTCCACACAATCCAGAGT-3′); aspm (ENSDART00000105631, bases 1697-1774), forward (5′-GCCCTTAAATCAGCCAAGAA-3′) and reverse (5′-TTCTCTGCAGTTTTGCCCTAA-3′); top2a (NM_001003834, bases 2961-3034), forward (5′-CACCACCATCGAGATCACAG-3′) and reverse (5′-CCAACACATTCTCCTTATAGGTCA-3′); cdc20 (NM_213080, bases 1317-1389), forward (5′-AATGCTTCCAGTGGCTCTTG-3′) and reverse (5′-TGGGTGCAAAAACAAGAGAAG-3′); oip5 (XM_001339446, bases 260-335), forward (5′-GACTCTCTCGGCGTCTGC-3′) and reverse (5′-CCATCACATCCTCAGTAACTTTCA-3′); bax (NM_131562, bases 312-418), forward (5′-GCCCGTGAGATCTTCTCTGA-3′) and reverse (5′-TCAGGAACCCTGGTTGAAAT-3′); tnfb (NM_001024447, bases 238-312), forward (5′-GGTCAGAAACCCAACAGAGAA-3′) and reverse (5′-CACTTTTCCGTGGTCTGAGG-3′). Triplicate mean values were calculated according to the ct quantification method using the actb transcript level as reference for normalization (19).
Whole Mount in Situ Hybridization—pCRII-lin9 vectors (see “RNA Isolation, Reverse Transcription (RT), PCR, and Cloning”) were linearized with XhoI. pif1 (NM_198807, bases 168-810), aspm (ENSDART00000105631, bases 621-1370), top2a (NM_001003834, bases 3785-4401), and oip5 (XM_001339446, bases 40-646) templates were amplified from cDNA with reverse primers providing the SP6 promoter sequence. In vitro transcription was performed using SP6 polymerase and the DIG RNA labeling kit (Roche Applied Science), according to the manufacturer's instructions. Whole mount in situ hybridization was carried out as previously described (17). Nitro blue tetrazolium/bromo-4-chloro-3-indolyl phosphate (Roche Applied Science) served as a substrate for color development.
Flow Cytometry—Upon removal of the chorion, 10 embryos were washed in PBS and transferred to a collection tube. Embryos were homogenized with a micropestle in Dulbecco's modified Eagle's medium + 10% fetal calf serum at 4 °C, passed through a 30-μm filter (Beckman Coulter), collected in a 15-ml tube, and centrifuged at 1200 rpm at 4 °C. Cells were washed once in PBS and stained in DNA buffer (100 mm Tris, pH 7.5, 154 mm NaCl, 1 mm CaCl, 0.5 mm MgCl, 0.2% bovine serum albumin, 0.1% Nonidet P-40, 250 μg/ml RNase, 30 μg/ml propidium iodide) for at least 30 min at 4 °C in the dark. DNA content was analyzed with a Cytomics FC 500 (Beckman Coulter) flow cytometer.
Apoptosis Detection—72-h zebrafish embryos were incubated for 30 min in 5 μg/ml acridine orange in PBS and subsequently washed twice for 20 min in PBS at room temperature. For microscopic examination embryos were transferred into ice-cold PBS, 0.01% 3-aminobenzoic acid ethyl ester methane sulfonate. Terminal transferase-mediated dUTP nick end-labeling (TUNEL) assays were performed as described elsewhere (20).
Confocal Microscopy—Embryos were fixed and prepared as described previously (21). For DNA staining, embryos were incubated in 10 μg/ml Hoechst (PBS) for 30 min. For imaging, Leica (Wetzlar, Germany) SP2 and SP5 inverted confocal systems were used. The resulting multidimensional stacks were analyzed using ImageJ version 1.41 (National Institutes of Health) and Volocity 4/5 (Improvision, Coventry, UK) software.
Gene Expression Analysis—20 embryos/condition (MO-E1; MO-E1mis) were pooled for RNA purification 24 h postfertilization. Using the two-color Quick-Amp Labeling Kit (catalog number 5190-0444; Agilent), 100 ng of total RNA were used for cDNA synthesis, mRNA amplification, and labeling according to the manufacturer's instructions. Transcriptional profiling was done on a zebrafish oligonucleotide array (catalog number G2519F AMADID 019161; Agilent) in a 4 × 44,000 slide format and analyzed as described before (22). Expression data and gene annotations were stored in Array Express (available on the World Wide Web) (accession number A-MEXP-1510), which complies with MIAME (minimal information about a microarray experiment) guidelines. For experimental comparisons, genes showing at least a 1.6-fold change were chosen.
RESULTS
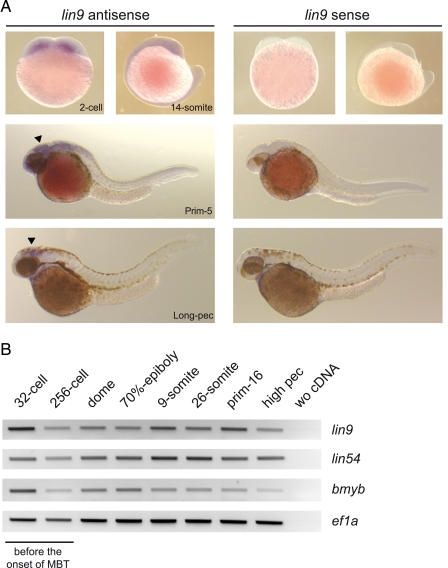
lin9 Is Expressed throughout Zebrafish Embryonic Development—To analyze lin9 expression in zebrafish embryogenesis, we performed whole mount in situ hybridization on paraformaldehyde-fixed embryos at 0.45, 16, 32, and 48 h postfertilization (2-cell, 14-somite, Prim-16, and Long-pec stage, respectively). The probe was designed targeting bases 502-1043 of lin9 mRNA (NM_001044946). Blast analysis, even under lowest stringency conditions, did not reveal any target other than lin9. Transcripts of lin9 were detected throughout embryogenesis. Expression was ubiquitous at the first embryonic day and became restricted to the head region, most notably to the optic tectum of the mesencephalon at later stages of development (Fig. 1A). Because the lin9 message is already present at the two-cell stage and because zebrafish zygotic transcription arises at the midblastula transition (1000-cell stage), these data indicate that lin9 is a maternally derived transcript. We independently confirmed these results by RT-PCR analysis (Fig. 1B). Other members of the LINC complex, namely lin54 and bmyb, are also expressed during early zebrafish embryogenesis (Fig. 1B).
FIGURE 1.
lin9 is expressed throughout zebrafish development. A, whole mount in situ hybridization was carried out at the indicated hpf with an antisense and sense probe for lin9. Arrowheads mark the optic tectum. B, semiquantitative RT-PCR at the indicated stages reveals that lin9, lin54, and bmyb transcripts are present during embryogenesis before and after the midblastula transition (MBT).
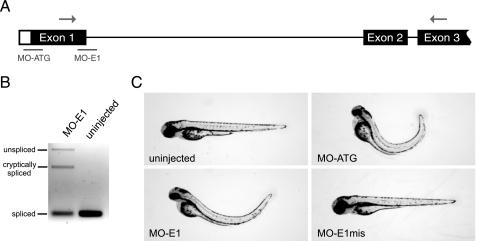
lin9 Is Essential for Early Zebrafish Development—To analyze the role of lin9 in early zebrafish development, we designed an antisense MO that targets the splice donor site of exon 1 of the lin9 transcript (MO-E1; Fig. 2A). To confirm that MO-E1 indeed inhibits the correct splicing of the lin9 message, we microinjected 7 ng of MO-E1 into the yolk of one- or two-cell stage embryos and analyzed the lin9 message by semiquantitative RT-PCR 3 days later. As shown in Fig. 2B, the band corresponding to the spliced lin9 message is strongly reduced upon injection of MO-E1. In addition, a shorter message that arises from the use of a cryptic splice site can be detected in MO-E1-injected zebrafish embryos. We further confirmed both PCR products by sequencing. A schematic representation of the cryptic variant is depicted in supplemental Fig. 1.
FIGURE 2.
lin9 is essential for zebrafish development. A, schematic representation of the unspliced lin9 transcript. Morpholino targeting sites (lines) and binding sites for PCR primer (arrows) are indicated. B, injection of MO-E1 (7 ng) prevents splicing of intron 1 or results in a cryptic splice variant. Semiquantitative RT-PCR was conducted 72 hpf. C, lin9 morphants display small head and eyes, cardiac edema, and trunk curvature. A 5-base mismatch morpholino (MO-E1mis) did not evoke developmental defects. Images were taken 72 hpf.
Next, we microinjected embryos with MO-E1 and followed their development. In order to exclude off-target or secondary effects, we included a control morpholino (MO-E1mis) in our experiments. MO-E1mis differs from the E1 morpholino in 5 bases (see “Experimental Procedures”). MO-E1mis-injected embryos developed virtually identically compared with uninjected wild type embryos. In stark contrast, at day 2 of development, MO-E1-injected zebrafish embryos (morphants) had slightly smaller heads than uninjected or control-injected embryos. At day 3, in almost all lin9 morphants, a stronger phenotype was evident. Specifically, ME-E1-injected embryos had a small head, small eyes, pericardial edema, and a strong trunk curvature (Fig. 2C). When we tested various amounts of MO-E1, we found that 3.4 ng was sufficient to induce the morphant phenotype in 73.1% of all embryos (Table 1). Higher doses of the morpholino increased the fraction of zebrafish with the morphant phenotype but did not alter the phenotype. Importantly, however, when embryos were coinjected with 3.4 ng of MO-E1 and 0.2 ng of in vitro transcribed lin9 mRNA, only 46% of the embryos showed the morphant phenotype, strongly suggesting that the phenotype arises due to the inhibition of lin9 expression. Injection of lin9 mRNA alone did not result in phenotypical alterations (data not shown). Furthermore, a second lin9-specific morpholino (MO-ATG) that is predicted to interfere with the translation of the lin9 message showed the same phenotype as MO-E1 (Fig. 2C). Since two morpholinos targeting lin9 induced the same phenotype and since this phenotype was partially rescued by the lin9 mRNA, we conclude that the morphant phenotype is due to the loss of Lin9.
TABLE 1.
Summary of mopholino and mRNA injections
| Morpholino | Amount | mRNA | n | s.h.a(+curvature) | WTb | Percentage of WT |
|---|---|---|---|---|---|---|
| ng | % | |||||
| ATG | 15 | 120 | 116 | 4 | 3.3 | |
| ATG | 7 | 87 | 43 | 44 | 50.6 | |
| E1 | 15 | 99 | 97 | 2 | 2.0 | |
| E1 | 7 | 78 | 69 | 9 | 11.5 | |
| E1 | 3.4 | 104 | 73 | 28 | 26.9 | |
| E1 | 3.4 | LIN9 (0.2 ng) | 50 | 23 | 27 | 54 |
| E1mis | 15 | 100 | 1 (+3) | 96 | 96 | |
| E1mis | 7 | 68 | 0 (+1) | 67 | 98.5 |
Small head.
WT, wild type.
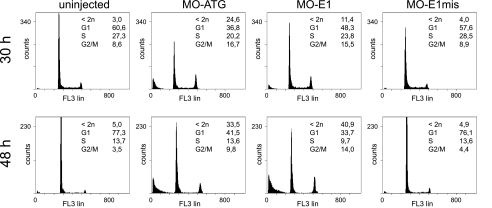
Lin9 Regulates the Embryonic Cell Cycle—Next, we analyzed the embryonic cell cycles of lin9 morphant embryos by flow cytometry 30 and 48 h after fertilization. Injection of both lin9-specific morpholinos, but not MO-E1mis, resulted in a decrease of cells in G1 and an increase of cells with a G2/M DNA content (Fig. 3A). In addition, a large number of cells with a sub-G1 DNA content were detected in lin9 morphants, suggesting that cells undergo apoptosis or necrosis upon loss of Lin9. Taken together, these results demonstrate that loss of Lin9 leads to an accumulation of cells in G2/M and an increase of cell death during zebrafish embryogenesis.
FIGURE 3.
Cell death and G2/M delay in lin9 morphants. Embryos were injected with 7 ng of indicated morpholinos. At 30 and 48 hpf, clutches of 10 embryos were homogenized. For DNA content analysis, cells were stained with propidium iodide and analyzed by flow cytometry. MO-ATG and MO-E1 evoke an increase of cell number in G2/M 30 hpf compared with uninjected or control (MO-E1mis)-injected embryos. The amount of dead cells (<2n) increases from 30 to 48 hpf in the morphants.
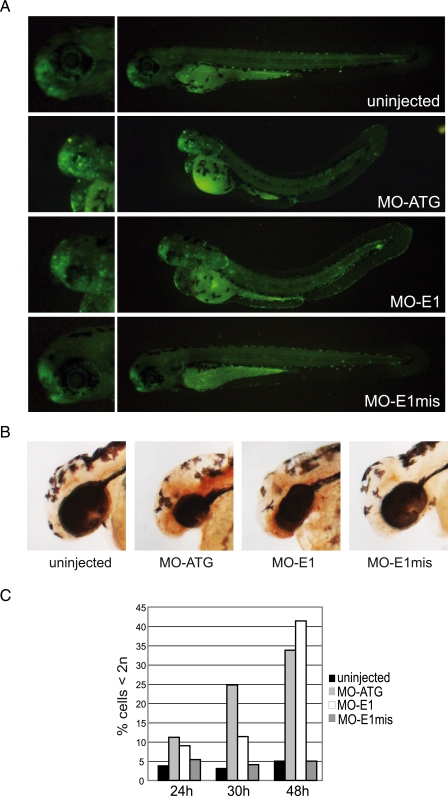
Apoptosis and Accumulation of Mitotic Cells in lin9 Morphant Brains—The number of cells with a sub-G1 DNA content strongly increased in lin9 morphants between 24 and 48 h after fertilization (Fig. 4C). To further analyze cell death in lin9 morphants, we used acridine orange to visualize apoptotic areas under the fluorescence microscope in 72-h-old zebrafish embryos. As shown in Fig. 4A, the olfactory regions of uninjected and control injected (E1mis) embryos were stained by acridine orange, indicating physiologically occurring apoptosis (23). Strikingly, in lin9 morphant brains, fluorescence-positive areas were much more widely distributed compared with control embryos, suggesting massive apoptosis in the developing brain upon loss of Lin9. To independently confirm apoptosis in the morphants, we made use of the TUNEL assay (Fig. 4B). These experiments confirmed enhanced apoptosis in the heads of 48 h morphants, most strikingly in the central nervous system and olfactory region.
FIGURE 4.
Enhanced apoptosis in lin9 morphant brains. A, 72 hpf uninjected and morpholino (7 ng)-injected embryos were incubated with the vital dye acridine orange. Fluorescent areas are spread throughout the morphant brains, indicating abnormal apoptosis. Left, magnified views of the heads are given. B, 48 hpf uninjected and morpholino-injected embryos were paraformaldehyde-fixed, and TUNEL assays where performed. Brown 3,3′-diaminobenzidine staining indicates enhanced apoptosis in the brain and olfactory regions of lin9 morphant embryos. C, representative distribution of apoptotic cells in uninjected and morpholino-injected embryos at the indicated hpf. Cells were identified as subdiploid (<2n) by flow cytometry.
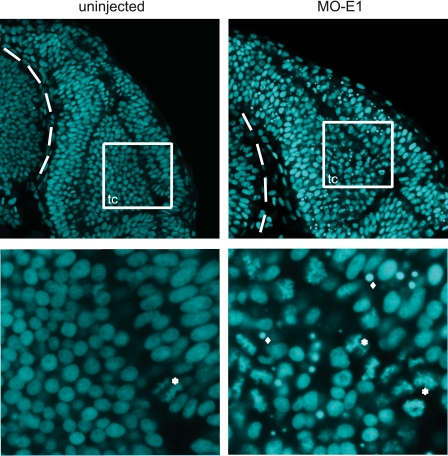
To further substantiate this observation, we took confocal images of Hoechst-stained embryonic nuclei 30 h after fertilization. We noticed a plethora of apoptotic bodies in brains of lin9 morphant embryos but not in control embryos. Overall, about 20% of all nuclei showed an abnormal morphology, including nuclear shrinkage and fragmentation, which are known features of programmed cell death (Fig. 5, bottom). Second, quantification revealed a more than 3-fold higher number of mitotic cells in the developing brain of morphant embryos compared with uninjected embryos. This suggests that the increase in the fraction of cells in G2/M observed by fluorescence-activated cell sorting analysis is, at least in part, due to accumulation of cells in mitosis. Importantly, the increase in apoptotic and mitotic cells was also observed in the developing brains of zebrafish embryos injected with MO-ATG (supplemental Fig. 2). Taken together, these findings indicate that developing cells in the zebrafish brain undergo apoptosis upon loss of Lin9, possibly preceded by mitotic defects.
FIGURE 5.
Increase of apoptotic and mitotic cell numbers in the central nervous system of morphant embryos. Embryos were fixed and Hoechst-stained 30 hpf. Confocal images were taken of the brain (dorsal view). Dashed lines encircle the eye. Below, magnified views of wild type and E1 morphant optic tectum (tc). Examples of mitotic cells (*) and apoptotic bodies (♦) are indicated.
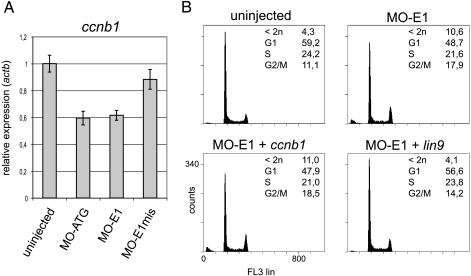
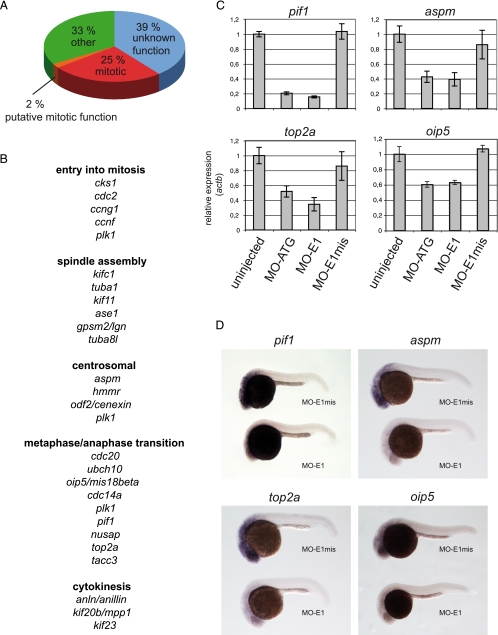
Lin9 Regulates a Cohort of Genes Required for Mitosis—Because in human cells, LIN9 regulates the expression of genes that are required for entry into mitosis, including cyclin B1 (3, 6), we next asked whether inhibition of cyclin B1 is responsible for the observed phenotype. To address this possibility, we first analyzed the expression of cyclin B1 in lin9 morphants by RT-qPCR. Cyclin B1 was indeed slightly down-regulated in MO-ATG as well as in MO-E1 morphant embryos (Fig. 6A). Next, we asked whether cyclin B1 expression can restore a normal cell cycle profile in lin9 morphants. To address this question, we coinjected MO-E1 with in vitro transcribed cyclin B1 mRNA. As a positive control, we coinjected MO-E1 with lin9 mRNA. As expected, lin9 mRNA greatly reduced both cell death and G2/M accumulation when coinjected with MO E1 (Fig. 6B). However, cyclin B1 mRNA neither rescued the accumulation of cells in G2/M nor prevented the apoptosis upon injection of MO-E1. These observations indicate that inhibition of cyclin B1 is not sufficient to explain the lin9 morphant phenotype. Therefore, we performed genome-wide gene expression analysis using a zebrafish oligonucleotide microarray to identify genes regulated by Lin9 during zebrafish development. We compared gene expression profiles of morphant (E1) and control-injected (E1mis) embryos 24 h after fertilization, a time when cell cycle defects first become detectable by flow cytometry (data not shown). The microarray analysis identified 109 genes that were down-regulated and 49 genes that were up-regulated more than 1.6-fold in the lin9 morphants (Fig. 7 and supplemental Fig. 3). Interestingly, although genes required for the G1/S transition were not affected by the inhibition of Lin9, at least 25% of the down-regulated genes function in mitosis (Fig. 7A and supplemental Fig. 3). These genes encode for proteins required for entry into mitosis, spindle assembly, centrosome formation, metaphase/anaphase transition, and cytokinesis (Fig. 7B).
FIGURE 6.
Coinjection of cyclin B (ccnb1) mRNA does not rescue cell cycle defects evoked by MO-E1. A, ccnb1 is down-regulated in lin9 morphants. Embryos were injected with 7 ng of morpholinos as indicated. 30 hpf ccnb1 expression was measured by RT-qPCR. B, embryos were injected with MO-E1 (7 ng) alone, MO-E1 with ccnb1 mRNA (0.2 ng), or MO-E1 with LIN9 mRNA (0.2 ng). DNA content was measured by flow cytometry 30 hpf.
FIGURE 7.
Microarray analysis reveals that mitotic genes are down-regulated in lin9 morphants. A, functional clustering of genes that are down-regulated ≥1.6-fold in E1 relative to E1mis morphants 24 hpf. B, subclassification of LIN9 targets according to their mitotic function. C, validation of newly identified LIN9 targets by RT-qPCR. As controls, RNA from uninjected and ATG morphants were included. D, whole mount in situ hybridization (24 hpf) for pif1, aspm, top2a, and oip5 on MO-E1- and MO-E1mis-injected embryos.
We next used RT-qPCR to validate regulation of selected genes identified in the microarray experiment (Fig. 7C). As a control, we also included cDNA from uninjected and MO-ATG-injected embryos. The expression levels of all genes tested, including pif1, aspm, top2a, and oip5, were down-regulated in both MO-E1 and MO-ATG morphant zebrafish compared with control injected (E1mis) and uninjected embryos. To independently confirm these results, we performed whole mount in situ hybridization on 24 h MO-E1- and MO-E1mis-injected embryos with probes directed at pif1, aspm, top2a, and oip5 (Fig. 7D). As expected, MO-E1-injected embryos displayed a weaker signal for all probes compared with MO-E1mis embryos. These results together with the findings presented above support a role for Lin9 in the regulation of mitotic progression during zebrafish development.
Although we detected enhanced apoptosis in Lin9-deficient embryos (Figs. 4 and 5), we did not detect a significant enrichment of apoptosis-related genes in the microarray experiment. However, one apoptosis-related gene up-regulated in lin9 morphants is tnfb (supplemental Fig. 3). Tnfb is a member of the tumor necrosis factor superfamily and shows 51% similarity with human LTA/TNFB. RT-qPCR showed that tnfb is up-regulated at least 1.7-fold in both MO-E1- and MO-ATG-injected embryos. We also analyzed the expression of bax, a proapoptotic and bona fide p53 target gene (supplemental Fig. 4). In contrast to tnfb, bax expression was unaltered in lin9 morphants.
DISCUSSION
Here, we made use of the zebrafish as a vertebrate model, whose rapid embryogenesis ex utero allowed us to study the in vivo function of lin9 by morpholino injection. Loss of Lin9 causes an increase of cell number in mitosis, which is most likely ascribed to the down-regulation of a cohort of mitotic genes we identified by gene expression analysis. LIN9-dependent genes regulate different mitotic processes. For instance, KIFC1 and KIF11 are kinesins required for proper spindle formation (24, 25), whereas KIF20B/MPP1 and KIF23 exert their function in cytokinesis (26-28). CDC20 and UBCH10 are known regulators of the anaphase-promoting complex (29, 30). CDC14 dephosphorylates securin, which in turn allows the ubiquitination of securin by the anaphase-promoting complex (31). Thus, CDC14 promotes securin destruction and consequently activation of separase, ultimately leading to sister chromatid separation. NUSAP (nucleolar and spindle-associated protein) is ubiquitinated by the anaphase-promoting complex, and its depletion results in aberrant mitotic spindles, defective chromosome segregation, and cytokinesis (32, 33). Recently, Sunkel and co-workers (34) reported that TOP2A positively regulates Aurora B kinase activity, thereby ensuring proper sister chromatid separation. Furthermore, RNA interference-mediated knockdown of TACC3 in HeLa cells results in a reduction of Aurora B kinase and BUBR1 levels at the kinetochores (35). Taken together, the majority of newly identified targets of LIN9 are involved in various mitotic processes, including a preference for the metaphase/anaphase switch.
LIN9 has been reported as a repressor of genes required for G1/S transition in human cells (5). The fact that lin9 morphants show a reduced amount of cells in G1 might point to this repressive function (Fig. 3). However, one would expect an increase in the amount of S phase cells if Lin9 depletion shortens the G1 phase. Since this is not the case and since we found that lin9 morphant cells accumulate in mitosis, we assume that the decrease of cell number in G1 is explained by the increase in G2/M. Thus, Lin9 is mainly required for mitosis and not the G1/S phase of the cell cycle. This conclusion is further supported by the fact that we did not identify G1/S-regulatory genes in our microarray approach (supplemental Fig. 3).
The cooperation of LIN9 and B-MYB as members of the LINC/DREAM complex in S phase has been reported for human cells and invertebrate models as well (3, 11). Hence, we expected that both proteins also conjointly regulate cell cycle genes during zebrafish development. Indeed, we find a clear overlap of the lin9 morphant phenotype with the bmyb loss-of-function mutant crb. Aspm, cdc2, cdc20, tacc3, kif23, kif11, anln, and oip5 are down-regulated in both bmyb- and lin9-deficient embryos (15). Furthermore, crb embryos display an accumulation of cells in G2/M, increased apoptosis, and small heads. However, cyclin B mRNA injection partially rescued the crb but not the lin9 morphant phenotype (15). It is thinkable that B-Myb only partially relies on Lin9 in gene activation, and in turn, Lin9 might regulate some G2/M genes independently of B-Myb. A complete loss-of-function mutation of lin9 might finally unravel the degree of Lin9 and B-Myb cooperation in zebrafish development.
We found the most striking phenotypic outcome of lin9 morphants in the central nervous system (i.e. an unusually high number of mitotic cells and apoptotic bodies) (Fig. 5 and supplemental Fig. 2). This phenotype is consistent with the expression of lin9 in zebrafish development. During the pharyngula period (24-48 hpf), the highest lin9 transcript levels were detected in the optic tectum. Given that the optic tectum represents a highly proliferative area during early stages of zebrafish embryogenesis, we speculate that expression of lin9 is functionally connected with its requirement in embryonic cell cycle regulation (36, 37).
Cell cycle abnormalities are first detectable at the end of the segmentation period (22-24 h after fertilization) in lin9 morphants. These effects seem to be relatively late compared with other vertebrates but are not surprising given that the embryo derives an abundant level of maternal factors that ensure development even after the initiation of embryonic gene expression (38). Interestingly, loss-of-function mutations in the majority of essential genes in zebrafish result in cell death of the developing central nervous system, including the Lin9 target genes kif23, kif11, cdc2, plk1, and top2a (39). Therefore, lin9 is essential for embryogenesis, because it activates factors that themselves regulate essential cellular processes.
We do not know when lin9 morphant cells exit the cell cycle to undergo apoptosis and whether this depends on failures in mitotic progression. However, our flow cytometry data show that the mitotic delay is first detectable shortly before apoptosis arises (data not shown). We therefore speculate that the delay in mitotic progression precedes apoptosis. Clearly, further experiments are necessary to define the pathways that lead to apoptosis upon inhibition of lin9.
Supplementary Material
Acknowledgments
We appreciate the advice of the Schartl group regarding zebrafish care and breeding. We thank Michael Krause and the Genomics Unit of the Institute of Molecular Biology and Tumor Research, Marburg, for gene expression profiling.
This work was supported by Deutsche Forschungsgemeinschaft Grant TR 17 (to S. G. and D. L.) and a European Union grant (Plurigenes FP6 project 018673) (to T. W.).
The on-line version of this article (available at http://www.jbc.org) contains supplemental Figs. 1-4.
Footnotes
The abbreviations used are: hpf, hours postfertilization; MO, morpholino; RT, reverse transcription; PBS, phosphate-buffered saline; TUNEL, terminal transferase-mediated dUTP nick end-labeling; qPCR, quantitative PCR.
References
- 1.Dimova, D. K., and Dyson, N. J. (2005) Oncogene 24 2810-2826 [DOI] [PubMed] [Google Scholar]
- 2.Zhu, W., Giangrande, P. H., and Nevins, J. R. (2004) EMBO J. 23 4615-4626 [DOI] [PMC free article] [PubMed] [Google Scholar]
- 3.Osterloh, L., von Eyss, B., Schmit, F., Rein, L., Hubner, D., Samans, B., Hauser, S., and Gaubatz, S. (2007) EMBO J. 26 144-157 [DOI] [PMC free article] [PubMed] [Google Scholar]
- 4.Laoukili, J., Kooistra, M. R., Bras, A., Kauw, J., Kerkhoven, R. M., Morrison, A., Clevers, H., and Medema, R. H. (2005) Nat. Cell Biol. 7 126-136 [DOI] [PubMed] [Google Scholar]
- 5.Litovchick, L., Sadasivam, S., Florens, L., Zhu, X., Swanson, S. K., Velmurugan, S., Chen, R., Washburn, M. P., Liu, X. S., and DeCaprio, J. A. (2007) Mol. Cell 26 539-551 [DOI] [PubMed] [Google Scholar]
- 6.Pilkinton, M., Sandoval, R., Song, J., Ness, S. A., and Colamonici, O. R. (2007) J. Biol. Chem. 282 168-175 [DOI] [PubMed] [Google Scholar]
- 7.Schmit, F., Korenjak, M., Mannefeld, M., Schmitt, K., Franke, C., von Eyss, B., Gagrica, S., Hanel, F., Brehm, A., and Gaubatz, S. (2007) Cell Cycle 6 1903-1913 [DOI] [PubMed] [Google Scholar]
- 8.Pilkinton, M., Sandoval, R., and Colamonici, O. R. (2007) Oncogene 26 7535-7543 [DOI] [PubMed] [Google Scholar]
- 9.Lewis, P. W., Beall, E. L., Fleischer, T. C., Georlette, D., Link, A. J., and Botchan, M. R. (2004) Genes Dev. 18 2929-2940 [DOI] [PMC free article] [PubMed] [Google Scholar]
- 10.Korenjak, M., Taylor-Harding, B., Binne, U. K., Satterlee, J. S., Stevaux, O., Aasland, R., White-Cooper, H., Dyson, N., and Brehm, A. (2004) Cell 119 181-193 [DOI] [PubMed] [Google Scholar]
- 11.Georlette, D., Ahn, S., MacAlpine, D. M., Cheung, E., Lewis, P. W., Beall, E. L., Bell, S. P., Speed, T., Manak, J. R., and Botchan, M. R. (2007) Genes Dev. 21 2880-2896 [DOI] [PMC free article] [PubMed] [Google Scholar]
- 12.Harrison, M. M., Ceol, C. J., Lu, X., and Horvitz, H. R. (2006) Proc. Natl. Acad. Sci. U. S. A. 103 16782-16787 [DOI] [PMC free article] [PubMed] [Google Scholar]
- 13.Tanaka, Y., Patestos, N. P., Maekawa, T., and Ishii, S. (1999) J. Biol. Chem. 274 28067-28070 [DOI] [PubMed] [Google Scholar]
- 14.Tarasov, K. V., Tarasova, Y. S., Tam, W. L., Riordon, D. R., Elliott, S. T., Kania, G., Li, J., Yamanaka, S., Crider, D. G., Testa, G., Li, R. A., Lim, B., Stewart, C. L., Liu, Y., Van Eyk, J. E., Wersto, R. P., Wobus, A. M., and Boheler, K. R. (2008) PLoS ONE 3 e2478. [DOI] [PMC free article] [PubMed] [Google Scholar]
- 15.Shepard, J. L., Amatruda, J. F., Stern, H. M., Subramanian, A., Finkelstein, D., Ziai, J., Finley, K. R., Pfaff, K. L., Hersey, C., Zhou, Y., Barut, B., Freedman, M., Lee, C., Spitsbergen, J., Neuberg, D., Weber, G., Golub, T. R., Glickman, J. N., Kutok, J. L., Aster, J. C., and Zon, L. I. (2005) Proc. Natl. Acad. Sci. U. S. A. 102 13194-13199 [DOI] [PMC free article] [PubMed] [Google Scholar]
- 16.Sandoval, R., Xue, J., Tian, X., Barrett, K., Pilkinton, M., Ucker, D. S., Raychaudhuri, P., Kineman, R. D., Luque, R. M., Baida, G., Zou, X., Valli, V. E., Cook, J. L., Kiyokawa, H., and Colamonici, O. R. (2006) Exp. Cell Res. 312 2465-2475 [DOI] [PubMed] [Google Scholar]
- 17.Westerfield, M. (1993) The Zebrafish Book: A Guide for the Laboratory Use of Zebrafish (Brachydanio rerio), University of Oregon Press, Eugene, OR
- 18.Kimmel, C. B., Ballard, W. W., Kimmel, S. R., Ullmann, B., and Schilling, T. F. (1995) Dev. Dyn 203 253-310 [DOI] [PubMed] [Google Scholar]
- 19.Pfaffl, M. W. (2001) Nucleic Acids Res. 29 e45. [DOI] [PMC free article] [PubMed] [Google Scholar]
- 20.Herpin, A., Schindler, D., Kraiss, A., Hornung, U., Winkler, C., and Schartl, M. (2007) BMC Dev. Biol. 7 99. [DOI] [PMC free article] [PubMed] [Google Scholar]
- 21.Wagner, T. U., Kraeussling, M., Fedorov, L. M., Reiss, C., Kneitz, B., and Schartl, M. (2009) Stem Cells Dev. 18 151-160 [DOI] [PubMed] [Google Scholar]
- 22.Kleinschmidt, M. A., Streubel, G., Samans, B., Krause, M., and Bauer, U. M. (2008) Nucleic Acids Res. 36 3202-3213 [DOI] [PMC free article] [PubMed] [Google Scholar]
- 23.Cole, L. K., and Ross, L. S. (2001) Dev. Biol. 240 123-142 [DOI] [PubMed] [Google Scholar]
- 24.Zhu, C., Zhao, J., Bibikova, M., Leverson, J. D., Bossy-Wetzel, E., Fan, J. B., Abraham, R. T., and Jiang, W. (2005) Mol. Biol. Cell 16 3187-3199 [DOI] [PMC free article] [PubMed] [Google Scholar]
- 25.Whitehead, C. M., and Rattner, J. B. (1998) J. Cell Sci. 111 2551-2561 [DOI] [PubMed] [Google Scholar]
- 26.Abaza, A., Soleilhac, J. M., Westendorf, J., Piel, M., Crevel, I., Roux, A., and Pirollet, F. (2003) J. Biol. Chem. 278 27844-27852 [DOI] [PMC free article] [PubMed] [Google Scholar]
- 27.Liu, X., Zhou, T., Kuriyama, R., and Erikson, R. L. (2004) J. Cell Sci. 117 3233-3246 [DOI] [PubMed] [Google Scholar]
- 28.Zhu, C., Bossy-Wetzel, E., and Jiang, W. (2005) Biochem. J. 389 373-381 [DOI] [PMC free article] [PubMed] [Google Scholar]
- 29.Hwang, L. H., Lau, L. F., Smith, D. L., Mistrot, C. A., Hardwick, K. G., Hwang, E. S., Amon, A., and Murray, A. W. (1998) Science 279 1041-1044 [DOI] [PubMed] [Google Scholar]
- 30.Summers, M. K., Pan, B., Mukhyala, K., and Jackson, P. K. (2008) Mol. Cell 31 544-556 [DOI] [PMC free article] [PubMed] [Google Scholar]
- 31.Holt, L. J., Krutchinsky, A. N., and Morgan, D. O. (2008) Nature 454 353-357 [DOI] [PMC free article] [PubMed] [Google Scholar]
- 32.Raemaekers, T., Ribbeck, K., Beaudouin, J., Annaert, W., Van Camp, M., Stockmans, I., Smets, N., Bouillon, R., Ellenberg, J., and Carmeliet, G. (2003) J. Cell Biol. 162 1017-1029 [DOI] [PMC free article] [PubMed] [Google Scholar]
- 33.Li, L., Zhou, Y., Sun, L., Xing, G., Tian, C., Sun, J., Zhang, L., and He, F. (2007) Cell. Signal. 19 2046-2055 [DOI] [PubMed] [Google Scholar]
- 34.Coelho, P. A., Queiroz-Machado, J., Carmo, A. M., Moutinho-Pereira, S., Maiato, H., and Sunkel, C. E. (2008) PLoS Biol. 6 e207. [DOI] [PMC free article] [PubMed] [Google Scholar]
- 35.Schneider, L., Essmann, F., Kletke, A., Rio, P., Hanenberg, H., Wetzel, W., Schulze-Osthoff, K., Nurnberg, B., and Piekorz, R. P. (2007) J. Biol. Chem. 282 29273-29283 [DOI] [PubMed] [Google Scholar]
- 36.Wullimann, M. F., and Knipp, S. (2000) Anat. Embryol. (Berl.) 202 385-400 [DOI] [PubMed] [Google Scholar]
- 37.Mueller, T., and Wullimann, M. F. (2003) Brain Res. Dev. Brain Res. 140 137-155 [DOI] [PubMed] [Google Scholar]
- 38.Pelegri, F. (2003) Dev. Dyn. 228 535-554 [DOI] [PubMed] [Google Scholar]
- 39.Amsterdam, A., Nissen, R. M., Sun, Z., Swindell, E. C., Farrington, S., and Hopkins, N. (2004) Proc. Natl. Acad. Sci. U. S. A. 101 12792-12797 [DOI] [PMC free article] [PubMed] [Google Scholar]
Associated Data
This section collects any data citations, data availability statements, or supplementary materials included in this article.


