

Abstract
Urban and rural areas may have different levels of environmental contamination and different potential sources of exposure. Many metals, i.e., arsenic (As), lead (Pb), and mercury (Hg), have well-documented negative neurological effects, and the developing fetus and young children are particularly at risk. Using a database of mother and child pairs, three areas were identified: a rural area with no increased prevalence of mental retardation and developmental delay (MR/DD) (Area A), and a rural area (Area B) and an urban area (Area C) with significantly higher prevalence of MR/DD in children as compared to the state-wide average. Areas were mapped and surface soil samples were collected from nodes of the uniform grid. Samples were analyzed for As, barium (Ba), beryllium (Be), chromium (Cr), copper (Cu), Pb, manganese (Mn), nickel (Ni), and Hg concentrations, and for soil toxicity and correlated to identify potential common sources. ArcGIS® was used to determine distances between sample locations and industrial facilities, which were correlated with both metal concentrations and soil toxicity. Results indicated that all metal concentrations (except Be and Hg) in Area C were significantly greater than those in Areas A and B (p ≤ 0.0001) and that Area C had fewer correlations between metals suggesting more varied sources of metals than in rural areas. Area C also had a large number of facilities whose distances were significantly correlated with metals, particularly Cr (maximum r = 0.33; p = 0.0002), and with soil toxicity (maximum r = 0.25; p = 0.007) over a large spatial scale. Arsenic was not associated with distance to any facility and may have different anthropogenic, or a natural source. In contrast to Area C, both rural areas had lower concentrations of metals, lower soil toxicity, and a small number of facilities with significant associations between distance and soil metals.
Keywords: Arsenic, chromium, mental retardation and developmental delay, rural surface soils, urban surface soils, soil contamination, TRI
Introduction
In urban areas, industrial sources with specific releases of metals often impact surrounding soils (Douay et al., 2007) and these soils may pose a health risk. Pilgrim and Schroeder (1997) measured elevated concentrations of Cd, Cu, Pb, and Zn in urban areas, and Chen et al. (1997) found urban soils to have significantly higher mean As, Cd, Cu, Pb, and Zn concentrations than forest and rural soils, although some forest soils also contained elevated concentrations of As, Cu, and Pb. Most metals found in urban and rural soils have both natural and anthropogenic sources, and thus are site-specific; source identification is needed to effectively mitigate and reduce potential human exposure.
In many cases, children and pregnant women are most susceptible to negative health effects from metals in soils (Calderón et al., 2003). The neurological effects of Pb, As, and mercury (Hg) have been well documented (Abernathy et al., 1999; Factor-Litvak et al., 1999; Wasserman et al., 2004; Rothenberg and Rothenberg, 2005; Trasande et al., 2005), but other metals, such as Cr, Cu, and Ni, also may have potential negative neurological impacts (Rowbotham et al., 2000; ATSDR, 2008). Caussy et al. (2003) reported that for As, soil and dust were relevant media and water was a highly relevant medium for exposure. Soils and dust also were relevant media for exposure to Cr, Pb and Hg compared to air, water, and food, particularly for Pb due to soil ingestion by toddlers. Soil metals in urban areas may be bioavailable, as elevated blood concentrations of Pb in children (Thornton et al., 1990; Mielke et al., 2007) and Cd in adults (Hogervorst et al., 2007) have been associated with soil metal concentrations. The associated increased risk to human health and potential negative health effects due to toxic metals in soils is of concern for exposed, and in particular susceptible, populations.
This study is part of a broader study which is investigating concentrations of metals in soils over large spatial scales as a general indicator of environmental insult, and associations of metal concentrations and toxicity with incidences of mental retardation and developmental delay (MR/DD) in children. The prevalence of MR in the US during late childhood has been reported to be 1–2 % of the population during the past decade, but there is substantial variation in the literature (McDermott et al., 2007). Sturm et al. (2003) found geographical variations in mental health needs for children, with need varying from ~5 % in New Jersey to as high as 9.5 % for Mississippi (national average of 7.1 %). When the broader category of developmental delay (DD) is included, depending on the population surveyed and the methods used, the estimate of MR/DD prevalence ranges from 10–15 % of school age children (McLaren and Bryson, 1987; Drillen et al, 1988; Simeonsson and Sharp, 1992; Massey and McDermott, 1996; Stevenson, 1996).
In the current study, we compared concentrations of metals and soil toxicity in urban and rural areas (both with MR/DD risk significantly greater than background risk), and in a reference rural area (with MR/DD risk similar to that of the state average) to determine whether the urban area had greater soil toxicity and concentrations of metals than the rural areas, and whether greater concentrations of metals were associated with the MR/DD clusters compared to the reference area. Within each area, correlations between metals were used as an indication of commonality of metal sources, which could be anthropogenic or natural. Finally, the distance between the locations of industrial facilities to the soil metal concentrations and soil toxicity values at each sampling location were correlated within each area. Soils were not collected at the residences of case and control mother-child pairs, nor in close proximity to industrial facilities, but instead were collected on a regularly-spaced spatial grid throughout the MR/DD cluster and reference areas. The intent of this study was not to identify a particular facility that could be polluting a defined area and contributing to the MR/DD outcome. Rather, we investigated the potential of both natural and anthropogenic sources to contribute to soil metal concentrations and soil toxicity, and whether metals were distributed differently within MR/DD and reference areas in order to make recommendations to reduce sources and human exposure via surface soils.
Materials and Methods
All study areas were established by address matching records to determine MR/DD risk for each month of pregnancy for the years 1996–2001. All known causes (e.g. genetic and chromosomal syndromes, traumatic or infectious causes) of MR/DD were removed from the database and only unknown causes of MR/DD were retained. Based on Bayesian hierarchical modeling, which uses a local likelihood parameter, clusters of MR/DD were identified using methods described by Zhen et al. (2008). With this method, cluster areas are not restricted to circular areas but instead are defined by irregular shapes as determined by the accumulation of cases versus controls within the areas. A second benefit of the Bayesian modeling is that a continuous risk map is generated in which outcome risk gradients are identified within each cluster area.
One reference and two MR/DD cluster sites were identified for study in a state located in the Southeastern USA. The average MR/DD prevalence rate for Area A (0.14), the reference area, was not different than the state background prevalence rate (0.19). MR/DD prevalence rates for Areas B (0.49) and C (0.25) were significantly higher than that of the state background. An area that cut through the identified MR/DD clusters and through different gradients of MR/DD risk were selected for soil sampling. Sampling was based on a regular grid throughout each area; thus soil sampling nodes were not associated directly with locations of cases and controls within the areas because the residence locations and identity of the study population were confidential for the soil sampling component of the study. The nodes were mapped using ArcGIS® Version 9.2 software (ESRI, 1999–2005). City, county, and road map layers were added to the map for navigation purposes. Sampling occurred as close to 120 grid nodes as possible (Aelion et al., 2008).
An urban area is defined as a location within an urbanized area (UA) or urbanized cluster (US Census, 2002). An UA has a residential population of at least 50,000, an overall population density of at least 1000 people per square mile, and surrounding census blocks that have an overall density of at least 500 people per square mile. The US Census defines a rural location as one that is not defined as urban. Area A is a rural area of approximately 500 km2 (55 km × 9 km). Two small towns (population ~15,000) are located in Area A and land cover and use are mainly agriculture/crop land and forests, and some residential and industrial areas. Area B is a rural area of approximately 105 km2 (13 km × 8 km). One small town (population ~2000) is located in the eastern part of Area B and land cover and use are mostly agriculture/crop land and forests with few residential areas. Area C is designated as an urban area by the US Census. It has an area of approximately 120 km2 (11 km × 11 km). A city (population ~40,000) is located in the area, and the population of the US Census Metropolitan Statistical Area including this city is approximately 300,000. Land use and cover are mostly urban residential, commercial, and industrial.
Area A individual sampling locations were approximately 3–4 km apart for the metals and 1–2 km for the toxicity analyses. Distances between sampling locations were variable in Area B due to primarily agricultural land use and lack of roads, which made some of the nodes on the sampling grid inaccessible; however, most sampling sites were approximately 1–2 km apart. Area C individual sampling locations were 1–2 km apart. Since not all sampling could occur at the exact grid node due to inaccessibility, the actual sampling locations were mapped using ArcGIS®, as were metal concentrations and MST values for each sample location.
For metal analysis, between 20 and 50 g of surface (upper 5 cm) soil were collected at each sample location. Leaf litter and other debris were removed before sampling. Samples were collected with sterile spatulas (Bel-Art, Pequannock, NJ, USA) and placed in sterile Whirl-Pak® bags (Nasco, Fort Atkinson, WI, USA). Samples were stored on ice and refrigerated upon return to the lab. Duplicate samples were collected at 10 % of sampling locations. A GPS unit (Garmin, Olathe, KS, USA) was used to record the exact latitude/longitude of the sampling location.
Within a week of soil collection, a portion of each soil sample was sent to Pace Analytical Laboratory (Huntersville, NC, USA) for sample digestion and analysis of As, Ba, Be, Cr, Cu, Pb, Mn, Ni (EPA method 3050) and Hg (EPA method 7471) with inductively coupled plasma-emission spectroscopy (ICP-ES). Soils collected from every other node throughout the entire area of Area A (60 of 119 soil samples) were analyzed for metals. All samples from Area B (114) and Area C (119) were analyzed for metals. Metal concentrations were reported in mg kg−1 dry weight (mg kgminus;1 dw). Detection limits were ≤ 0.5 mg kg−1 dw for each metal, and any samples with concentrations below the detection limit were set to 0 for further analyses. Field duplicate and blank samples were sent to Pace Analytical and laboratory duplicate, blank, control, and matrix-spiked samples were analyzed by Pace Analytical for QA/QC.
A portion of each sample was also prepared for a general toxicity analysis using the Microtox® Toxicity System (Aelion and Davis, 2007) within three weeks of collection. Microtox® is a general toxicity test that uses a decrease in the luminescence of the bacterium Vibrio fischeri to calculate an effective concentrations (EC50) at which luminescence is decreased by 50 %. All samples collected in each area were analyzed using Microtox®. For Area A, pH was not adjusted before Microtox® analysis. For Areas B and C, pH was adjusted to 6–7 by adding 7 g of soil to 35 mL Microtox® diluent (pH ≈ 7), mixing for 15 min with a magnetic stirring bar, measuring initial pH, and adding 5N sodium hydroxide (NaOH) until the desired pH range was reached. pH was measured with an Orion Ross pH probe (Thermo Scientific, Waltham, MA, USA) and calibrated based on the manufacturer’s instructions. The initial and final soil pH values were recorded for these areas. After pH adjustment, Area B and C samples were analyzed using Microtox®. Because EC50 values (mg L−1) are non-linear, they were log transformed and will henceforth be referred to as Microtox Soil Toxicity (MST) values. Due to the inverse nature of MST values, a lower number indicates higher toxicity, i.e., a lower concentration of the sample causes a 50 % reduction in luminescence.
To determine distances to industrial facilities from sampling locations, the latitudes and longitudes of facilities of interest were obtained from the US Environmental Protection Agency (EPA) Toxic Release Inventory (TRI) using 2005 data, which were the most recent data available when the study was conducted (EPA, 2008). Of 49 total facilities of interest, all except two were in existence from 1996–2001, during which data for MR/DD cluster identification were collected. Facilities had to meet three location criteria: be located in the county(s) in which the areas fell, be within at least 20 km of one sampling location, and be west of at least one sampling location, due to the west-to-east prevailing wind direction and weather patterns typically experienced in the area. The total numbers of TRI facilities identified for each area were 10 for Area A, two for Area B, and 37 for Area C. These facilities were mapped, and distances were calculated in km from each area-specific facility latitude/longitude coordinate to each sampling location latitude/longitude coordinate in that respective area using ArcGIS®. Therefore, there was a distance calculated to each facility attributed to each soil sample location. Information on facility on- and off-site releases for individual chemicals was also obtained from TRI reports.
Metal concentrations from Areas A, C, and pH-adjusted MST values from Areas B and C were compared by area using analysis of variance (ANOVA) in SAS® Version 9.1 (SAS Institute, 2002–2003); a p-value of ≤ 0.05 was used to determine significance. Pearson correlations were carried out for each area for all measured metal concentrations, MST values (Areas B and C only), and distances from facilities to sampling nodes using PROC CORR in SAS; a p-value of ≤ 0.05 was used to determine significance of the correlations.
Results
Soil Metal Concentrations, Toxicity and Potential Sources
Beryllium concentrations were not significantly different between any of the areas (Table 1), and both Areas B and C had high percentages of non-detectable samples (98 % and 99 %, respectively) (data not shown). Metal concentrations of As, Ba, Cr, Cu, Pb, Mn and Ni were statistically greater in the urban MR/DD cluster Area C than the rural Areas A and B (p<0.0001). For Mn, Area A concentrations also were significantly greater than Area B concentrations (p<0.0001). Mercury concentrations were not significantly different between areas (p=0.06). For most metals, Area C had average concentrations at least three times higher than Area A concentrations and at least four times higher than Area B concentrations. Concentration and quartile ranges were also greater for Area C for most metals (Table 1). Area B had the highest percentages of samples below reportable concentration limits (except for Be and Hg) for all locations. Lead and Ba were detected in all samples of Areas A, B and C, and Cu, Cr and Mn were detected in all samples of Areas A and C; As was also detected in all samples of Area C (data not shown).
Table 1.
Metal concentrations (mg kg−1 dry weight), Microtox Soil Toxicity (MST) values (mg L−1) and soil pH for Areas A (n=60 for metals, 120 for MST), B (n=114), and C (n=119), EPA residential Preliminary Remediation Goals (R-PRG; mg kg−1) and ANOVA p-values.
| Area Aa | Area B | Area C | EPA R-PRG | ANOVAc p-value | |||||||
|---|---|---|---|---|---|---|---|---|---|---|---|
| Conc. Range | Mean | Quartile Rangeb | Conc. Range | Mean | Quartile Range | Conc. Range | Mean | Quartile Range | |||
| As | 0–6.4 | 1.3 | 0.7–1.6 | 0–7.4 | 0.97 | 0–1.3 | 0.66–42.1 | 4.1 | 2.3–3.7 | 0.39 | <0.0001* |
| Ba | 2.1–210 | 20 | 7.3–23 | 1.8–35 | 13 | 7.1–18 | 8.4–328 | 73 | 31–89 | 5400 | <0.0001* |
| Be | 0–1.4 | 0.13 | 0–0.15 | 0–0.32 | 0.004 | 0-0 | 0–17.8 | 0.15 | 0–0 | 150 | 0.53 |
| Cr | 1–89 | 7 | 2.1–6.4 | 0–33 | 4.4 | 2.3–4.7 | 3.7–120 | 24 | 12–30 | 210 | <0.0001* |
| Cu | 0.45–23 | 3.2 | 1.2–3.5 | 0–52 | 3 | 0.86–2.8 | 3.1–204 | 17 | 8.6–19 | 3100 | <0.0001* |
| Pb | 2.1–53 | 12 | 5.1–14.3 | 1.6–140 | 17 | 6.9–19 | 2.4–288 | 45 | 15–55 | 400 | <0.0001* |
| Mn | 2.7–1600 | 86 | 10–62 | 0–120 | 22 | 6.1–25 | 32.7–1040 | 260 | 140–340 | 1800 | <0.0001* |
| Ni | 0–21 | 1.8 | 0.65–1.5 | 0–11 | 0.86 | 0–1.2 | 0–45.7 | 6.4 | 2.6–6.9 | 1600 | <0.0001* |
| Hg | 0–0.12 | 0.03 | 0.02–0.04 | 0–0.06 | 0.022 | 0.014–0.03 | 0–0.22 | 0.023 | 0–0.03 | 23 | 0.06 |
| MST | NAd | NA | NA | 3.8–5.59 | 4.66 | 4.41–4.88 | 3.89–5.28 | 4.56 | 4.34–4.79 | NA | 0.03* |
| Initial pH | NA | NA | NA | 3.04–7.4 | 4.26 | 3.76–4.58 | 4.13–7.3 | 5.8 | 5.37–6.25 | NA | <0.0001* |
25th percentile to 75th percentile range;
ANOVA comparisons of MST and pH for Areas B and C only;
Not applicable;
Denotes significant difference
Metal concentrations were compared to EPA Region 9 Preliminary Remediation Goals (PRG), which provide residential and industrial soil limits for inorganic and organic pollutants. Area A, B and C mean As concentrations were higher than the residential soil limit of 0.39 mg kg−1 (Table 1). The Area C mean was also three times higher than the industrial As limit (1.6 mg kg−1; data not shown). For Areas A, B, and C, 82 %, 72 % and 100 % of samples, respectively, had As concentrations greater than the residential limit, and 30 %, 13 %, and 92 % had As concentrations greater than the industrial limit. No other metal concentrations from Areas A, B or C were above the PRG residential soil limits (Table 1).
Only soil from Areas B and C were pH adjusted for Microtox® toxicity measurements and therefore only these MST values were compared statistically. For Areas B and C, initial soil pH means were 4.3 and 5.8, respectively, and initial pH was significantly greater (more alkaline) for Area C than B (p<0.0001; Table 1). Area C had significantly lower MST (more toxic) values than Area B (Table 1).
A number of significant correlations (p ≤ 0.05) between metals, and between MST values and individual metal concentrations was measured within each area. MST values were not included in the correlation analysis for Area A. Beryllium was not included in correlation analyses for Areas B and C due to the high numbers of samples with non-detectable concentrations. Therefore, there were 72 possible correlations between nine metals for Area A, and 72 possible correlations for Areas B and C for eight metals and MST values. Area A had 34, Area B had 23, and Area C had nine significant correlations between metals and MST values. Area A had the most significant correlations, with six metals (Ba, Be, Cu, Pb, Mn, and Ni) significantly correlated with all other metals (Figure 1). All metals were correlated with at least one other metal and the maximum correlation coefficients were 0.95 for Area A between Be and Ni, and 0.93 between Cu and Ni. For Area B, As and Pb concentrations were significantly correlated with all other metals (Figure 1). For Area B all metals were correlated with at least one other metal, and the maximum correlation coefficients were 0.57 between Ba and Mn, and 0.49 between Cu and Pb. Area C had the fewest significant correlations between metals and only Ba, Cr, Cu, Pb, Mn, and Ni concentrations were correlated with at least one metal (Figure 1). The maximum correlation coefficients were 0.77 between Cr and Ni, and 0.72 between Ba and Mn. Significant positive correlations between MST and Pb in Area A, and MST and Pb and MST and Mn in Area C are not included in Figure 1. MST values were significantly negatively correlated (r = −0.2) with Ni concentrations (increase in Ni concentration was associated with an increase in toxicity) in Area B, and with Cr concentrations in Area C (r = −0.23).
Figure 1.
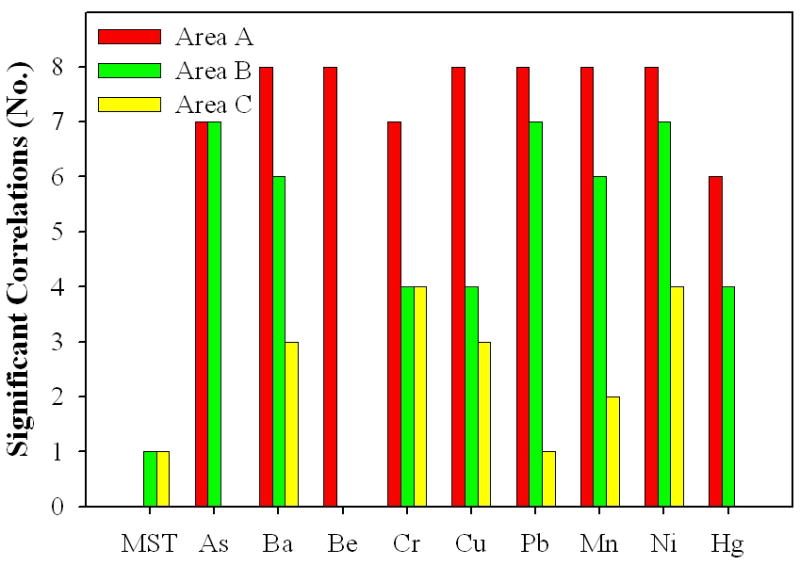
Number of significant correlations for metal concentrations and Microtox® Soil Toxicity (MST) values (by metal or MST) for Areas A, B and C. Nine metals were correlated in Area A, and 8 metals (no Be was measured) and MST values in Areas B and C.
Soil Metal Concentrations, Toxicity and Distances to TRI Facilities
In all areas, most of the TRI facilities investigated were manufacturing facilities. The distance to at least one facility was significantly correlated with at least one metal in each area, and with MST values in Area C only. In all cases, reported metals were negatively correlated with distance (as distance away from a facility increased, metal concentrations decreased), and MST values were positively correlated with distance (as distance away from a facility increased, MST increased which equates to a decrease in soil toxicity). In Area A, Cu concentrations were significantly correlated (p ≤ 0.05) with distances to two facilities, one of which had self-reported on- or off-site releases of Cu in 2005 (Table 2). For the one facility that released Cu, the EPA TRI reported 118 kg of Cu disposed of on-site (air and surface water) and ~34,500 kg transferred to an off-site landfill. In Area B, one facility distance was significantly correlated with concentrations of Ba, Mn, and Hg (Table 2). However, there were no documented on- or off-site releases of these metals from that facility in 2005. In Area C some facilities were located in the same general area and their locations overlap on Figure 2. Multiple crosses identify these locations. In Area C, 34 of 37 facility distances investigated were significantly correlated with either metal concentrations or MST values (Figure 2). Nineteen facility distances were correlated with MST values, and 29 were significantly correlated with Cr, three with Ba, three with Pb, one with Mn, and four with Ni concentrations (Table 2). Of these significant correlations, nine facilities had TRI-reported on- or off-site releases of the metals in 2005. Nine facilities released Cr and one of these also released Ni (Table 2). For Cr, maximum on-site releases to air and surface water were 45 kg, and maximum off-site releases to landfills, surface impoundments, and publicly-owned treatment works (POTW) were 4240 kg in 2005. For Ni, the facility released only 2.3 kg off-site in 2005. The facilities whose distances were significantly correlated with MST values released a variety of organic and inorganic compounds on- and off-site.
Table 2.
Numbers of significant correlations between individual metal concentrations and Microtox Soil Toxicity (MST) values, and distance to facilities for Areas A, B and C.
| Area A | Area B | Area C | |
|---|---|---|---|
| MST | NAa | 0 | 19 |
| As | 0 | 0 | 0 |
| Ba | 0 | 1 (0)b | 3 (0) |
| Be | 0 | 0 | 0 |
| Cr | 0 | 0 | 29 (9) |
| Cu | 2 (1) | 0 | 0 |
| Pb | 0 | 0 | 3 (0) |
| Mn | 0 | 1 (0) | 1 (0) |
| Ni | 0 | 0 | 4 (1) |
| Hg | 0 | 1 (0) | 0 |
| Total No. Facility Distances | 10 | 2 | 37 |
Not applicable (MST values not pH adjusted for Area A);
Number in parenthesis indicates the number of distances to facilities which were significantly correlated with metal concentrations with documented on/off site releases of that metal for 2005.
Figure 2.
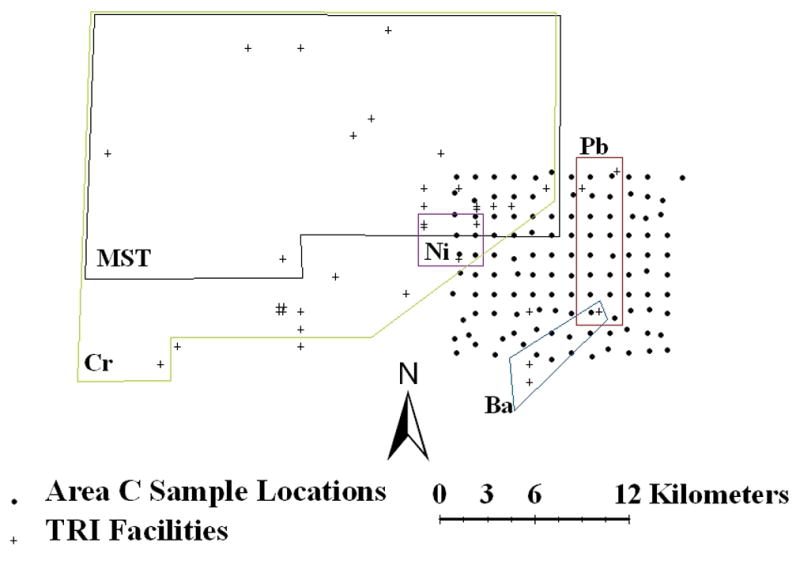
Locations of facilities (+) and soil samples (●) in Area C identifying approximate areas over which distance to facility and metal concentrations and Microtox® Soil Toxicity (MST) were correlated (p ≤ 0.05) as determined using ArcGIS® and SAS. All metals are labeled next to or within boxes corresponding to facilities with distances significantly correlated to concentrations of that metal (Mn not shown). Multiple facilities at one location are represented by multiple +s so that ‡ represents two and ‡‡ represents four facilities in close proximity. Facilities not included within boxes were not significantly correlated by distance to any metal or MST value.
Of all metals measured, only As and Be concentrations were not significantly correlated with distances to facilities in Areas A, B and C (Table 2). Area C had the most facility distances correlated with metal concentrations and MST values, and there were notable groupings of correlated facilities to the west of the sampling locations, especially for Cr and Ni concentrations and MST values (Figure 2). MST values and Cr concentrations were correlated with distance to facilities over large spatial areas in Area C. In contrast, Ba, Pb, Mn, and Ni were correlated with distance to facilities over much smaller spatial areas. Manganese (data not shown) was correlated to the distance to one facility that was shared by Ba and Pb (Figure 2).
Discussion
In this study we did not measure exposure of mothers or children to soils and metals due to confidentiality issues. Instead we measured concentrations of metals and soil toxicity over a uniform grid within identified areas. Of the three areas, the urban MR/DD cluster area (Area C), had the highest concentrations of most measured metals in surface soils compared to the rural MR/DD cluster area (Area B) and the reference area (Area A). Based on the pH-adjusted general soil toxicity indicator from Areas B and C, Area C also had more toxic soils than those collected from Area B.
In general, many of our urban Area C soils metal concentrations were similar to those measured in other urban areas with much greater populations and with more potential anthropogenic sources. Li et al. (2004) measured Cr, Cu, Ni, and Pb concentration ranges in urban Hong Kong top soil of approximately 8–92, 1–117, 5–40, and 12–360 mg kg−1, respectively, which were similar to our Area C concentration ranges of the same metals. In urban parks in Seville, Spain, Madrid et al., (2002) measured average Cr, Cu, Pb, Mn, and Ni concentrations of 248, 5, 4, 10, and 42 mg kg−1, respectively. Our mean Cu, Pb, and Mn concentrations for Area C were greater (17, 45, and 260 mg kg−1, respectively), and our mean Area C Ni and Cr concentrations were lower than those from Seville. Our urban area did not contain as large a city with respect to size and population as those investigated by Li et al. (2004) or Madrid et al. (2002), but it may be impacted by anthropogenic factors that are similar to those impacting other, more highly populated and urbanized locations.
Mercury, Pb and As have been more closely linked with MR/DD than the other metals measured in this study. The most important exposure to Hg is considered to be through the ingestion of contaminated fish (Järup, 2003). In the current study, Hg concentrations were low and fairly consistent among the three areas, and soil and associated dust may not be the most important exposure pathway. Lead is a known neurotoxin and blood Pb levels in children have been correlated with soil and dust Pb levels around the children’s homes (Thornton et al. 1990), and with urban soils in New Orleans, LA, USA (Mielke et al. 2007). The main sources (leaded gasoline, paints, etc.) are more numerous in urban areas than rural areas. Lead concentrations were three to four times higher in Area C than in Areas A and B. Arsenic has been shown to impact neurological functioning due to ingestion of contaminated water (Wasserman et al., 2004), and As exposure also has been documented in humans from highly contaminated soils (Hinwood et al., 2004; Carrizales et al., 2006); however, soil As concentrations in these studies averaged 120 and 790 mg kg−1, respectively, much higher than As concentrations we measured. Arsenic was present in all samples from Area C and As concentrations were three to four times greater in Area C than the other two areas. All As concentrations measured in Area C and most from Areas A and B were greater than EPA PRG residential soil limit.
Contaminant sources, whether anthropogenic or natural, are important to quantify in order to establish preventive measures to reduce exposure. Correlations between metals can indicate commonalties of source. Areas A and B had many more significant correlations between metals than Area C, and all metals were correlated with at least one other metal in Areas A and B, suggesting potential similar sources for these metals. Area C had fewer significant correlations between metals which may indicate more potential metal sources in this urban area. Based on cluster analysis, Chen et al. (1997) found that urban and orchard soils were more heavily polluted by As, Cu, Pb, and Zn than other soils indicating commonality of agricultural sources. Wong et al. (2002) observed a large number of significant correlations between metal concentrations in high density agricultural soils in China, and concluded that the source of Cu, Cr and Zn was geochemical and not anthropogenic. While correlations may indicate similar sources of metals and point to natural occurrence or anthropogenic input, additional research would be required to determine actual sources of metals in each area.
Industrial facilities may impact soil concentrations, as was found by Douay et al. (2007), who identified a significant relation for cadmium (Cd) concentrations and distance (within ~1–2 km) of a former Zn smelter site, a highly significant point source of Cd, in Northern France. The current study examined larger spatial distances and included many facilities with self-reported on- and off-site releases of several chemicals; it did not focus on identifying one large point-source facility. Of the 10 facilities examined in Area A, distances to only two were marginally significantly correlated to soil Cu concentrations and only one facility had documented on and off-site releases of Cu. Only two facilities were examined in Area B, and neither had TRI-reported releases of Ba, Mn or Hg, the three metals to which distances from the facilities were correlated. Area B also had no significant correlations between facility distances and MST values. In general, metal concentrations in soils from Areas A and B were not strongly associated with distance to facilities. These rural areas may not have a sufficient number of facilities to measure associations between metals and facility distance over large spatial areas. The causes for the identified MR/DD cluster do not appear to be associated with soil metals or soil toxicity in Area B.
For Area C, distances to facilities were significantly correlated with metals for which the facilities had self-reported on- or off-site releases in 2005, and for the 10 year period preceding 2005. Within Area C, Ba, Pb and Mn were correlated with distance to facilities over small spatial distances (< 5 km). However, there are no known industrial releases of Ba, Pb, and Mn within the Area. Barium and Mn are expected to occur naturally and associations to industrial facilities are not expected. Nickel also was correlated with distance to facilities over small spatial distances (< 5 km), and the distance to one facility releasing Ni was significantly correlated to concentrations of this metal in soils in Area C.
In Area C, distances to nine facilities releasing Cr were significantly correlated with measured Cr concentrations in soils, indicating potential industrial Cr sources. Chromium was correlated over large spatial scales (>20 km) as was the general soil toxicity indicator (MST), whose correlations to facility distance overlapped geographically with Cr concentration associations. Area C had significantly lower pH-adjusted MST values (more toxic) than Area B. For Area C, 19 facility distances (all of which were located to the west of sampling locations) were correlated with MST values. A variety of chemicals may be released from the facilities, any of which may drive soil toxicity alone or synergistically. Although MST values were not highly correlated with metal concentrations, soil toxicity was correlated with Cr in Area C. It appears that for Area C, soils of high metal concentration and toxicity exist and have associations with distance to facilities. While the majority of metals were disposed of off-site for facilities whose distances were significantly correlated with metals, the potential for contamination due to waste production at these sites cannot be discounted.
Significant correlations of metal concentrations to distance to facilities do not indicate that these facilities are responsible for soil metal concentrations, nor that they have an impact on negative human health outcomes. The significant relation is with the facility distance, not the facility itself. Also at all our sites, As concentrations were greater than the PRG residential limit at many sampling locations and thus are at higher concentrations than is desirable in residential soils. Facility distances were not significantly correlated with As and few of the facilities investigated produced As; this suggests a different anthropogenic (e.g., agricultural) or natural source of As.
Clusters of MR/DD occur in both rural and urban areas; however, due to the small number of births in rural areas, not only are these clusters more difficult to identify, but environmental associations also may be more difficult to detect. In the rural cluster area (Area B), the number of cases was small (4 cases of MR, 91 cases of DD and 181 total children) and the cluster was identified based on the preponderance of DD diagnoses, an outcome that is less well-defined than MR. It is possible that the rural Area B had an over-diagnosis of DD or a localized cluster with no environmental component. It also is possible that the relevant anthropogenic or natural contaminants were not measured, or that the sampling grid was not on an appropriate spatial scale to capture environmental components at this location.
Fifty percent of MR cases have unknown causes (McDermott et al., 2007) and environmental conditions may be a contributing factor to these cases. In order to determine whether any metals or soil toxicity contribute directly to human exposure and MR/DD, additional studies would be needed to quantify actual human exposures and uptake of suspect chemicals, as was done by Mielke et al. (2007). Similarly, to determine if a specific facility is imparting metals and toxicity to surrounding soils, sampling would be required at that individual facility. However, the focus of this study was not to identify individual facilities, but rather to identify whether, on a large scale, distances to facilities were associated with metal concentrations and soil toxicity in residential soils in areas with a known negative childhood health outcome based on maternal residency during pregnancy. Based on the sampling grid used, and measurements of specific metal concentrations and general soil toxicity values, it appears the association can be made in the urban area, but not in the rural area studied.
Acknowledgments
Funding for this research was provided by the National Institutes of Health, National Institute of Environmental Health Sciences, R01 Grant No. ES012895-01A1. We thank F. Nemeth, B. Bey, and M. Engle for help with soil sampling.
Footnotes
Publisher's Disclaimer: This is a PDF file of an unedited manuscript that has been accepted for publication. As a service to our customers we are providing this early version of the manuscript. The manuscript will undergo copyediting, typesetting, and review of the resulting proof before it is published in its final citable form. Please note that during the production process errors may be discovered which could affect the content, and all legal disclaimers that apply to the journal pertain.
References Cited
- Abernathy CO, Liu YP, Longfellow D, Aposhian HV, Beck B, Fowler B, Goyer R, Menzer R, Rossman T, Thompson C, Waalkes M. Arsenic: health effects, mechanisms of action, and research issues. Environ Health Persp. 1999;107:593–597. doi: 10.1289/ehp.99107593. [DOI] [PMC free article] [PubMed] [Google Scholar]
- Aelion CM, Davis HT. Use of a general toxicity test to predict heavy metal concentrations in residential soils. Chemosphere. 2007;67:1043–1049. doi: 10.1016/j.chemosphere.2006.10.042. [DOI] [PubMed] [Google Scholar]
- Aelion CM, Davis HT, McDermott S, Lawson AB. Metal concentrations in rural topsoil in South Carolina: Potential for human health impact. Sci Total Environ. 2008;402:149–156. doi: 10.1016/j.scitotenv.2008.04.043. [DOI] [PMC free article] [PubMed] [Google Scholar]
- ATSDR. Agency for Toxic Substances and Disease Registry. 2008 http://www.atsdr.cdc.gov/
- Calderón J, Ortiz-Pérez D, Yáñez L, Díaz-Barriga F. Human exposure to metals. Pathways of exposure, biomarkers of effect, and host factors. Ecotox Environ Safe. 2003;56:93–103. doi: 10.1016/s0147-6513(03)00053-8. [DOI] [PubMed] [Google Scholar]
- Carrizales L, Razo I, Téllez-Hernández JI, Torres-Nerio R, Torres A, Batres LE, Cubillas AC, Díaz-Barriga F. Exposure to arsenic and lead of children living near a copper-smelter in San Luis Potosi, Mexico: importance of soil contamination for exposure of children. Environ Res. 2006;101:1–10. doi: 10.1016/j.envres.2005.07.010. [DOI] [PubMed] [Google Scholar]
- Caussy D, Gochfeld M, Gurzau E, Neagu C, Ruedel H. Lessons from case studies of metals: investigating exposure, bioavailability, and risk. Ecotox Environ Safe. 2003;56:45–51. doi: 10.1016/s0147-6513(03)00049-6. [DOI] [PubMed] [Google Scholar]
- Chen TB, Wong JWC, Zhou HY, Wong MH. Assessment of trace metal distribution and contamination in surface soils of Hong Kong. Environ Pollut. 1997;96:61–68. doi: 10.1016/s0269-7491(97)00003-1. [DOI] [PubMed] [Google Scholar]
- Douay F, Roussel H, Fourrier H, Heyman C, Chateau G. Investigation of heavy metal concentrations on urban soils, dust and vegetables nearby a former smelter site in Mortagne du Nord, Northern France. J Soils Sediments. 2007;7:143–146. [Google Scholar]
- Drillen CM, Pickering RM, Drummond MB. Predictive value of screening for difficult areas of development. Dev Med Child Neurol. 1988;30:294–305. doi: 10.1111/j.1469-8749.1988.tb14554.x. [DOI] [PubMed] [Google Scholar]
- EPA. Environmental Protection Agency Toxic Release Inventory. 2008 http://www.epa.gov/triexplorer/
- ESRI. ArcGIS Software Version 9.1. Redlands, CA: 1999–2005. [Google Scholar]
- Factor-Litvak P, Wasserman G, Kline JK, Graziano J. The Yugoslavia prospective study of environmental lead exposure. Environ Health Persp. 1999;107:9–15. doi: 10.1289/ehp.991079. [DOI] [PMC free article] [PubMed] [Google Scholar]
- Hinwood AL, Sim MR, Jolley D, de Klerk N, Bastone EB, Gerostamoulos J, Drummer OH. Exposure to inorganic arsenic in soil increases urinary inorganic arsenic concentrations of resident living in old mining areas. Environ Geochem Health. 2004;26:27–36. doi: 10.1023/b:egah.0000020897.15564.93. [DOI] [PubMed] [Google Scholar]
- Hogervorst J, Plusquin M, Vangronsveld J, Nawrot T, Cuypers A, Van Hecke E, Roels HA, Carleer R, Staessen JA. House dust as possible route of environmental exposure to cadmium and lead in the adult general population. Environ Research. 2007;103:30–37. doi: 10.1016/j.envres.2006.05.009. [DOI] [PubMed] [Google Scholar]
- Järup L. Hazards of heavy metal contamination. Brit Med Bull. 2003;68:167–182. doi: 10.1093/bmb/ldg032. [DOI] [PubMed] [Google Scholar]
- Li X, Lee S, Wong S, Shi W, Thornton I. The study of metal contamination in urban soils of Hong Kong using a GIS-based approach. Environ Pollut. 2004;129:113–124. doi: 10.1016/j.envpol.2003.09.030. [DOI] [PubMed] [Google Scholar]
- Madrid L, Díaz-Barrientos E, Madrid F. Distribution of heavy metal contents of urban soils in parks of Seville. Chemosphere. 2002;49:1301–1308. doi: 10.1016/s0045-6535(02)00530-1. [DOI] [PubMed] [Google Scholar]
- Massey P, McDermott S. Disability Prevention Program, Office of the Director, Birth Defects and Developmental Disabilities Division. State-specific rates of mental retardation-United States, 1993. Morbidity and Mortality Weekly Report (MMWR) 1996;45 [PubMed] [Google Scholar]
- McDermott S, Durkin MS, Schupf N, Stein Z. Epidemiology and Etiology of Mental Retardation. In: Jacobson JW, Mulick JA, Rojahn J, editors. Handbook of Intellectual and Developmental Disabilities. Springer Press; New York: 2007. pp. 3–40. [Google Scholar]
- McLaren J, Bryson SE. Review of recent epidemiological studies of mental retardation: prevalence, associated disorders, and etiology. Am J Ment Retard. 1987;92:243–254. [PubMed] [Google Scholar]
- Mielke HW, Gonzales CR, Powell E, Jartun M, Mielke PW. Nonlinear association between soil lead and blood lead of children in metropolitan New Orleans, Louisiana: 2000–2005. Sci Tot Environ. 2007;388:45–53. doi: 10.1016/j.scitotenv.2007.08.012. [DOI] [PubMed] [Google Scholar]
- Pilgrim W, Schroeder B. Multi-media concentrations of heavy metals and major ions from urban and rural sites in New Brunswick, Canada. Environ Monit Assess. 1997;47:89–108. [Google Scholar]
- Rothenberg SJ, Rothenberg JC. Testing the dose-response specification in epidemiology: public health policy consequences for lead. Environ Health Persp. 2005;113:1190–1195. doi: 10.1289/ehp.7691. [DOI] [PMC free article] [PubMed] [Google Scholar]
- Rowbotham AL, Levy LS, Shuker LK. Chromium in the environment: an evaluation of exposure of the UK general population and possible adverse health effects. J Toxicol Environ Health Part B. 2000;3:145–178. doi: 10.1080/10937400050045255. [DOI] [PubMed] [Google Scholar]
- SAS Institute. SAS Software Version 9.1. Cary, NC: SAS Institute, Inc; 2002–2003. [Google Scholar]
- Simeonsson RJ, Sharp MC. Developmental delays. In: Hockelman RA, Friedman SB, Nelson NM, Seidel HM, editors. Primary Pediatric Care. 2. Mosby Publishing; St. Louis, MO: 1992. pp. 867–270. [Google Scholar]
- Stevenson R, Massey P, Shroer R, McDermott S, Richter B. Preventable fraction of mental retardation: an analysis based on 2106 individuals with severe mental retardation in residential facilities in South Carolina. Ment Retard. 1996;34:182–188. [PubMed] [Google Scholar]
- Thornton I, Davies DJA, Watt JM, Quinn MJ. Lead exposure in young children from dust and soil in the United Kingdom. Environ Health Persp. 1990;89:55–60. doi: 10.1289/ehp.908955. [DOI] [PMC free article] [PubMed] [Google Scholar]
- Trasande L, Landrigan PJ, Schechter C. Public health and economic consequences of methyl mercury toxicity to the developing brain. Environ Health Persp. 2005;113:590–596. doi: 10.1289/ehp.7743. [DOI] [PMC free article] [PubMed] [Google Scholar]
- United States Census Bureau. 2002 http://www.census.gov/geo/www/ua/ua_2k.html Census 2000 Urban and Rural Classification.
- Wasserman GA, Liu X, Parvez F, Ahsan H, Factor-Litvak P, van Geen A, Slavkovich V, Lolacono NJ, Cheng Z, Hussain I, Momotaj H, Graziano JH. Water arsenic exposure and children’s intellectual function in Araihazar, Bangladesh. Environ Health Persp. 2004;112:1329–1333. doi: 10.1289/ehp.6964. [DOI] [PMC free article] [PubMed] [Google Scholar]
- Wong SC, Li XD, Zhang G, Qi SH, Min YS. Heavy metals in agricultural soils of the Pearl River Delta, South China. Environ Pollut. 2002;119:33–44. doi: 10.1016/s0269-7491(01)00325-6. [DOI] [PubMed] [Google Scholar]
- Zhen H, Lawson AB, McDermott S, Pande Lamichhane A, Aelion CM. A spatial analysis of mental retardation of unknown cause and maternal residence during pregnancy. Geospatial Hlth. 2008;2:173–182. doi: 10.4081/gh.2008.241. [DOI] [PMC free article] [PubMed] [Google Scholar]