Abstract
It is well-established that significant ischemia-reperfusion injury during kidney transplantation results in increased incidence of long-term fibrosis and rejection. To test for a role of T cell infiltration and activation following ischemic injury, we induced both bilateral and unilateral renal ischemia in mice, followed by reperfusion, and then isolated mononuclear cells. Analysis of these cells by flow cytometry showed that 2 weeks after bilateral ischemia there was a significant increase of CD8 + T cells. Furthermore, both CD4 + and CD8 + T cells infiltrated the injured kidney 6 weeks after unilateral ischemia. These T cells had increased expression of CD69 + and CD44hiCD62L −, markers of activation and effector-memory, respectively. CD4 + NK1.1 + and CD19 + B cells were decreased in percentage both 6 and 11 weeks after bilateral or unilateral injury. There was a significant upregulation of IL-1β, IL-6, TNF-α, IFN-γ, MIP-2, and RANTES expression, measured by real-time PCR, 6 weeks after unilateral renal ischemia, further indicating T cell activation. Depletion of CD4 + and CD8 + T cells before ischemia caused less medullary damage and reduced kidney IFN-γ expression, whereas their depletion following ischemia increased kidney IL-1β; however, depletion of these cells had no effect on histological damage to the kidney. Our study demonstrates that moderate or severe kidney ischemia induces long-term T lymphocyte infiltration and cytokine/chemokine upregulation, leading to kidney structural changes.
Keywords: cell depletion, long-term infiltration, renal ischemia, T lymphocytes
Ischemic acute kidney injury (AKI) is associated with decreased allograft survival in patients with transplanted kidneys and high mortality in patients with native kidneys.1,2 Kidney transplants from living unrelated donors (not well HLA matched) with minimal ischemic injury have improved allograft survival, compared with grafts from well matched cadaveric donors with significant ischemia.3–6 This implies that renal ischemia-reperfusion injury (IRI) can have important consequences on long-term graft survival and native kidneys.
Although much attention has focused on early injury following an ischemic insult, the mechanisms of long-term injury after severe ischemia are not well understood. Renal ischemic injury has been found to permanently damage peritubular capillaries causing hypoxia, which may be involved in the progression of chronic renal disease after AKI.7,8 Tubulointerstitial influx of inflammatory cells is found in many forms of chronic renal diseases, including ‘nonimmune’ diseases such as diabetes and hypertension.9 T-lymphocyte infiltration has also been observed early after moderate ischemia injury,10,11 however, the dynamics of infiltrating lymphocyte populations long term after moderate or severe ischemic injury is unknown.
It has been demonstrated that T and B lymphocytes are important mediators in the pathogenesis of renal IRI,10,12 however, the mechanisms by which these cells induce kidney injury is largely unknown. The trafficking of pathogenic lymphocytes into kidneys after moderate and severe ischemic injury has been postulated to contribute to kidney damage;11,13,14 however the physiologic state and the dynamics of trafficking of these populations long term after ischemia have not been rigorously studied. Furthermore, the activation and expression of the effector-memory phenotype by infiltrated lymphocytes suggests the possibility that these lymphocytes are responding to an injury-associated antigen. 15,16 Unlike previous studies that have simply used immunohistochemistry to detect lymphocytes in ischemic kidneys,14 we have developed a Percoll gradient technique11 to isolate infiltrated T lymphocytes from long-term mouse postischemic kidneys suitable for quantitative phenotypic characterization by flow cytometry.
To make our observations clinically relevant for both allograft and native kidneys, we have studied these phenomena in both a moderate bilateral ischemia (a kin to ischemia in native kidneys) and a severe unilateral ischemia (a kin to IRI in an allograft). Here we report that 2 weeks after bilateral ischemia and 6 weeks after unilateral ischemia the trafficking of CD4 + and CD8 + T cells increased in kidneys. The infiltrating lymphocytes showed activated and effector-memory T-cell phenotypes. Depletion of CD4 + and CD8 + T cells before and after severe unilateral ischemia showed that medullary injury and expression of interferon (IFN)-γ and interleukin (IL)-1β were T cell dependent.
RESULTS
Kidney structural damage after bilateral and unilateral renal IRI
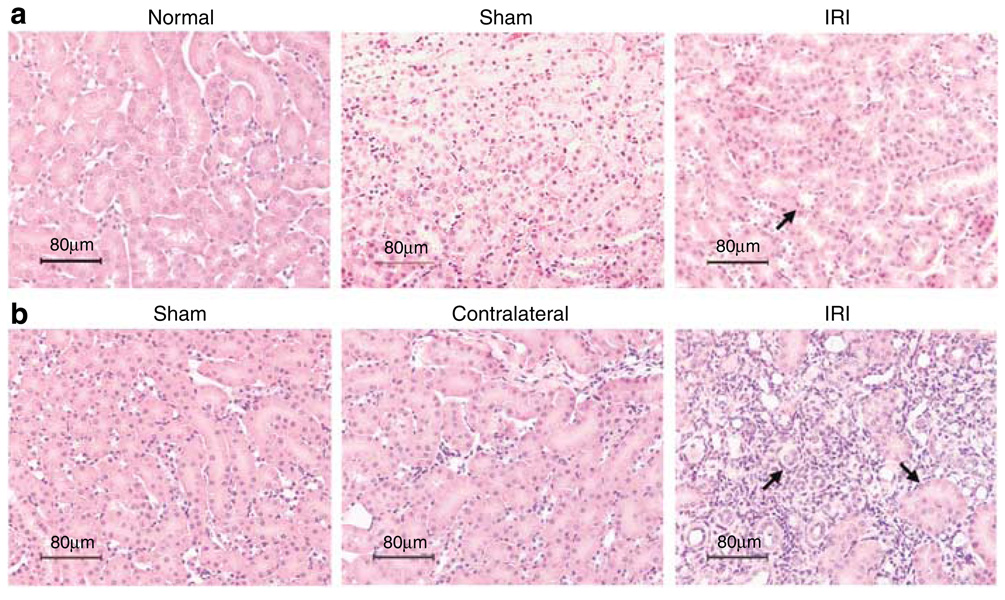
We analyzed the kidney structural injury of cortex and medulla of IRI mice long term after moderate and severe ischemic injury (Figure 1). Unlike normal and sham mice kidneys, IRI kidneys showed limited tubular epithelial injury with rare lymphocyte infiltration in interstitium 2 weeks after 25 min of moderate bilateral renal IRI (Figure 1a). Six weeks after 60 min of severe unilateral renal IRI, sham and contralateral kidneys showed normal histology, however, the IRI kidneys displayed interstitial fibrosis and disruption of tubular architecture with dilation of tubules and cyst formation leading to tubular atrophy (Figure 1b). In addition, IRI kidneys were shrunken in size to approximately half that of the contralateral kidneys 6 weeks after unilateral renal IRI.
Figure 1. Mouse kidney tissue injury 2 weeks after bilateral and 6 weeks after unilateral renal IRI.
Kidney histology in tissue sections stained with H&E was observed at original magnification × 200. Kidney tissue from IRI mice after 2 weeks of 25 min of bilateral ischemia (a, upper panel) shows some proteinaceous casts in tubules compared with normal histology of normal and sham mouse kidneys. Kidney structure 6 weeks after unilateral renal IRI (b, lower panel) shows normal histology of sham and contralateral kidneys compared with severe kidney damage, loss of structure, and cyst formation in IRI kidneys.
CD4 + and CD8 + T cells infiltrate into kidneys long term after moderate and severe ischemia
Percoll gradient was used to effectively elute mononuclear cells from mouse kidneys and then characterize the functional state and phenotype of infiltrating lymphocytes long term after renal IRI. Four-color flow cytometry analysis of freshly isolated kidney mononuclear cells (KMNC) revealed (Table 1) increased percentages of CD4 + (29 ± 7%) and CD8 + (16 ± 2%, P = 0.015) T lymphocytes in IRI kidneys compared with kidneys of sham mice (CD4 + : 11 ± 1% and CD8 + : 6 ± 1%) after 2 weeks of bilateral renal IRI. However, similar percentage of CD4 + and CD8 + T cells was observed in sham and IRI kidneys 6 weeks after bilateral renal IRI. 6 weeks after unilateral renal IRI, we observed a significantly increased percentage of CD4 + (48 ± 3%, P < 0.001) and CD8 + (21 ± 2%, P < 0.001) T lymphocytes compared with kidneys from sham mice (CD4 + : 16 ± 1% and CD8 + : 7 ± 1%) and contralateral kidneys (CD4 + : 11 ± 2% and CD8 + : 5 ± 1%). No changes in CD4 + and CD8 + T-cell populations were observed in any of the groups 11 weeks after unilateral renal IRI.
Table 1.
Percentage of CD4+ and CD8+ T lymphocytes in mouse kidneys after bilateral and unilateral renal IRI
| Cell Phenotype (%) |
Bilateral | Unilateral | ||||||||
|---|---|---|---|---|---|---|---|---|---|---|
| SH | IRI | SH | IRI | SH | C | IRI | SH | C | IRI | |
| 2 Weeks | 6 Weeks | 6 Weeks | 11 Weeks | |||||||
| CD4+ | 11 ± 1 | 29 ± 7 | 48 ± 1 | 51 ± 2 | 16 ± 1 | 11 ± 2 | 48 ± 3** | 47 ± 2 | 45 ± 1 | 48 ± 1 |
| CD8+ | 6 ± 1 | 16 ± 2* | 26 ± 1 | 30 ± 3 | 7 ± 1 | 5 ± 1 | 21 ± 2*** | 32 ± 3 | 34 ± 2 | 27 ± 2 |
C, percentage of lymphocytes of contralateral kidney; IRI, percentage of lymphocytes of ischemia-reperfusion injured kidney; SH, percentage of lymphocytes of sham kidney.
Data are expressed as means ± s.e.m. (n = 3 to 4 mice per group).
P=0.015
P < 0.001 and
P < 0.001.
Infiltrating CD4 + and CD8 + T lymphocytes were activated after ischemic injury
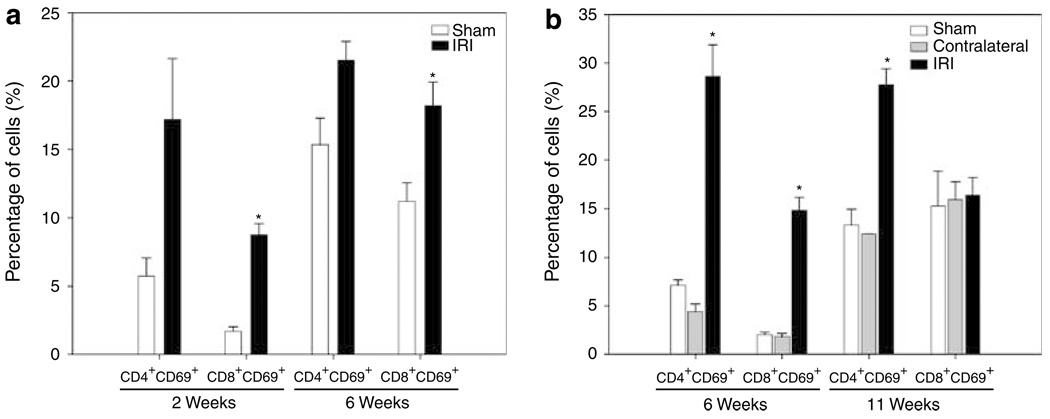
The expression of CD69 antigen on intrarenal CD4 + and CD8 + T cells after long-term ischemia was analyzed. After 2 weeks of bilateral renal IRI (Figure 2a), we observed an increased expression of CD69 on CD4 + (17 ± 4%) and CD8 + (9 ± 1%, P = 0.001) T cells in IRI mice when compared with sham mice (CD4 + : 6 ± 1% and CD8 + : 2 ± 0.3%). Similarly, increased expression of CD69 on CD4 + (22 ± 1%) and CD8 + (18 ± 2%, P = 0.033) T cells in IRI mice compared with sham mice (CD4 + : 15 ± 2% and CD8 + : 11 ± 1%) was observed after 6 weeks of bilateral renal IRI. Six weeks after unilateral ischemia (Figure 2b), we observed a significantly increased expression of CD69 on CD4 + (29 ± 3%, P < 0.001) and CD8 + (15 ± 1%, P = 0.013) T cells compared with kidneys from sham mice (CD4 + : 7 ± 1% and CD8 + : 2 ± 0.2%) and contralateral kidneys (CD4 + : 4 ± 1% and CD8 + : 2 ± 0.3%). However, 11 weeks after renal IRI, only CD4+ T cells from IRI kidneys showed increased expression of CD69 (28 ± 2%, P < 0.001) when compared with sham (13 ± 2%) and contralateral (12 ± 0.02%) kidneys.
Figure 2. Increased expression of CD69 + activation marker on CD4 + and CD8 + T-cell subsets long term after ischemic injury.
Freshly isolated KMNC were stained with mAb anti-CD8 + FITC, anti-CD4 + PerCP, and anti-CD69 + PE and analyzed by flow cytometry. Increased expression of early activation marker CD69 on CD8 + T cells after 2 (*P = 0.001) and 6 (*P = 0.033) weeks of bilateral renal IRI (a, left panel) was observed. After 6 weeks of unilateral ischemia, both CD4 + (*P < 0.001) and CD8 + (*P = 0.013) T cells increased CD69 expression. Increased percentage of CD4 + CD69 + T cells 11 weeks after-unilateral IRI (b, right panel) was also observed. Cells were gated in the lymphocyte and CD3 + T-cell areas and 10,000 events were collected. Values of the bar graphs represent the percentage mean ± s.e.m. (n = 3 to 4 per group.)
CD4 + and CD8 + T lymphocytes display effector-memory phenotype
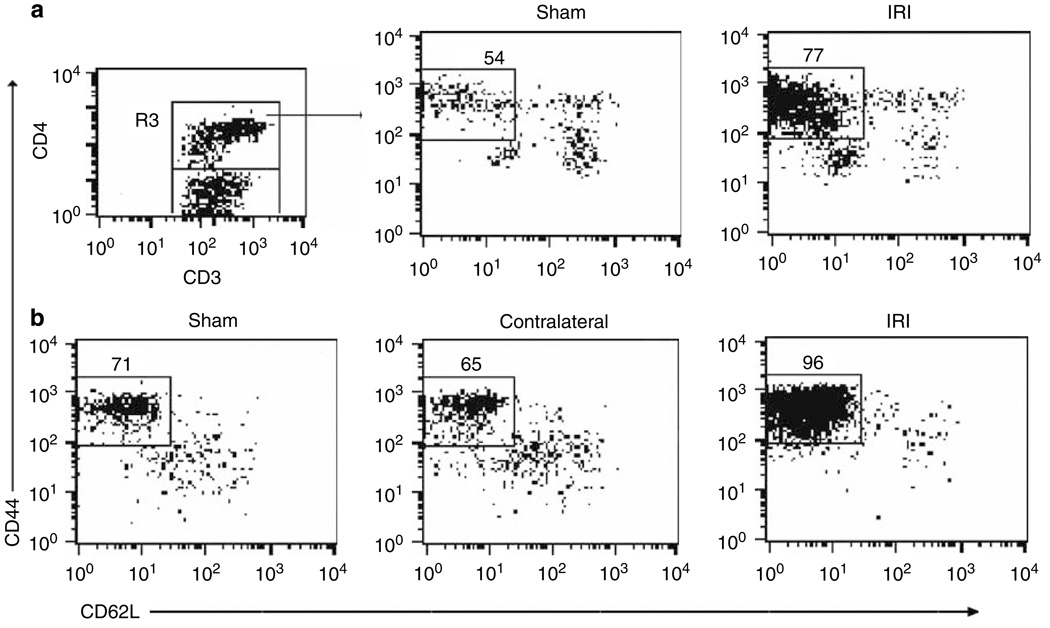
Using multiparameter flow cytometry, we analyzed the gated lymphocyte and CD3 + T-cell areas for expression of homing receptors CD44 and CD62L on CD4 + T cells (R3 gate) to distinguish from naive (CD44loCD62Lhi) or effector-memory (CD44hiCD62L−) phenotype. Two weeks after bilateral renal IRI, significantly increased percentage of effector-memory CD4 + CD44hiCD62L− T cells in IRI kidneys (77 ± 2%, P = 0.001) was observed when compared with kidneys from sham mice (54 ± 3%; Figure 3a). Six weeks after bilateral renal IRI, a significantly increased percentage of CD8 + CD44hiCD62L− T cells in IRI kidneys (90 ± 2%, P = 0.023) compared with sham mice (79 ± 2%) was observed. Similarly, 6 weeks after unilateral renal IRI, the IRI kidneys showed significantly increased percentage of CD4 + CD44hiCD62L− T cells (96 ± 1%, P < 0.001) when compared with kidneys from sham mice (71 ± 3%) and contralateral kidneys (65 ± 2%; Figure 3b). A significant increase in percentage of CD4 + CD44hiCD62L− T cells was observed in IRI kidneys (93 ± 1%, P = 0.004) when compared with sham (80 ± 1%) and contralateral kidneys (75 ± 1%) 11 weeks after renal IRI.
Figure 3. Increased expression of effector-memory CD4 + CD44 hiCD62L − T-cell phenotype after unilateral and bilateral renal IRI.
The percentages of positive cells were obtained from the gated lymphocyte, CD3 + and CD4 + (R3) T-cell areas. Increased percentage of CD4 + CD44hiCD62L− T cells in IRI kidneys (*P = 0.001) compared with kidneys from sham mice after 2 weeks of bilateral renal IRI is shown (a, upper panel). Increased percentage of CD4 + CD44hiCD62L− T cells 6 weeks after unilateral treatment (*P < 0.001; b, lower panel) is shown. Representative dot plots show the mean percentage of positive cells ± s.e.m. (n = 3 to 4 per group.)
NKT cells and B lymphocytes decreased after ischemic injury
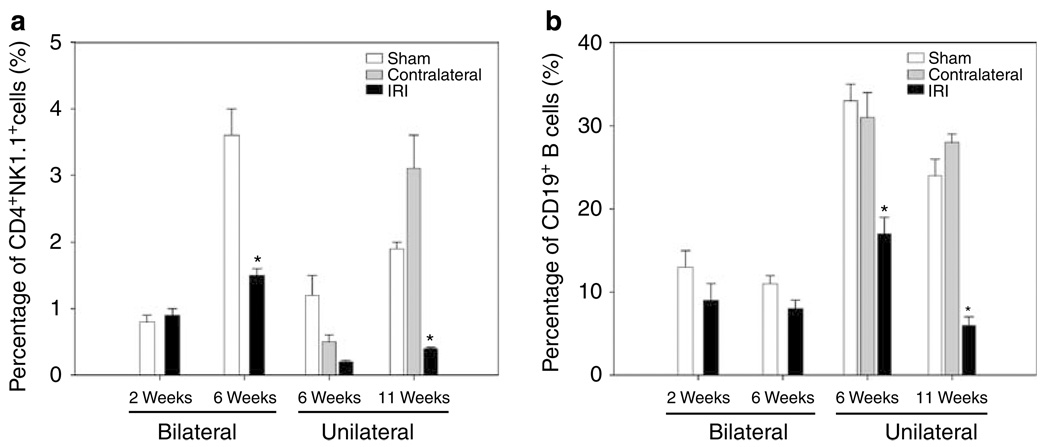
Flow cytometry staining for CD4 and NK1.1 antigens was performed to identify NKT cells (CD4 + NK1.1 +). Similar percentage of NKT cells was observed after 2 weeks of bilateral renal IRI. However, 6 weeks after bilateral renal IRI, we found a significantly decreased percentage of NKT cells in IRI kidneys (2 ± 0.1%, P = 0.007) when compared with kidneys of sham mice (4 ± 0.4%). Eleven weeks after unilateral renal IRI, decreased percentages of NKT cells was observed in IRI kidneys (0.4 ± 0.02%, P = 0.004) when compared to sham (1.9 ± 0.1%) and contralateral kidneys (3.1 ± 0.5%; Figure 4a).
Figure 4. Decreased percentages of CD4 +NK1.1 + cells and CD19 + B cells after bilateral and unilateral renal IRI.
Decreased percentage of CD4 + NK1.1 + T cells is shown in IRI kidneys after 6 weeks of bilateral (*P = 0.007) and 11 weeks of unilateral (*P = 0.004) renal IRI when compared with control kidneys (a, left panel). The percentage of CD19 + B cells also decreased significantly in IRI kidneys after 6 (*P = 0.004) and 11 (*P < 0.001) weeks of unilateral renal IRI (b, right panel). Values of the bar graphs represent the percentage mean ± s.e.m. (n = 3 to 4 per group.)
Unexpectedly, we found that the percentage of CD19 + B lymphocytes decreased significantly in the IRI kidneys after 6 weeks (17 ± 2%, P = 0.004) and 11 weeks (6 ± 1%, P < 0.001) of unilateral renal IRI when compared with sham (6 weeks: 33 ± 2%; 11 weeks: 24 ± 1%) and contralateral kidneys (6 weeks: 31 ± 3%; 11 weeks: 28 ± 1%; Figure 4b). However, no changes were observed in mice that underwent bilateral renal IRI with reduced ischemia times.
Effect of CD4 + and CD8 + T-cell depletion on kidney-cell infiltration
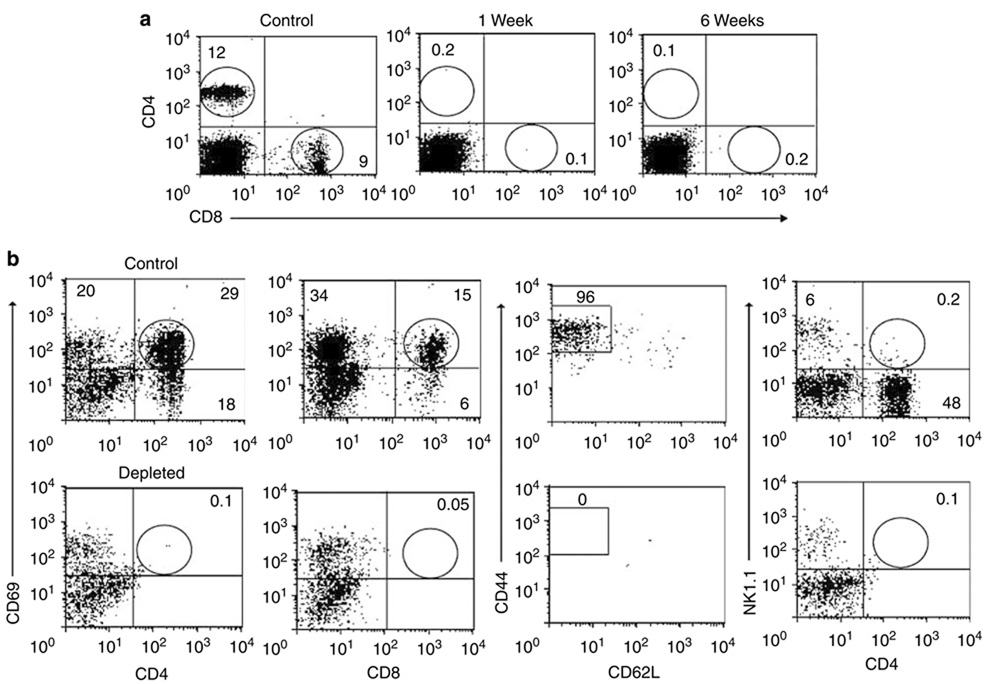
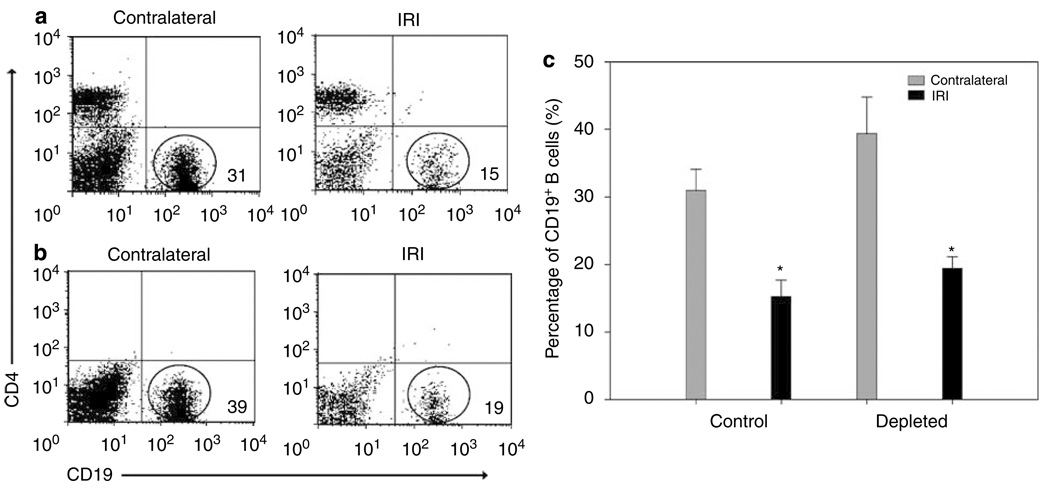
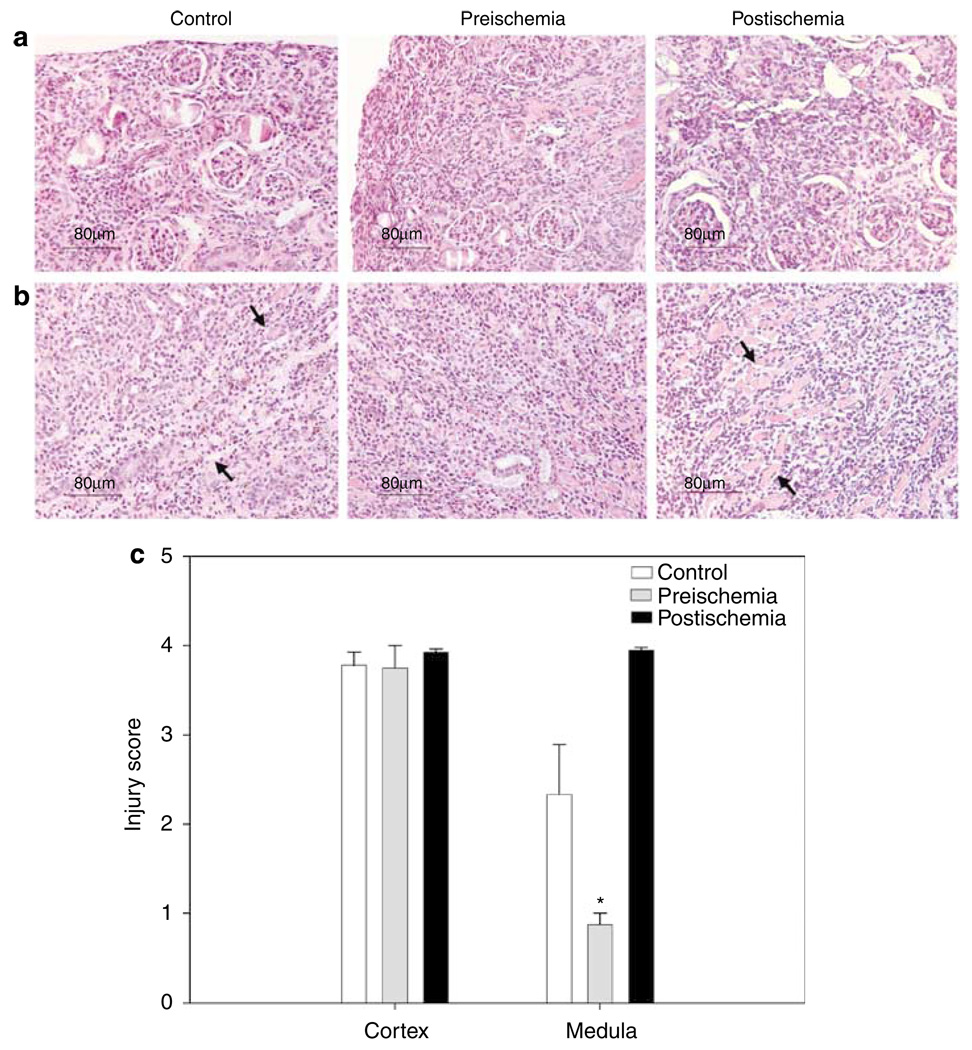
To determine the pathophysiologic role of infiltrating CD4 + and CD8 + T cells long term after ischemia, we depleted these cells before and after unilateral ischemia during the 6-week experiments. Depletion started 24 h preischemia and 3 days postischemia and cell analysis by flow cytometry was performed weekly in blood and after 6 weeks in kidney samples. Blood was 98% depleted of CD4 + and CD8 + T cells during the 6 weeks after renal IRI (Figure 5a). In kidneys, the CD4 + CD69 +, CD8 + CD69 +, CD4 + CD44hiCD62L−, and CD4 + NK1.1 + cells were also depleted by approximately 98%, in relationship with the cell profiles of nondepleted control mice (Figure 5b). After T-cell depletion, CD19 + B cells in both control (Figure 6a) and depleted (Figure 6b) mice were not significantly affected in both contralateral and ischemic kidneys. However, similar decreasing of CD19 + B cells was observed in IRI kidneys of control (15 ± 2%, P < 0.001) and depleted (19 ± 2%, P < 0.028) mice when compared with contralateral kidneys (control: 31 ± 3% and depleted: 39 ± 5%; Figure 6c). To observe the degree of structural damage of ischemic kidneys after 6 weeks of renal IRI in depleted mice, the kidney histology of depleted and control mice were compared. The damage in the cortex (Figure 7a) was similar in control and both depleted mice, however, medullary damage (Figure 7b) was more extensive in control and post-ischemia depleted mice (Figure 7c) than in preischemia depleted mice.
Figure 5. Effect of CD4 + and CD8 + T-cell depletion 6 weeks after severe ischemia.
Depletion of CD4 + and CD8 + T cells in peripheral blood was around 98% during the 6 weeks after ischemic insult (a, upper panel), in comparison to control nondepleted mice. Depletion of CD4 + CD69 +, CD8 + CD69 +, CD4 + CD44hiCD62L−, and CD4 + NK1.1 + T cells in kidneys was around 98%, in comparison to control nondepleted mice (b, lower panel). Representative dot plot examples show the mean percentage of positive cells ± s.e.m. (n = 4 per group.)
Figure 6. Decreased percentages of CD19 + B cells after unilateral renal IRI in both depleted and control (nondepleted) mice.
CD19 + B cells were plotted with CD4 + T cells to observe the difference between depleted and control nondepleted mice. No significant difference existed between control and depleted mice. However, the percentage of CD19 + B cells decreased significantly in IRI kidneys in both control (*P < 0001; a, upper panel) and depleted (*P = 0.028; b, lower panel) mice, after 6 weeks of unilateral renal IRI. Values of the bar graph (c, right panel) represent the percentage of B cells in control and depleted mice (mean ± s.e.m., n = 4 per group).
Figure 7. Histology assessment of kidney tissue sections stained with H&E.
Kidney structure in depleted and control (nondepleted) mice 6 weeks after unilateral ischemia demonstrates damage, loss of structure and cyst formation in IRI kidneys. Pictures show the cortex (a, upper panel) and medulla (b, lower panel) damage to control and both (preischemia and postischemia) depleted mice. Injury score evaluation of kidneys (c), shows same damage in cortex of control and both depleted mice, but lower damage (*P = 0.029) in medulla of preischemia depleted mice (mean ± s.e.m., n = 4 to 8 per group). Original magnification was × 200.
Upregulation of cytokines and chemokines long term after ischemia in T-cell depleted mice
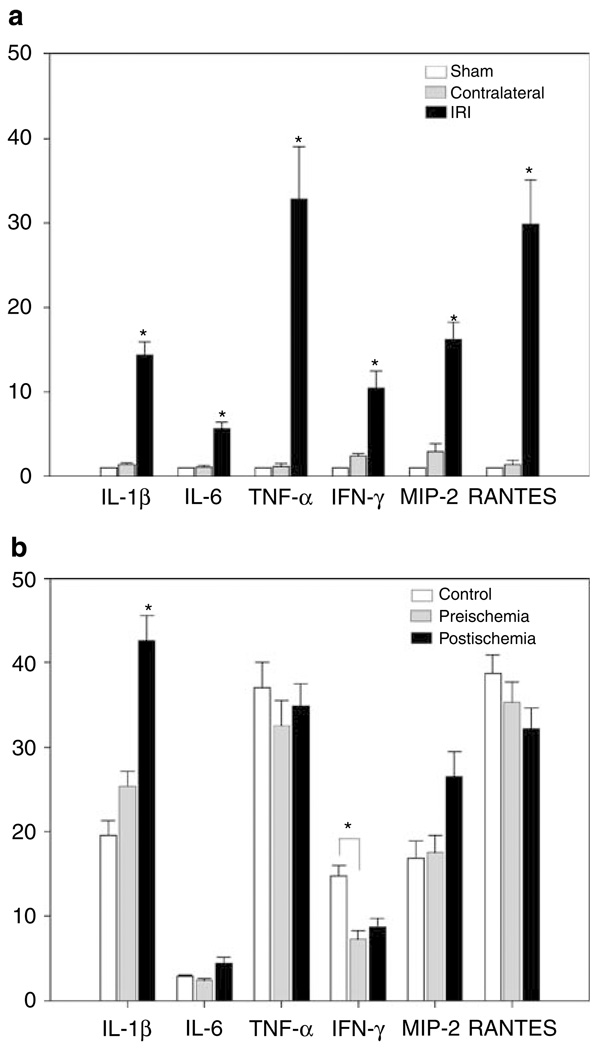
Cytokine and chemokines are known to modulate lymphocyte and kidney cell interactions to mediate kidney injury and fibrosis. Given that infiltrating T cells are activated and selectively expanded in kidney long term after IRI, we hypothesized that there would be a different upregulation of these molecules postischemia in depleted and nondepleted mice. Using real-time RT-PCR, a significant upregulation of IL-1β, IL-6, tumor necrosis factor (TNF)-α, IFN-γ, MIP-2, and RANTES was seen 6 weeks after 60 min of unilateral renal IRI in normal (nondepleted T cells), compared to sham and contralateral kidneys. (Figure 8a). Depletion of CD4 and CD8 T cells starting preischemia led to significant decrease in kidney IFN-γ levels. In contrast, depletion starting 3 days after ischemia led to significant increase in IL-1β (Figure 8b). However, the IRI kidneys of both depleted and nondepleted groups had prominent expression levels of TNF-α and RANTES.
Figure 8. RT–PCR analysis of kidney cytokines and chemokines from CD4 + and CD8 + T-cell depleted and control mice.
Total RNA was isolated from mouse kidneys 6 weeks after 60 min unilateral renal IRI. Relative gene expressions of IL-1β, IL-6, TNF-α, IFN-γ, MIP-2, and RANTES are displayed as fold change values presented as average fold change 2−ΔΔCt method, between IRI mice and control kidneys. High expression (*P < 0.05) of all cytokine and chemokine factors is observed in IRI kidneys of normal nondepleted mice when compared with sham and contralateral ones (a, upper panel). A significant (*P < 0.05) decrease of IFN-γ in preischemia depleted mice, and a significant (*P < 0.05) increase of IL-1β in postischemia mice were observed when compared to profiles of control mice (b, lower panel). Bar graphs represent the percentage mean ± s.e.m. (n = 4 to 8 per group.)
DISCUSSION
These data demonstrate that a single episode of moderate or severe kidney IRI leads to profound long-term changes in the structure and immune response of kidneys. These changes include the activation and expansion of effector-memory T cells as well as the upregulation of proinflammatory cytokines and chemokines in CD4 + and CD8 + T-cell depleted and nondepleted mice. These proinflammatory factors could contribute to the pathogenesis of progressive fibrosis after severe ischemic injury, as well as prime the kidney for further immunologic responses.
The increased levels of CD4 + and CD8 + T cells in the postischemic kidney (Table 1) are consistent with a previous report showing infiltration of CD4 + T cells into kidneys long term after IRI using immunohistochemical staining of tissue sections.14 The increased infiltration of the activated CD69 + marker T lymphocytes in both unilateral and bilateral IRI kidneys (Figure 2), is consistent with upregulation of the early activation marker CD69 antigen observed in allograft rejections and some autoimmune diseases.17–20 Activated cells produce inflammatory factors which can participate in tissue damage including fibrosis, as observed in patients with systemic sclerosis and pulmonary fibrosis.21,22 The high levels of effector-memory CD4 + CD44hiCD62L− T cells, the ‘footprints’ of an immune response to antigens, in both unilateral and bilateral IRI kidneys (Figure 3), are consistent with the response to self-antigens involved in the pathogenesis of skeletal and intestinal ischemia induced by hypoxic stress,23 indicating that immune response to renal IRI could be also initiated by specific antigens. The decreased number of NKT + cells 6 and 11 weeks after bilateral and unilateral renal IRI (Figure 4a), respectively, are similar to that in liver injury24 and rheumatoid arthritis.25 Interestingly, the higher levels of CD4 + and CD8 + T cells 6 and 11 weeks after ischemia (Table 1) as well as the return to normal levels of some populations as CD69 + (Figure 2) and CD44 + markers (Figure 3) after 6 weeks, demonstrate the possible limit and suppression of the immune response after long-term renal IRI. Potential modulators of this immunosuppresion could be the regulatory T cells CD4 + CD25 + or CD4 + CD25 + FoxP3,26,27 as increased populations of these regulatory T cells have been observed in long-term allogenic transplants.28 Future studies can analyze these cells long term after renal IRI.
This study shows that after a severe unilateral ischemic insult, both kidneys could be affected by cellular immune responses. This interconnection between the IRI kidney and the contralateral one can be observed in this study in the T-cell profiles of the contralateral kidneys (Table 1). After 6 weeks of severe unilateral renal IRI, the CD4 + and CD8 + T-cell subsets in contralateral kidneys were lower in relationship to the IRI kidneys, however, at the 11-week time point, these reached approximately the same values of IRI ones. This observation suggests that long term after ischemia was performed, the contralateral ‘naive’ kidney can be infiltrated by lymphocytes due to changes in IRI kidney after ischemia. Trafficking of lymphocytes into naive kidney when contralateral kidney have been exposed to IRI is consistent with, a previous report where albuminuria was induced in naive mice after the transfer of splenocytes from mice long term after renal IRI.29 In contrast, the lymphocyte increase in sham mice kidneys can be explained by cell mobilization phenomenon to distant organs caused by the laparotomy.30 However, the key difference between sham and ischemic kidneys as demonstrated in Figure 8 are the different T cell cytokine/chemokine responses.
This study also demonstrates that kidneys can undergo differential damage long term after severe unilateral ischemia in both depleted and nondepleted mice. Previous reports demonstrated similar results after short-term ischemia in CD4/CD8 T-cell depleted mice,31–33 clearly suggesting both T-cell-dependent and -independent mechanisms in action. We cannot exclude a more significant role for CD4 + and CD8 + T cells in less severe degrees of ischemia injury. However, it should be noted, that the double negative T cells, CD3 + CD4−CD8− that were observed in kidney after the CD4/CD8 depletion (data not shown), could play an important role in the induction of pathogenic cytokines and chemokines production and structural damage of kidneys. A similar mechanism of CD3 + CD4 −CD8− T cells has been observed in long-term transplants of human lung.34 Future studies will be necessary to analyze these cells long term after renal IRI. In addition, CD19 + B cells were observed in both depleted and nondepleted mice, but their population 6 weeks after IRI was decreased (Figure 6). Similarly, in a recent study we have shown a significant decrease of B lymphocytes 24 h after renal IRI,11 suggesting that these cells could be involved in renal repair as well. CD19 + B lymphocytes have been implicated in the pathogenesis of renal IRI, 12 however, it is unknown how these cells mediate kidney injury.
As demonstrated in both depleted and nondepleted mice 6 weeks after unilateral ischemia (Figure 8), the cytokines and chemokines including IL-1β, IL-6, TNF-α, MIP-2, and RANTES were significantly upregulated. It has been reported that in moderate ischemia a modest upregulation of TNF-α and RANTES and strong upregulation of IL-1β, IL-6, IFN-γ, and MIP-2 exist,35 whereas after severe ischemia strong upregulation of TNF-α and RANTES and to a lesser extent IL-1β, IL-6, IFN-γ, and MIP-2 occur.36,37 Similarly, in patients with acute rejection and chronic allograft nephropathy significant expression of TNF-α and RANTES were reported in comparison to the nonrejecting control group.37 Therefore, the reduced damage observed in the kidney medulla of preischemia depleted mice when compared to control mice (Figure 7) could be related to the low expression of IFN-γ (Figure 8b). The IFN-γ produced by CD4 + and CD8 + T lymphocytes is involved early after renal ischemia, 38,39 and has been detected in acute and chronic kidney rejections.40 However, the increased expression of IL-1β in postischemia depleted mice could be related to the increased structural damage of kidney observed41 and could have distant organ affects.42
In conclusion, this study demonstrated that moderate or severe renal ischemic insult can lead to the long-term infiltration of activated and effector-memory CD4 + and CD8 + T cells, and the upregulation of cytokine and chemokine factors. Combined CD4/CD8 T-cell depletion starting preischemia led to decreased kidney IFN-γ and medullary structural protection long term after ischemia insult. However, depletion starting 3 days postischemia increased IL-1β and was not tissue protective. These observations agree with inflammatory cell infiltration and their mediators of progressive fibrosis characterized in human allograft and native kidneys leading to loss of kidney function.43 Future studies will be necessary to understand the detailed roles of leukocyte populations as well as cytokines and chemokines profiles in long-term kidney changes after ischemic insult.
MATERIALS AND METHODS
Mice
Male C57BL/6J, 5–8 weeks of age were purchased from The Jackson Laboratory (Bar Harbor, ME, USA). The mice were maintained under specific pathogen-free conditions. All experiments were performed in accordance with the guide for the Animal Care and Use Committee guidelines.
Renal ischemia model
Established models of moderate and severe renal IRI in mice were used.11–13 Briefly, mice were anesthetized with intraperitoneal pentobarbital (75 mg/kg), underwent midline abdominal incisions, and had their renal pedicles (bilateral) or the left (unilateral) pedicle bluntly dissected. For bilateral ischemia, microvascular clamps were placed on both renal pedicles for 25 min. For unilateral ischemia where animals could survive longer ischemia times, a microvascular clamp was placed on the left renal pedicle for 60 min. The clamps were removed, wounds sutured, and the animals were allowed to recover. Animals were monitored and maintained for 2, 6, and 11 weeks before killing. Sham animals underwent the same surgical procedure without clamping of the renal pedicles.
Kidney histology
Kidneys were dissected from mice and tissue slices were fixed in 10% formalin. For histological examination, formalin tissues were embedded in paraffin and 4-µm sections were stained with H&E. These sections were examined in a blinded fashion by a renal pathologist and nephrologist. The percentage of histology changes in the cortex and medulla were scored using a semiquantitative scale designed to evaluate the degree of necrosis, cell loss, and necrotic casts on a five-point scale based on extent of involvement as follows: 0, normal kidney; 0.5, < 10%; 1, 10–25%; 2, 25–50%; 3, 50–75%; and 4, 75–100%.
Isolation of lymphocytes from mouse kidneys
Lymphocytes were isolated from decapsulated kidneys using a modified protocol previously described.11 Briefly, kidneys were disrupted mechanically in 10 ml of RPMI 1640 medium supplemented with 5% of new born calf serum using a Stomacher 80 Biomaster (Sewart, UK). The samples were centrifuged at 300 g for 10 min to pellet the cells. The pellet was then suspended in 36% Percoll (Amersham Pharmacia Biotech, Piscataway, NJ, USA), gently overlaid onto 72% Percoll and centrifuged at 1000 g for 30 min at room temperature. KMNC were isolated from the Percoll interface and washed twice in medium.
Antibodies
The fluorochrome-conjugated monoclonal antibodies (mAbs) to mouse Ags used for flow cytometry analysis were: anti-CD16/CD32 (2.4G2), anti-CD3e APC (145-2C11), anti-CD4 PerCp (RM4-5), anti-CD8b FITC (53-5.8), anti-CD19 PE (1D3), anti-CD69 PE (H1.2F3), anti-NK1.1 PE (PK136), anti-CD44 FITC (IM7), and anti-CD62L PE (MEL-14), anti-CD4 (GK1.5), anti-CD8 (53.6.72; BD PharMingen, San Diego, CA, USA).
Flow cytometry analysis
KMNC were preincubated with anti-CD16/CD32 Fc receptor for 10 min to minimize nonspecific antibody binding. Cells were then incubated with various combinations of mAbs for 25 min at 4 °C, washed twice with FACS buffer, and fixed with 1% paraformalde-hyde. Three-color immunofluorescence staining was analyzed using a FACSCalibur instrument (BD Biosciences). The lymphocytes were gated using forward and side scatter to exclude debris and dead cells then 10,000 events were acquired in each assay for analysis. Data were analyzed using CellQuest software (BD Biosciences, San Diego, CA, USA).
Quantitative real-time RT-PCR analysis
Quantitation of mouse cytokine transcripts with real-time, one-step reverse transcriptase polymerase chain reaction was performed using the Applied Biosystems’ (Foster City, CA, USA) TaqMan assay system.44 Reverse transcription was performed by using 50 ng total RNA isolated from mouse kidney tissue in a 20 µl reaction volume, and processed with the Superscript first-strand synthesis system for RT–PCR according to the manufacturer’s protocol (Invitrogen, Carlsbad, CA, USA). All PCR amplifications were carried out on an ABI Prism 7300 Sequence Detection System, using a fluorogenic 5′ nuclease assay (TaqMan probes). Probes and primers were designed and synthesized by Applied Biosystems. Relative gene expressions were calculated by using the 2−ΔΔCt method, in which Ct indicates cycle threshold, the fractional cycle number where the fluorescent signal reaches detection threshold.35 The normalized ΔCt value of each sample was calculated using a total of three endogenous mouse control genes (gapdh, actb, and pgk1). Fold change values are presented as average fold change = 2(−average Ct) for genes in treated relative to control samples.
In vivo depletion of CD4 and CD8 lymphocyte subsets
mAbs, specific to CD4 (GK1.1) and CD8 (53.6.72) as described before,45 were used to deplete mice of lymphocyte subsets. Depletions were performed both before and after ischemia injuries. One day before or after 3 days of unilateral ischemia insult, 100 µg of lymphocyte-depleting antibody or an isotype-matched control immunoglobulin G (dose, 100 µg intraperitoneally; Sigma Diagnostics, St Louis, MO, USA) was administered to each mouse by intraperitoneal injection. mAb treatment was then repeated every fourth day. The efficacy of depletion was monitored by using flow cytometry analysis of peripheral blood cells with anti-mouse CD4 PeCp and CD8 FITC (BD PharMingen, San Diego, CA, USA). Efficacy of depletion was measured weekly from the first day of ischemia injury to the day of organ harvest. In this T-cell depletion experiment, the efficacy of depletion was around 98% or greater for both CD4 + and CD8 + T-cell subsets.
Statistical analysis
Data were expressed as mean ± s.e.m. using Sigma Stat 3.0. Statistical comparisons between two groups were performed by the Student’s t-test. Comparisons between multiple groups were performed by one-way ANOVA test followed by Student–Newman—Keuls test where appropriate. Statistical significance was determined as P < 0.05.
ACKNOWLEDGMENTS
This study was supported by NIH Grants: 3R01DK054770-06A1 (MA), 3R01DK054770-05S1 (DBA), R01 DK54770, and SCCOR HL073944 (HR). We thank Hye Ryoun Jang for flow cytometry assistance during the depletion studies.
Footnotes
DISCLOSURE
All the authors declared no competing interest.
REFERENCES
- 1.Tilney NL, Guttmann RD. Effects of initial ischemia/reperfusion injury on the transplanted kidney. Transplantation. 1997;64:945–947. doi: 10.1097/00007890-199710150-00001. [DOI] [PubMed] [Google Scholar]
- 2.Humes HD. Acute renal failure: prevailing challenges and prospects for the future. Kidney Int. 1995;50:S26–S32. [PubMed] [Google Scholar]
- 3.Terasaki PI, Cecka JM, Gjertson DW, et al. survival rates of kidney transplants from spousal and living unrelated donors. N Engl J Med. 1995;333:333–336. doi: 10.1056/NEJM199508103330601. [DOI] [PubMed] [Google Scholar]
- 4.van Es A, Hermans J, van Bockel JH, et al. Effect of warm ischemia time and HLA (A and B) matching on renal cadaveric graft survival and rejection episodes. Transplantation. 1983;36:255–258. doi: 10.1097/00007890-198309000-00006. [DOI] [PubMed] [Google Scholar]
- 5.Sanfilippo F, Vaughn WK, Spees EK, et al. The detrimental effects of delayed graft function in cadaver donor renal transplantation. Transplantation. 1984;38:643–648. doi: 10.1097/00007890-198412000-00019. [DOI] [PubMed] [Google Scholar]
- 6.Halloran PF, Aprile MA, Farewell V, et al. Early function as the principal correlate of graft survival. A multivariate analysis of 200 cadaveric renal transplants treated with a protocol incorporating antilymphocyte globulin and cyclosporine. Transplantation. 1988;46:223–228. [PubMed] [Google Scholar]
- 7.Basile DP, Donohoe D, Roethe K, et al. Renal ischemia injury results in permanent damage to peritubular capillaries and influences long-term function. Am J Physiol Renal Physiol. 2001;281:F887–F899. doi: 10.1152/ajprenal.2001.281.5.F887. [DOI] [PubMed] [Google Scholar]
- 8.Basile DP, Donohoe DL, Roethe K, et al. Chronic renal hypoxia after acute ischemic injury: effects of L-arginine on hypoxia and secondary damage. Am J Physiol Renal Physiol. 2003;284:F338–F348. doi: 10.1152/ajprenal.00169.2002. [DOI] [PubMed] [Google Scholar]
- 9.Remuzzi G, Bertani T. Pathophysiology of progressive nephropathies. N Engl J Med. 1998;339:1448–1456. doi: 10.1056/NEJM199811123392007. [DOI] [PubMed] [Google Scholar]
- 10.Burne MJ, Daniels F, El Ghandour A, et al. Identification of the CD4(+) T cell as a major pathogenic factor in ischemic acute renal failure. J Clin Invest. 2001;108:1283–1290. doi: 10.1172/JCI12080. [DOI] [PMC free article] [PubMed] [Google Scholar]
- 11.Ascon DB, Lopez-Briones S, Liu M, et al. Phenotypic and functional characterization of kidney-infiltrating lymphocytes in renal ischemia reperfusion injury. J Immunol. 2006;177:3380–3387. doi: 10.4049/jimmunol.177.5.3380. [DOI] [PubMed] [Google Scholar]
- 12.Burne-Taney MJ, Ascon DB, Daniels F, et al. B cell deficiency confers protection from renal ischemia reperfusion injury. J Immunol. 2003;171:3210–3215. doi: 10.4049/jimmunol.171.6.3210. [DOI] [PubMed] [Google Scholar]
- 13.Burne-Taney M, Yokota N, Rabb H. Persistent renal and extra renal changes long term after severe renal ischemia reperfusion injury. Kidney Int. 2005;67:1002–1009. doi: 10.1111/j.1523-1755.2005.00163.x. [DOI] [PubMed] [Google Scholar]
- 14.Ibrahim S, Jacobs F, Zukin Y, et al. Immunohistochemical manifestations of unilateral kidney ischemia. Clin Transplant. 1996;10:646–652. [PubMed] [Google Scholar]
- 15.Briscoe DM, Sayegh MH. A rendezvous before rejection: where do T cells meet transplant antigens? Nat Med. 2002;8:220–222. doi: 10.1038/nm0302-220. [DOI] [PMC free article] [PubMed] [Google Scholar]
- 16.Zhang M, Austen WG, Jr, Chiu I, et al. Identification of a specific self-reactive IgM antibody that initiates intestinal ischemia/reperfusion injury. Proc Natl Acad Sci USA. 2004;101:3886–3891. doi: 10.1073/pnas.0400347101. [DOI] [PMC free article] [PubMed] [Google Scholar]
- 17.Afeltra AM, Galeazzi GD, Sebastiani GM, et al. Coexpression of CD69 and HLADR activation markers on synovial fluid T lymphocytes of patients affected by rheumatoid arthritis: a three-colour cytometric analysis. Int J Exp Pathol. 1997;78:331–336. doi: 10.1046/j.1365-2613.1997.290360.x. [DOI] [PMC free article] [PubMed] [Google Scholar]
- 18.Santamaria M, Marubayashi M, Arizon JM, et al. The activation antigen CD69 is selectively expressed on CD8+ endomyocardium infiltrating T lymphocytes in human rejecting heart allografts. Hum Immunol. 1992;33:1–4. doi: 10.1016/0198-8859(92)90044-n. [DOI] [PubMed] [Google Scholar]
- 19.Crispin JC, Martinez A, de Pablo P, et al. Participation of the CD69 antigen in the T-cell activation process of patients with systemic lupus erythematosus. Scand J Immunol. 1998;48:196–200. doi: 10.1046/j.1365-3083.1998.00366.x. [DOI] [PubMed] [Google Scholar]
- 20.Posselt AM, Vincenti F, Bedolli M, et al. CD69 expression on peripheral CD8 T cells correlates with acute rejection in renal transplant recipients. Transplantation. 2003;76:190–195. doi: 10.1097/01.TP.0000073614.29680.A8. [DOI] [PubMed] [Google Scholar]
- 21.Bresser P, Jansen HM, Weller FR, et al. T-cell activation in the lungs of patients with systemic sclerosis and its relation with pulmonary fibrosis. Chest. 2001;120:66S–68S. doi: 10.1378/chest.120.1_suppl.s66. [DOI] [PubMed] [Google Scholar]
- 22.Luzina IG, Atamas SP, Wise R, et al. Occurrence of an activated, profibrotic pattern of gene expression in lung CD8+ T cells from scleroderma patients. Arthritis Rheum. 2003;48:2262–2274. doi: 10.1002/art.11080. [DOI] [PubMed] [Google Scholar]
- 23.Zhang M, Alicot EM, Chiu I, et al. Identification of the target self-antigens in reperfusion injury. J Exp Med. 2006;203:141–152. doi: 10.1084/jem.20050390. [DOI] [PMC free article] [PubMed] [Google Scholar]
- 24.Shimamura K, Kawamura H, Nagura T, et al. Association of NKT cells and granulocytes with liver injury after reperfusion of the portal vein. Cell Immunol. 2005;234:31–38. doi: 10.1016/j.cellimm.2005.04.022. [DOI] [PubMed] [Google Scholar]
- 25.Yanagihara Y, Shiozawa K, Takai M, et al. Natural killer (NK) T cells are significantly decreased in the peripheral blood of patients with rheumatoid arthritis (RA) Clin Exp Immunol. 1999;118:131–136. doi: 10.1046/j.1365-2249.1999.01018.x. [DOI] [PMC free article] [PubMed] [Google Scholar]
- 26.Sarween N, Chodos A, Raykundalia C, et al. CD4+CD25+ cells controlling a pathogenic CD4 response inhibit cytokine differentiation, CXCR-3 expression, and tissue invasion. J Immunol. 2004;173:2942–2951. doi: 10.4049/jimmunol.173.5.2942. [DOI] [PubMed] [Google Scholar]
- 27.Murphy TJ, Ni Choileain N, Zang Y, et al. CD4+CD25+ regulatory T cells control innate immune reactivity after injury. J Immunol. 2005;174:2957–2963. doi: 10.4049/jimmunol.174.5.2957. [DOI] [PubMed] [Google Scholar]
- 28.Braudeau C, Racape M, Giral M, et al. Variation in numbers of CD4+CD25highFOXP3+ T cells with normal immuno-regulatory properties in long-term graft outcome. Transpl Int. 2007;20:845–855. doi: 10.1111/j.1432-2277.2007.00537.x. [DOI] [PubMed] [Google Scholar]
- 29.Burne-Taney MJ, Liu M, Ascon D, et al. Transfer of lymphocytes from mice with renal ischemia can induce albuminuria in naive mice: a possible mechanism linking early injury and progressive renal disease? Am J Physiol Renal Physiol. 2006;291:F981–F986. doi: 10.1152/ajprenal.00229.2005. [DOI] [PubMed] [Google Scholar]
- 30.Jesch NK, Vieten G, Tschernig T, et al. Mini-laparotomy and full laparotomy, but not laparoscopy, alter hepatic macrophage populations in a rat model. Surg Endosc. 2005;19:804–810. doi: 10.1007/s00464-004-2189-0. [DOI] [PubMed] [Google Scholar]
- 31.Suleiman M, Cury PM, Pestana JO, et al. FTY720 prevents renal T-cell infiltration after ischemia/reperfusion injury. Transplant Proc. 2005;37:373–374. doi: 10.1016/j.transproceed.2004.12.280. [DOI] [PubMed] [Google Scholar]
- 32.Faubel S, Ljubanovic D, Poole B, et al. Peripheral CD4 T-cell depletion is not sufficient to prevent ischemic acute renal failure. Transplantation. 2005;80:643–649. doi: 10.1097/01.tp.0000173396.07368.55. [DOI] [PubMed] [Google Scholar]
- 33.Yokota N, Daniels F, Crosson J, et al. Protective effect of T cell depletion in murine renal ischemia-reperfusion injury. Transplantation. 2002;74:759–763. doi: 10.1097/00007890-200209270-00005. [DOI] [PubMed] [Google Scholar]
- 34.Polster K, Walker A, Fildes J, et al. CD4−veCD8−ve CD30+ve T cells are detectable in human lung transplant patients and their proportion of the lymphocyte population after in vitro stimulation with donor spleen cells correlates with preservation of lung physiology. Transplant Proc. 2005;37:2257–2260. doi: 10.1016/j.transproceed.2005.03.114. [DOI] [PubMed] [Google Scholar]
- 35.Hribova P, Kotsch K, Brabcova I, et al. Cytokines and chemokine gene expression in human kidney transplantation. Transplant Proc. 2005;37:760–763. doi: 10.1016/j.transproceed.2004.12.177. [DOI] [PubMed] [Google Scholar]
- 36.Atamas SP. Complex cytokine regulation of tissue fibrosis. Life Sci. 2002;72:631–643. doi: 10.1016/s0024-3205(02)02299-3. [DOI] [PubMed] [Google Scholar]
- 37.Lemay S, Rabb H, Postler G, et al. Prominent and sustained up-regulation of gp130-signaling cytokines and the chemokine MIP-2 in murine renal ischemia-reperfusion injury. Transplantation. 2000;69:959–963. doi: 10.1097/00007890-200003150-00049. [DOI] [PubMed] [Google Scholar]
- 38.Li L, Huang L, Sung SS, et al. NKT cell activation mediates neutrophil IFN-gamma production and renal ischemia-reperfusion injury. J Immunol. 2007;178:5899–5911. doi: 10.4049/jimmunol.178.9.5899. [DOI] [PubMed] [Google Scholar]
- 39.Day YJ, Huang L, Ye H, et al. Renal ischemia-reperfusion injury and adenosine 2A receptor-mediated tissue protection: the role of CD4+ T cells and IFN-gamma. J Immunol. 2006;176:3108–3114. doi: 10.4049/jimmunol.176.5.3108. [DOI] [PubMed] [Google Scholar]
- 40.Obata F, Yoshida K, Ohkubo M, et al. Contribution of CD4+ and CD8+ T cells and interferon-gamma to the progress of chronic rejection of kidney allografts: the Th1 response mediates both acute and chronic rejection. Transpl Immunol. 2005;14:21–25. doi: 10.1016/j.trim.2004.11.003. [DOI] [PubMed] [Google Scholar]
- 41.Haq M, Norman J, Saba SR, et al. Role of IL-1 in renal ischemic reperfusion injury. J Am Soc Nephrol. 1998;9:614–619. doi: 10.1681/ASN.V94614. [DOI] [PubMed] [Google Scholar]
- 42.Kelly KJ. Distant effects of experimental renal ischemia/reperfusion injury. J Am Soc Nephrol. 2003;14:1549–1558. doi: 10.1097/01.asn.0000064946.94590.46. [DOI] [PubMed] [Google Scholar]
- 43.Kuroiwa T, Schlimgen R, Illei GG, et al. Distinct T cell/renal tubular epithelial cell interactions define differential chemokine production: implications for tubulointerstitial injury in chronic glomerulonephritides. J Immunol. 2000;164:3323–3329. doi: 10.4049/jimmunol.164.6.3323. [DOI] [PubMed] [Google Scholar]
- 44.Livak KJ, Schmittgen TD. Analysis of relative gene expression data using real-time quantitative PCR and the 2(−Delta Delta C(T)) Method. Methods. 2001;25:402–408. doi: 10.1006/meth.2001.1262. [DOI] [PubMed] [Google Scholar]
- 45.Hamby K, Trexler A, Pearson TC, et al. NK cells rapidly reject allogeneic bone marrow in the spleen through a perforin- and Ly49D-dependent, but NKG2D-independent mechanism. Am J Transplant. 2007;7:1884–1896. doi: 10.1111/j.1600-6143.2007.01864.x. [DOI] [PubMed] [Google Scholar]


