

Abstract
Background and objectives: Evaluation of renal function by estimation of the glomerular filtration rate (GFR) is very important for the diagnosis and treatment of patients with chronic kidney disease (CKD). The Cockcroft–Gault (CG) and Modification of Diet in Renal Disease (MDRD) formulas are the most commonly used estimations.
Design, setting, participants, & measurements: Estimated GFR values by each formula were compared with measured GFR (mGFR) by renal inulin clearance in 2208 European adults (46% women, 1.4% Caribbean blacks), with and without CKD, and mean mGFR 72.4 ± 39.0 (range 2.2 to 177.2) ml/min/1.73 m2.
Results: Overall, the CG and MDRD formulas showed bias (mean difference) −3.5 ml/min/1.73 m2 (5.3%), P < 0.001, and −9.8 ml/min/1.73 m2 (−6.4%), P < 0.001; precision (SD of bias) 21.5 ml/min/1.73 m2 (43.1%) and 20.0 ml/min/1.73 m2 (33.0%); limits of agreement (2 SD by Bland–Altman method) 39.5 to −46.5 (range 86.0) ml/min/1.73 m2 and 30.2 to −49.8 (range 80.0) ml/min/1.73 m2; and accuracy within ±30% of mGFR 70.8 and 69.0%, respectively. Both formulas showed a trend for decreasing accuracy with lower mGFR levels. According to the Kidney Disease Outcomes Quality Initiative (K/DOQI)-CKD classification's five GFR groups, the CG and MDRD formulas properly assigned 61.6 and 57.1% of the entire population and had a range of positive predictive values 42.6 to 81.8% and 39.6 to 85.2% and of negative predictive values 81.7 to 96.6% and 76.4 to 97.5%, respectively.
Conclusions: The CG and MDRD formulas had some limitations for proper GFR estimation and K/DOQI-CKD classification by GFR levels alone.
The best overall index of renal function is considered to be the glomerular filtration rate (GFR) and a gold standard for its assessment is the renal inulin clearance (Cin) (1,2). Unfortunately, the Cin cannot be used routinely in daily practice because of its complexity as a test, and the same is true for other methods using radiolabeled isotopes or nonradioactive contrast agents (3–5). For practical reasons, several serum creatinine-based formulas for predicting GFR were created in the past (5). The most frequently used ones are the Cockcroft–Gault (CG) formula and the Modification of Diet in Renal Disease (MDRD) study prediction equation. The CG formula was developed by using the mean 24-h urine creatinine excretion from two urine collections obtained in 249 adult men, whereas for women an arbitrary correction coefficient of 0.85 was suggested (6). This formula estimates creatinine clearance (Ccr) instead of GFR. Because creatinine is not only filtered by the glomeruli but also secreted by the tubules, Ccr overestimates the GFR (7). The MDRD formula was created by a stepwise regression analysis of measured GFR (mGFR) by renal clearance of a single-bolus subcutaneous injection of 125I-iothalamate (Cio) in 1628 participants of the MDRD study, which included only patients with chronic kidney disease (CKD) and mean serum creatinine (SCr) 2.3 ± 1.2 mg/dl (8). Previously, some studies reported that Cio overestimates Cin in normal subjects and lupus nephropathy (9,10), and 125I-iothalamate is excreted not only by glomerular filtration but also by tubular secretion (11). Furthermore, in one of these studies (9), we calculated bias (mean/relative differences) between Cio and Cin ranging from −0.6 to 4.6/−2.7 to 23.3 and 18.8 to 26.6/17.4 to 27.1 (ml/min/1.73 m2/%), in two groups of subjects with mean Cin ranging from 17.6 to 24.3 and 95.9 to 108.3 ml/min/1.73 m2, respectively.
The Kidney Disease Outcome Quality Initiative (K/DOQI) clinical practice guidelines for CKD recommended, with few exceptions, the use of CG or MDRD formulas for GFR estimation (2). After the K/DOQI-CKD classification was published, assessment of the GFR became an essential tool in the daily clinical practice. Hence, accurate evaluation of the GFR is of paramount importance for purposes of CKD staging because different clinical action plans according to GFR levels were recommended.
The primary objective of the study presented here was to assess the ability of CG and MDRD formulas to properly estimate the GFR measured by Cin in a large cohort of adults with a broad spectrum of GFR and diverse demographic characteristics and renal pathology.
Materials and Methods
Study Population and Exclusion Criteria
After an electronic search for mGFR by Cin was performed in MEDLINE (last accessed in August 2004), ten authors of previous publications were contacted and seven of them responded by providing eight sets of data. Four data sets were from their respective publications (12–15). One data set was compiled from two publications (16,17), and another one was derived from three publications (18–20). One author provided two data sets, comprising published (21) and unpublished data. Because one study used a different protocol for mGFR (i.e., single-dose injection instead of continuous infusion of inulin), these data were not accepted for further analysis (15). Compiling data from several institutions is feasible when similar GFR measurement methods are used. In total, 2482 individual Cin measurements were available for review, of which 274 were excluded for the following: age <18 yr (n = 169), incomplete data (n = 92), and duplicated measurements (n = 13). The remaining 2208 subjects had data for their respective age, gender, weight, height, and SCr concentration and represent the study cohort.
GFR and SCr Measurements
Cin was used to measure GFR in all data sets. The procedures were previously described in the respective publications. Briefly, intravenous infusion of inulin was initiated as a bolus and continued at constant rate to maintain steady plasma inulin concentration. After an equilibration period, timed urine collections were used to calculate average Cin, which was accepted as mGFR and adjusted for body surface area (BSA).
All SCr values were measured by the Jaffé method (alkaline picrate reaction) using Technicon (12,21), Express Plus (13,14), Hitachi 747 (16,17), and Hitachi 704 and 717 (18–20) autoanalyzers. No information on calibration of the creatinine assays between the laboratories was available. SCr levels reported in micromoles per liter were divided by 88.4 to convert to milligrams per deciliter.
Estimated GFR based on SCr
For each mGFR a respective estimated GFR (eGFR; ml/min/1.73 m2) was calculated using the following
CG formula (6):
 |
MDRD formula (simplified) (22):
 |
where age is in years, weight is in kg, and SCr in mg/dl.
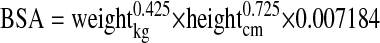
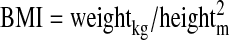
BSA, according to Du Bois and the Du Bois formula (23), and body mass index (BMI) were calculated as follows:
 |
 |
Statistical Analyses
The performance of CG and MDRD formulas was assessed by the following criteria, in which mGFR is deemed as the true value for comparison purposes:
Total bias = mean difference between eGFR and mGFR values
Relative bias = mean percentage difference; that is, [(eGFR − mGFR)/mGFR] × 100
Total precision = SD of bias
Relative precision = SD of relative bias
Agreement = Bland–Altman's method (24) for upper and lower limits (2SD)
Accuracy = percentage of GFR estimations within a particular percentage range from their respective GFR measurements
Sensitivity = percentage of subjects properly classified by eGFR into a particular CKD stage from all subjects indeed belonging to it by mGFR; that is, TP/(TP + FN)
Specificity = percentage of subjects properly not classified by eGFR into a particular CKD stage from all subjects indeed not belonging to it by mGFR; that is, TN/(TN + FP)
Positive predictive value (PPV) = percentage of subjects properly classified by eGFR into a particular CKD stage from all subjects assigned to it by eGFR; that is, TP/(TP + FP)
Negative predictive value (NPV) = percentage of subjects properly not classified by eGFR into a particular CKD stage from all subjects not assigned to it by eGFR; that is, TN/(TN + FN)
where TP and FP are true and false positive, and TN and FN are true and false negative.
All data were analyzed using PC SAS 8.2 software (SAS Institute, Cary, NC). Paired t test (two-tailed) was used to examine differences. The level of significance was set at P < 0.05.
Results
Demographic and Clinical Characteristics
The study cohort included adults from five medical centers located in four European countries. Table 1 reports demographic data for the entire cohort and stratified by mGFR levels. Overall, the population included 45.5% women, 1.4% Caribbean blacks, had a range of age 18 to 95 yr, SCr 0.43 to 14.81 mg/dl, and mGFR 2.2 to 177.2 ml/min/1.73 m2. Among GFR groups, the differences in mean values for weight, height, BSA, and BMI were not statistically significant (P > 0.05). There were data for Ccr in 1189 subjects (49.6% women), with a mean age of 47 ± 15 and 46 ± 15 yr, weight 69.9 ± 18.3 and 74.7 ± 16.5 kg, SCr 1.55 ± 1.15 and 1.98 ± 1.34 mg/L, and Ccr 83.1 ± 42.4 and 79.3 ± 42.2 ml/min in women and men, respectively. Renal pathology included glomerular diseases (14.9%), hypertension (12.1%), diabetic nephropathy (8.1%), tubulointerstitial disease and nephrolithiasis (6.0%), kidney transplant recipients (4.7%), polycystic kidney disease (3.3%), solitary kidney (2.9%), systemic lupus erythematosus (2.8%), multisystemic diseases (2.8%), renovascular disease (2.0%), renal carcinoma (0.4%), and CKD of unknown etiology (7.6%). Other groups included miscellaneous medical diseases without CKD (12.0%), other solid organ transplant recipients (9.0%), kidney transplant donors (4.7%), healthy individuals (2.5%), and unknown (4.2%).
Table 1.
Population characteristicsa
| Characteristic | All | Strata by mGFR (ml/min/1.73 m2)
|
||||||
|---|---|---|---|---|---|---|---|---|
| ≥90 | 60 to 89.9 | 30 to 59.9 | 15 to 29.9 | <15 | ≥60 | <60 | ||
| n (%) | 2208 | 807(37) | 512(23) | 484(22) | 275(12) | 130(6) | 1319(60) | 889(40) |
| Age (yr) | 46 ± 16 | 39 ± 13 | 48 ± 15 | 52 ± 16 | 52 ± 15 | 57 ± 16 | 42 ± 14 | 53 ± 16 |
| Weight (kg) | 70.6 ± 16.0 | 70.2 ± 15.3 | 70.9 ± 18.3 | 70.5 ± 14.8 | 71.0 ± 16.1 | 71.7 ± 15.1 | 70.5 ± 16.5 | 70.8 ± 15.3 |
| Height (cm) | 166 ± 10 | 167 ± 10 | 166 ± 10 | 166 ± 10 | 167 ± 10 | 166 ± 11 | 166 ± 10 | 166 ± 10 |
| BSA (m2) | 1.78 ± 0.21 | 1.78 ± 0.20 | 1.77 ± 0.22 | 1.78 ± 0.21 | 1.79 ± 0.22 | 1.79 ± 0.21 | 1.78 ± 0.21 | 1.78 ± 0.21 |
| BMI (kg/m2) | 25.5 ± 5.5 | 25.2 ± 5.5 | 25.9 ± 6.6 | 25.5 ± 4.8 | 25.5 ± 4.9 | 26.0 ± 5.4 | 25.5 ± 5.9 | 25.6 ± 4.9 |
| SCr (mg/dl) | 1.68 ± 1.34 | 0.90 ± 0.18 | 1.13 ± 0.29 | 1.74 ± 0.54 | 3.30 ± 1.22 | 4.98 ± 2.09 | 0.99 ± 0.25 | 2.70 ± 1.62 |
| MGFR (ml/min/1.73 m2) | 72.4 ± 39.0 | 114.5 ± 17.7 | 75.5 ± 9.0 | 44.3 ± 8.3 | 21.9 ± 4.3 | 10.5 ± 3.1 | 99.4 ± 24.2 | 32.4 ± 15.0 |
| CG (ml/min/1.73 m2) | 68.9 ± 35.0 | 99.9 ± 23.1 | 75.4 ± 22.9 | 48.3 ± 16.3 | 26.8 ± 11.5 | 17.1 ± 6.7 | 90.4 ± 26.0 | 37.1 ± 18.7 |
| MDRD (ml/min/1.73 m2) | 62.6 ± 31.8 | 91.1 ± 19.8 | 69.4 ± 18.1 | 43.7 ± 14.6 | 22.2 ± 9.5 | 13.8 ± 5.5 | 82.7 ± 21.9 | 32.7 ± 17.3 |
Data presented as mean ± SD. mGFR, measured GFR (by renal inulin clearance); BSA, body surface area; BMI, body mass index; SCr, serum creatinine; CG, Cockcroft–Gault formula estimated GFR; MDRD, Modification of Diet in Renal Disease formula estimated GFR.
Relation between mGFR and eGFR
Figure 1 shows the exponential type of relation between SCr and Cin. The relations between mGFR and eGFR by both formulas and their variability coefficients (r2) are depicted in Figure 2. Correlation coefficients (r) between mGFR and eGFR were 0.84 and 0.86 for CG and MDRD formulas, respectively. Regression lines for CG and MDRD formulas had y-intercepts of 8.3 and 6.4, both significantly different from 0 (P < 0.0001), and slopes of 0.93 and 1.05, both significantly different from 1 (P < 0.0001), respectively.
Figure 1.

Relation between serum creatinine concentration and measured glomerular filtration rate (GFR) by renal inulin clearance.
Figure 2.

Relation of measured glomerular filtration rate (GFR) by renal inulin clearance and estimated GFR (eGFR) by (A) Cockcroft-Gault (CG) formula and (B) Modification of Diet in Renal Disease (MDRD) formula. Trend line in bold; r2, variability coefficient.
Bias and Precision
Results for bias and precision are presented in Table 2. Overall, both formulas had statistically significant total and relative bias (P < 0.001) and large total and relative precision. There was a statistically significant total and relative bias in all GFR groups, except in the 60 to 89.9 group for the CG formula and in the 30 to 59.9 and 15 to 29.9 (only total bias in <60) groups for the MDRD formula. The range for total/relative precision values for the CG and MDRD formulas in the GFR groups was 6.4 to 24.4/20.9 to 93.9 and 5.2 to 21.8/17.8 to 68.8 (ml/min/1.73 m2/%), respectively.
Table 2.
Bias, precision, and accuracya
| mGFRb | n | Bias
|
Precision
|
Accuracy
|
|||||||
|---|---|---|---|---|---|---|---|---|---|---|---|
| Total/Relative
|
Total/Relative
|
Within ±15%
|
Within ±30%
|
Within ±50%
|
|||||||
| CGc | MDRDd | CG | MDRD | CG | MDRD | CG | MDRD | CG | MDRD | ||
| ≥90 | 807 | −14.6f/−11.7f | −23.4f/−19.5f | 24.4/20.9 | 21.8/17.8 | 41.4 | 29.9 | 80.9 | 68.7 | 98.4 | 98.3 |
| 60 to 89.9 | 512 | −0.1/0 | −6.1f/−7.8f | 21.4/28.2 | 17.0/22.6 | 41.8 | 40.8 | 75.4 | 79.7 | 94.1 | 97.5 |
| 30 to 59.9 | 484 | 4.0f/9.8f | −0.6/−0.7 | 14.6/32.9 | 13.0/28.7 | 39.5 | 37.6 | 68.8 | 73.4 | 88.6 | 94.8 |
| 15 to 29.9 | 275 | 4.9f/23.0f | 0.4/1.6 | 10.5/48.8 | 8.3/38.2 | 26.9 | 32.4 | 54.9 | 56.0 | 78.2 | 87.6 |
| <15 | 130 | 6.6e/78.0e | 3.3f/42.0f | 6.4/93.9 | 5.2/68.8 | 19.2 | 20.8 | 31.5 | 40.8 | 44.6 | 65.4 |
| ≥60 | 1319 | −9.0f/−7.2f | −16.7f/−15.0f | 24.3/24.7 | 21.7/20.6 | 41.6 | 34.1 | 78.8 | 72.9 | 96.7 | 98.0 |
| <60 | 889 | 4.7f/23.9f | 0.3/6.3f | 12.5/56.0 | 10.9/42.5 | 32.6 | 33.5 | 59.1 | 63.2 | 79.0 | 88.3 |
| Overall | 2208 | −3.5f/5.3f | −9.8f/−6.4f | 21.5/43.1 | 20.0/33.0 | 38.0 | 33.9 | 70.8 | 69.0 | 88.8 | 94.1 |
Bias defined as total (ml/min/1.73 m2) and relative (%) mean difference between estimated and measured glomerular filtration rate (mGFR). Precision defined as one SD of total and relative bias. Accuracy defined as percentage of GFR estimations within ±15, ±30, and ±50% range of respective GFR measurements.
mGFR, measured GFR by renal inulin clearance in ml/min/1.73 m2.
CG, Cockcroft-Gault formula estimated GFR (ml/min/1.73 m2).
MDRD, Modification of Diet in Renal Disease formula estimated GFR (ml/min/1.73 m2).
P < 0.05.
P < 0.001 (estimated versus mGFR).
Agreement
Bland–Altman plots for the differences of eGFR and mGFR against the combined mean values are depicted in Figure 3. The limits of agreement for CG and MDRD formulas were 39.5 to −46.5 and 30.2 to −49.8 ml/min/1.73 m2, respectively.
Figure 3.

Bland and Altman plots comparing measured glomerular filtration rate (GFR) by renal inulin clearance and estimated GFR (eGFR) by (A) Cockcroft-Gault (CG) formula and (B) Modification of Diet in Renal Disease (MDRD) formula. Bold lines define upper (+2 SD) and lower (−2 SD) limits of agreement; dashed lines represent mean difference between eGFR and inulin GFR.
Accuracy
In the overall population, accuracy values within ±10, ±15, ±20, ±25, ±30, and ±50% difference from mGFR for CG and MDRD formulas were 25.5, 38.0, 49.5, 60.0, 70.8, and 88.8% and 23.3, 33.9, 46.8, 58.7, 69.0, and 94.1%, respectively. Accuracy results within ±15, ±30, and ±50% according to GFR groups are presented in Table 2. The best accuracy within ±30% for the CG formula was in the GFR group ≥90 and for the MDRD formula in the 60 to 89.9 GFR group.
Sensitivity, Specificity, PPV, and NPV for the Purpose of K/DOQI-CKD Classification
The performance of both formulas was evaluated in the five CKD stages according to the K/DOQI-CKD classification by GFR levels alone, regardless of other kidney disease markers. Considering the entire cohort, CG and MDRD formulas properly classified 61.6 and 57.1% of the population in their true CKD stages, respectively. Table 3 illustrates the ability of each formula to accurately classify the subjects in their actual CKD stages. The two formulas had their best performance in CKD Stage 3, whereas the worst one for the CG formula was in CKD Stage 5 and for the MDRD formula was in CKD Stage 1. Sensitivity, specificity, PPV, and NPV values for both formulas are shown in Table 4.
Table 3.
K/DOQI-CKD classification of the population by CG and MDRD formulasa
| mGFRb | n | Stage 1
|
Stage 2
|
Stage 3
|
Stage 4
|
Stage 5
|
|||||
|---|---|---|---|---|---|---|---|---|---|---|---|
| eGFR ≥90
|
eGFR 60 to 89.9
|
eGFR 30 to 59.9
|
eGFR 15 to 29.9
|
eGFR <15
|
|||||||
| CG | MDRD | CG | MDRD | CG | MDRD | CG | MDRD | CG | MDRD | ||
| ≥90 | 807 | 64.4 | 49.1 | 33.8 | 47.8 | 1.7 | 3.1 | 0 | 0 | 0 | 0 |
| 60 to 89.9 | 512 | 20.9 | 12.9 | 52.9 | 55.9 | 26.0 | 31.1 | 0.2 | 0.2 | 0 | 0 |
| 30 to 59.9 | 484 | 1.9 | 0.6 | 17.6 | 10.5 | 70.9 | 72.9 | 9.7 | 15.9 | 0 | 0 |
| 15 to 29.9 | 275 | 0 | 0 | 2.5 | 0.0 | 25.5 | 19.6 | 61.8 | 53.5 | 10.2 | 26.9 |
| <15 | 130 | 0 | 0 | 0 | 0 | 5.4 | 0 | 50.8 | 40.0 | 43.8 | 60.0 |
Data presented in %. K/DOQI, Kidney Disease Outcomes Quality Initiative; CKD, chronic kidney disease; CG, Cockcroft-Gault formula; MDRD, Modification of Diet in Renal Disease formula; mGFR, measured glomerular filtration rate by renal inulin clearance (ml/min/1.73 m2); eGFR, estimated GFR (ml/min/1.73 m2) by CG or MDRD formula used for CKD classification (stages based on GFR levels alone). Values in bold represent percentage of properly classified estimates by either formula.
Table 4.
Performance of the CG and MDRD formulas in the GFR groups according to K/DOQI-CKD classificationa
| mGFR | n | Sensitivity
|
Specificity
|
PPV
|
NPV
|
||||
|---|---|---|---|---|---|---|---|---|---|
| CG | MDRD | CG | MDRD | CG | MDRD | CG | MDRD | ||
| ≥90 | 807 | 64.4 | 49.1 | 91.7 | 95.1 | 81.8 | 85.2 | 81.7 | 76.4 |
| 60 to 89.9 | 512 | 52.9 | 55.9 | 78.5 | 74.2 | 42.6 | 39.6 | 84.7 | 84.8 |
| 30 to 59.9 | 484 | 70.9 | 72.9 | 87.0 | 86.2 | 60.5 | 59.7 | 91.4 | 91.9 |
| 15 to 29.9 | 275 | 61.8 | 53.5 | 94.1 | 93.3 | 59.9 | 53.1 | 94.5 | 93.4 |
| <15 | 130 | 43.8 | 60.0 | 98.7 | 96.4 | 67.1 | 51.3 | 96.6 | 97.5 |
Data presented in %. CG, Cockcroft-Gault formula; MDRD, Modification of Diet in Renal Disease; K/DOQI, Kidney Disease Outcomes Quality Initiative; CKD, Chronic Kidney Disease; mGFR, measured glomerular filtration rate by renal inulin clearance (ml/min/1.73 m2); PPV, positive predictive value; NPV, negative predictive value.
Discussion
To the best of our knowledge, this study has the largest ever investigated population with mGFR by continuous inulin infusion and is the only study representing data from several countries. The cohort included presumably normal subjects [i.e., healthy subjects and kidney transplant donors (7.2%)] and patients with and without CKD (67.6 and 21.0%, respectively). There was a very broad spectrum of GFR, wide range of age, approximately equal distribution by gender, very diverse renal pathology, and all major causes of CKD were present. All GFR groups had similar anthropometrics. Compared with the MDRD study population from which the formula was derived (8), the current cohort was on average 4.2 yr younger (46.4 ± 15.7 versus 50.6 ± 12.7), included 10.6% less black subjects (1.4 versus 12) who might be dissimilar to the African American population, had 6.0% more women (46 versus 40), 9.0 kg (11.3%) lower mean weight (70.6 ± 16.0 versus 79.6 ± 16.8), 0.13 m2 (6.8%) lower mean BSA (1.78 ± 0.21 versus 1.91 ± 0.23), and 32.6 ml/min/1.73 m2 (81.9%) higher mean GFR (72.4 ± 39.0 versus 39.8 ± 21.2). Unfortunately, limited information was provided for the CG formula's developing group of 249 men, age 18 to 92 yr. Mean Ccr of 72 ± 36.6 ml/min (ranging from 11 to “normal”) was reported for 236 subjects but only 226 of them were included in the developing group and therefore the exact mean Ccr is unknown (6). For women, the authors adjusted the formula by 0.85 on the basis of previous recommendations that Ccr should be reduced by 10 to 20% because of differing amounts of muscle and fat in women. Our results did not confirm these recommendations because women had 5% (3.8 ml/min) higher mean Ccr despite 6% lower mean weight (22% lower mean SCr) compared with men of similar age.
Both formulas had similar r and r2 values, which demonstrated good correlation and shared variance between mGFR and eGFR values.
Total and relative values for bias and precision have different implications at different GFR levels. For example, for an mGFR of 30 ml/min/1.73 m2, a total eGFR difference of 10 ml/min/1.73 m2 is a relative difference of 33%, whereas for an mGFR of 120 ml/min/1.73 m2, a twice higher total eGFR difference of 20 ml/min/1.73 m2 represents only a 17% relative difference. Taking into account total and relative bias, the results showed a trend for the two formulas to underestimate the high mGFR levels and overestimate the low mGFR levels. Expressed as a SD of bias, precision represents the eGFR range of deviation from the mGFR. For each lower GFR group the total precision values were lower, implicating better performance for both formulas. However, this simply reflected the respective lower mGFR values, because the rising relative precision values revealed increasing lack of precision. Therefore, the performance of a particular formula based solely on total bias and precision, without considering the respective relative values, should be interpreted with great caution.
Bland–Altman plots expressed a large range of agreement for the CG and MDRD estimates, because upper and lower limits were 86 and 80 ml/min/1.73 m2 apart, respectively. Another study with mGFR by Cin reported better, but still large, range of limits of agreement of 62 and 57 ml/min/1.73 m2, respectively (25). One possible explanation is that the study presented here had more mGFR values in the high-end GFR range, because in both studies the Bland–Altman plots revealed larger absolute differences between eGFR and mGFR for higher mGFR levels.
The accuracy analysis combines precision and bias (2). It expresses how many GFR estimates are dispersed (i.e. the density) within a particular range of their respective GFR measurements and therefore is the most useful test. Unfortunately, there is no agreement in the literature on what is an acceptable eGFR percentage deviation from the respective mGFR, and different ranges are being reported. Individual day-to-day GFR variation was found to be as high as 17% (3,5,9) and therefore 15 to 30% difference from the mGFR seems to be a reasonable range. In our study, the overall results for accuracy revealed that approximately 70% of the GFR estimations by either formula were within ±30% of the GFR measurements. For GFR <90 ml/min/1.73 m2, the accuracy for both formulas declined in each subsequent lower GFR group.
The CG and MDRD formulas had low sensitivity (<73%) in all GFR groups; good specificity (>92%) in GFR groups ≥90, 15 to 29.9, and <15; low PPV (<67%) in all but the GFR group ≥90; and good NPV values (>91%) for all groups with GFR <60. For purposes of the K/DOQI-CKD classification, both formulas properly assigned approximately 60% of the entire population. In the five CKD stages, the range of proper classification for CG and MDRD formulas was 43.8 to 70.9% and 49.1 to 72.9%, respectively.
Some limitations of the present study should be noted. The study population included predominantly European Caucasian subjects and therefore the results may not be applicable to other races. Using different laboratories to measure Cin can introduce some differences in mGFR. Nevertheless, a multicenter and multinational data set is much more diverse then any individual study. Applying the formulas to a diverse population in different clinical settings provides much better assessment of their performance. There was no SCr assay calibration between the laboratories in the five medical centers and the MDRD study laboratory. No SCr assays from the CG formula population are available for standardized calibration (26). Creatinine assays using the Jaffé reaction may have higher SCr values because of interference from noncreatinine chromogens, which would mostly underestimate the GFR at high levels (27). In our study, both CG and MDRD formulas showed better accuracy for mGFR ≥60 than <60 ml/min/1.73 m2, therefore it is unlikely that the lack of SCr calibration significantly affected their accuracy. One study reported that the original MDRD formula's GFR bias with the Beckman CX3 kinetic Jaffé assay was reduced from 6.7 to 0.4% for the isotope dilution mass spectrometry (IDMS) assay, from 8.8 to 3.4% for the Roche enzymatic assay, and from 13.7 to 7.1% for the Roche compensated kinetic Jaffé assay when applying the new IDMS-traceable MDRD formula (28). Because the Cio was reported to overestimate the Cin in some studies up to 27.1% as discussed already, it is possible that the GFR marker bias compensated for the SCr calibration's bias.
Estimates of accuracy from smaller studies can be unreliable (2). We reviewed five other publications with >100 adults, mGFR by Cin, and data analyses of the CG and MDRD formulas’ accuracy within ±30% and/or their performance in the K/DOQI-CKD classification (29–33). Four of these studies reported overall ±30% accuracy of 73% (29), 65% (30), 54 and 65% (31), and 58% (33) for the MDRD formula, and one study reported overall ±30% accuracy of 59% (29) for the CG study. In regards to proper K/DOQI-CKD classification, two of these studies reported correct eGFR assignment of 57 and 72% by the CG formula, and 63 and 67% by the MDRD formula (29,32). Some of these results are different from ours, most likely because they were conducted in different populations. Two of the reviewed studies had SCr measurements calibrated to IDMS-traceable values, and both showed worse MDRD formula ±30% accuracy compared with our results (31,33). A recent publication (34) tested three linear equations (35–37) and a proposed correction value (38) for SCr calibration to the MDRD study laboratory in a cohort of 10,108 patients. Despite these calibrations, the MDRD formula did not show valid reproducible GFR estimates for the purpose of the K/DOQI-CKD classification. One of these publications, similar to our study with a large European population of 2095 subjects and a broad spectrum of GFR but measured by 51Cr-labeled EDTA, reported that the CG and MDRD formulas had ±30% accuracy of 79 and 87%, respectively, and misclassified approximately 30% of the subjects according to the K/DOQI-CKD classification (35). In comparison to our results, it is unclear if this formulas’ better performance is due to SCr calibration effect or mean bias of 4.0 ± 4.9 ml/min/1.73 m2 between the 51Cr-labeled ethylenediaminetetraacetic acid (51Cr-EDTA) and inulin renal clearances reported in this studied population.
Conclusions
In the study presented here of a large multicenter population of 2208 subjects with and without CKD, broad GFR spectrum, and diverse renal pathology, the CG and MDRD formulas showed some limitations in their ability to properly estimate the mGFR by Cin. Both formulas had accuracy of approximately 70% of the GFR estimates within ±30% of mGFR and approximately 60% of the population was classified correctly in the five GFR groups defined by the K/DOQI-CKD classification.
Disclosures
None.
Published online ahead of print. Publication date available at www.cjasn.org.
See related editorial, “eGFR: Readjusting Its Rating,” on pages 867–869.
Access to UpToDate on-line is available for additional clinical information at http://www.cjasn.org/
References
- 1.Smith HW: The reliability of inulin as a measure of glomerular filtration. In: The Kidney: Structure and Function in Health and Disease, New York, Oxford University Press, pp 231-238, 1951
- 2.K/DOQI clinical practice guidelines for chronic kidney disease: Evaluation, classification, and stratification. Am J Kidney Dis 39[Suppl 1]: S1–S266, 2002 [PubMed] [Google Scholar]
- 3.Levey AS: Measurement of renal function in chronic renal disease. Kidney Int 38: 167–184, 1990 [DOI] [PubMed] [Google Scholar]
- 4.Gaspari F, Perico N, Remuzzi G: Application of newer clearance techniques for the determination of glomerular filtration rate. Curr Opin Nephrol Hypertens 7: 675–680, 1998 [DOI] [PubMed] [Google Scholar]
- 5.Kemperman FA, Krediet RT, Arisz L: Formula-derived prediction of the glomerular filtration rate from plasma creatinine concentration. Nephron 91: 547–558, 2002 [DOI] [PubMed] [Google Scholar]
- 6.Cockcroft DW, Gault MH: Prediction of creatinine clearance from serum creatinine. Nephron 16: 31–41, 1976 [DOI] [PubMed] [Google Scholar]
- 7.Shemesh O, Golbetz H, Kriss JP, Myers BD: Limitations of creatinine as a filtration marker in glomerulopathic patients. Kidney Int 28: 830–838, 1985 [DOI] [PubMed] [Google Scholar]
- 8.Levey AS, Bosch JP, Lewis JB, Greene T, Rogers N, Roth D: A more accurate method to estimate glomerular filtration rate from serum creatinine: A new prediction equation. Modification of Diet in Renal Disease Study Group. Ann Intern Med 130: 461–470, 1999 [DOI] [PubMed] [Google Scholar]
- 9.Perrone RD, Steinman TI, Beck GJ, Skibinski CI, Royal HD, Lawlor M, Hunsicker LG, and the Modification of Diet in Renal Disease Study: Utility of radioisotopic filtration markers in chronic renal insufficiency: Simultaneous comparison of 125I-iothalamate, 169Yb-DTPA, 99mTc-DTPA, and inulin. Am J Kidney Dis 16: 224–235, 1990 [DOI] [PubMed] [Google Scholar]
- 10.Petri M, Bockenstedt L, Colman J, Whiting-O'Keefe Q, Fitz G, Sebastian A, Hellmann D: Serial assessment of glomerular filtration rate in lupus nephropathy. Kidney Int 34: 832–839, 1988 [DOI] [PubMed] [Google Scholar]
- 11.Odlind B, Hällgren R, Sohtell M, Lindström B: Is 125I iothalamate an ideal marker for glomerular filtration? Kidney Int 27: 9–16, 1985 [DOI] [PubMed] [Google Scholar]
- 12.Couchoud C, Pozet N, Labeeuw M, Pouteil-Noble C: Screening early renal failure: Cut-off values for serum creatinine as an indicator of renal impairment. Kidney Int 55: 1878–1884, 1999 [DOI] [PubMed] [Google Scholar]
- 13.Pierrat A, Gravier E, Saunders C, Caira MV, Ait-Djafer Z, Legras B, Mallié JP: Predicting GFR in children and adults: A comparison of the Cockcroft-Gault, Schwartz, and modification of diet in renal disease formulas. Kidney Int 64: 1425–1436, 2003 [DOI] [PubMed] [Google Scholar]
- 14.Cirillo M, Anastasio P, De Santo NG: Relationship of gender, age, and body mass index to errors in predicted kidney function. Nephrol Dial Transplant 20: 1791–1798, 2005 [DOI] [PubMed] [Google Scholar]
- 15.Burkhardt H, Bojarsky G, Gretz N, Gladisch R: Creatinine clearance, Cockcroft-Gault formula and cystatin C: Estimators of true glomerular filtration rate in the elderly? Gerontology 48: 140–146, 2002 [DOI] [PubMed] [Google Scholar]
- 16.Vervoort G, Willems HL, Wetzels JF: Assessment of glomerular filtration rate in healthy subjects and normoalbuminuric diabetic patients: Validity of a new (MDRD) prediction equation. Nephrol Dial Transplant 17: 1909–1913, 2002 [DOI] [PubMed] [Google Scholar]
- 17.Branten AJ, Vervoort G, Wetzels JF: Serum creatinine is a poor marker of GFR in nephrotic syndrome. Nephrol Dial Transplant 20: 707–711, 2005 [DOI] [PubMed] [Google Scholar]
- 18.Schück O, Gottfriedová H, Malý J, Jabor A, Stollová M, Brz̊ková I, Sibová J, Ryska M, Spicák J, Trunecka P, Nováková J: Glomerular filtration rate assessment in individuals after orthotopic liver transplantation based on serum cystatin C levels. Liver Transpl 8: 594–599, 2002 [DOI] [PubMed] [Google Scholar]
- 19.Schück O, Teplan V, Jabor A, Stollová M, Sibová J: Glomerular filtration rate estimation in patients with advanced chronic renal insufficiency based on serum cystatin C levels. Nephron Clin Pract 93: 146–151, 2003 [DOI] [PubMed] [Google Scholar]
- 20.Schück O, Teplan V, Sibová J, Stollová M: Predicting the glomerular filtration rate from serum creatinine, serum cystatin C and the Cockcroft and Gault formula with regard to drug dosage adjustment. Int J Clin Pharmacol Ther 42: 93–97, 2004 [DOI] [PubMed] [Google Scholar]
- 21.Mpio I, Laville M, Hadj-Aissa A, Fauvel JP: Predicted creatinine clearance to evaluate glomerular filtration rate in black Caribbean subjects. Nephrol Dial Transplant 18: 1307–1310, 2003 [DOI] [PubMed] [Google Scholar]
- 22.Levey AS, Greene T, Kusek JW, Beck GJ: A simplified equation to predict glomerular filtration rate from serum creatinine [Abstract]. J Am Soc Nephrol 11: 155A, 2000 [Google Scholar]
- 23.DuBois D; DuBois EF: A formula to estimate the approximate surface area if height and weight be known. Arch Int Med 17: 863–871, 1916 [PubMed] [Google Scholar]
- 24.Bland JM, Altman DG: Statistical methods for assessing agreement between two methods of clinical measurement. Lancet 1: 307–310, 1986 [PubMed] [Google Scholar]
- 25.Mariat C, Alamartine E, Barthelemy JC, De Filippis JP, Thibaudin D, Berthoux P, Laurent B, Thibaudin L, Berthoux F: Assessing renal graft function in clinical trials: Can tests predicting glomerular filtration rate substitute for a reference method? Kidney Int 65: 289–297, 2004 [DOI] [PubMed] [Google Scholar]
- 26.Stevens LA, Coresh J, Feldman HI, Greene T, Lash JP, Nelson RG, Rahman M, Deysher AE, Zhang YL, Schmid CH, Levey AS: Evaluation of the modification of diet in renal disease study equation in a large diverse population. J Am Soc Nephrol 18: 2749–2757, 2007 [DOI] [PubMed] [Google Scholar]
- 27.Murthy K, Stevens LA, Stark PC, Levey AS: Variation in the serum creatinine assay calibration: A practical application to glomerular filtration rate estimation. Kidney Int 68: 1884–1887, 2005 [DOI] [PubMed] [Google Scholar]
- 28.Vickery S, Stevens PE, Dalton RN, van Lente F, Lamb EJ: Does the ID-MS traceable MDRD equation work and is it suitable for use with compensated Jaffe and enzymatic creatinine assays? Nephrol Dial Transplant 21: 2439–2445, 2006 [DOI] [PubMed] [Google Scholar]
- 29.Mariat C, Alamartine E, Afiani A, Thibaudin L, Laurent B, Berthoux P, De Filippis JP, Thibaudin D, Mayor B, Elessawy AB, Berthoux F: Predicting glomerular filtration rate in kidney transplantation: Are the K/DOQI guidelines applicable? Am J Transplant 5: 2698–2703, 2005 [DOI] [PubMed] [Google Scholar]
- 30.Zahran A, Qureshi M, Shoker A: Comparison between creatinine and cystatin C-based GFR equations in renal transplantation. Nephrol Dial Transplant 22: 2659–2668, 2007 [DOI] [PubMed] [Google Scholar]
- 31.Imai E, Horio M, Nitta K, Yamagata K, Iseki K, Tsukamoto Y, Ito S, Makino H, Hishida A, Matsuo S: Modification of the Modification of Diet in Renal Disease (MDRD) study equation for Japan. Am J Kidney Dis 50: 927–937, 2007 [DOI] [PubMed] [Google Scholar]
- 32.Rostoker G, Andrivet P, Pham I, Griuncelli M, Adnot S: A modified Cockcroft-Gault formula taking into account the body surface area gives a more accurate estimation of the glomerular filtration rate. J Nephrol 20: 576–585, 2007 [PubMed] [Google Scholar]
- 33.Maillard N, Mariat C, Bonneau C, Mehdi M, Thibaudin L, Laporte S, Alamartine E, Chamson A, Berthoux F: Cystatin C-based equations in renal transplantation: Moving toward a better glomerular filtration rate prediction? Transplantation 85: 1855–1858, 2008 [DOI] [PubMed] [Google Scholar]
- 34.Van Biesen W, Vanholder R, Veys N, Verbeke F, Delanghe J, De Bacquer D, Lameire N: The importance of standardization of creatinine in the implementation of guidelines and recommendations for CKD: Implications for CKD management programmes. Nephrol Dial Transplant 21: 77–83, 2006 [DOI] [PubMed] [Google Scholar]
- 35.Froissart M, Rossert J, Jacquot C, Paillard M, Houillier P: Predictive performance of the modification of diet in renal disease and Cockcroft-Gault equations for estimating renal function. J Am Soc Nephrol 16: 763–773, 2005 [DOI] [PubMed] [Google Scholar]
- 36.Hallan S, Asberg A, Lindberg M, Johnsen H: Validation of the Modification of Diet in Renal Disease formula for estimating GFR with special emphasis on calibration of the serum creatinine assay. Am J Kidney Dis 44: 84–93, 2004 [DOI] [PubMed] [Google Scholar]
- 37.Toffaletti J, Blosser N, Hall T, Smith S, Tompkins D: An automated dry-slide enzymatic method evaluated for measurement of creatinine in serum. Clin Chem 29: 684–687, 1983 [PubMed] [Google Scholar]
- 38.Coresh J, Astor BC, McQuillan G, Kusek J, Greene T, Van Lente F, Levey AS: Calibration and random variation of the serum creatinine assay as critical elements of using equations to estimate glomerular filtration rate. Am J Kidney Dis 39: 920–929, 2002 [DOI] [PubMed] [Google Scholar]