Abstract
A disposable, self-contained polymerase chain reaction (PCR) chip with on-board stored, just on time releasable, paraffin-passivated, dry reagents is described. During both storage and sample preparation, the paraffin immobilizes and protects the stored reagents. Fluid flow through the reactor leaves the reagents undisturbed. Prior to the amplification step, the chamber is filled with target analyte suspended in water. Upon heating the PCR chamber to the DNA’s denaturation temperature, the paraffin melts and moves out of the way, and the reagents are released and hydrated. To better understand the reagent release process, a scaled up model of the reactor was constructed and the paraffin migration was visualized. Experiments were carried out with a 30 μl reactor demonstrating detectable amplification (with agarose gel electrophoresis) of 10 fg (~200 copies) of lambda DNA template. The in-reactor storage and on-time release of the PCR reagents reduce the number of needed operations and significantly simplify the flow control that would, otherwise, be needed in lab-on-chip devices.
Keywords: PCR, lab on chip, point of care, nucleic acid amplification
1. Introduction
In recent years, there has been a growing interest in point-of-care (POC) testing with portable, disposable devices that allow inexpensive, rapid detection of infectious diseases, contaminants, and bio-warfare agents.1–6 Such devices are likely to have a significant socio-economic impact, bringing sophisticated analytical tools to Third World countries, rural areas, and resource-poor regions.
In many applications, it is necessary to detect minute quantities of nucleic acids, which requires amplification. Since its advent in the mid 1980s, polymerase chain reaction (PCR) has been one of the most important tools for molecular diagnosis, enabling the amplification of target templates containing just a few molecules to detectable levels. For efficient and selective amplification, PCR requires rapid temperature transitions as well as precise temperature control. Most conventional bench-top PCR thermal cyclers feature slow heating/cooling rates due to their large thermal mass. Hence, rapid thermal cycling has been one of the early motivations for the development of PCR chips having small thermal inertia. Various micro PCR devices have been fabricated with silicon7–9 and glass10–11. Because of its superior thermal conductivity and well-established fabrication processes, silicon has predominantly been utilized to attain rapid PCR cycling. Neuzil et al.9 demonstrated real-time PCR on a silicon-based system capable of performing 40 cycles in less than 6 minutes, which corresponds to a heating rate of 175 °C s−1 and a cooling rate of −125 °C s−1. However, silicon suffers from a few drawbacks such as PCR inhibition of untreated silicon, optical opacity, and high processing cost. Glass has often been used as an alternative substrate since it is chemically inert and optically transparent. Not surprisingly, silicon/glass hybrid substrates12–14 have also been utilized to exploit the benefits of both materials. For example, Neuzil et al.14 constructed a PCR reactor consisting of a disposable glass slide interfacing with a silicon substrate that included the heating and sensing elements.
With the growing interest in miniaturized, integrated point of care diagnostic devices, polymeric materials such as PDMS15, 16, PMMA17, polyimide18, and polycarbonate19–21 have come into wide use because of their low cost, ease of manufacturing, optical transparency, and biocompatibility. The polymers have, however, the disadvantage of poor thermal conductivity, which limits rapid thermal response. To overcome this limitation, Giordano et al.18 used non-contact heating such as infrared radiation to carry out 15 PCR cycles within 240s in a polyimide chip.
In most cases, the reagents needed for the PCR are added into the PCR chamber just prior to the amplification process. For point of care testing, it is desirable, however, for all the needed reagents to be preloaded and stored in the sample processing unit either in a liquid or in a dried form. Such self-contained devices would eliminate the time needed to load the reagents, reduce the expertise needed to operate the device, reduce the risk of contamination, and enhance portability. Although dry reagents have long been used in lateral flow immunoassays22, they haven only rarely been used in nucleic acid-based, point of care assays. While Weigl et al.23 presented a procedure for preparing and handling dry reagent storage aimed for use in microfluidic assays, the dry reagents were not pre-stored in the microfluidic chip. Brivio et al.24 demonstrated on-chip PCR amplification with freeze-dried25 reagents stored in polymer PCR chips. In their work, long-term stability of the reagents was emphasized, but there was little discussion of flow control or the integration of the storage into the chip.
In this paper, we report on a disposable, polycarbonate PCR chip with dry reagents preloaded in the reaction chamber and passivated with paraffin. This arrangement allows one to flow the sample through the PCR reactor without disturbing the pre-stored reagents and has the potential of significantly simplifying the operation and flow control of the lab-on-chip unit for the processing of nucleic acids. During the initial denaturation step, the paraffin melts and the reagents are released and reconstituted. To gain insights into the paraffin’s behavior after its melting, a set of flow visualization tests were carried out in Hele-Shaw cells. The paraffin’s effect on the temperature distribution in the PCR chamber was studied theoretically. A PCR reactor was constructed with polycarbonate and tested. The reactor was heated and cooled with two Peltier units controlled with a custom-made software program. Amplification experiments were carried out with serial dilution of a lambda DNA template. The PCR products were detected with agarose gel analysis.
2. PCR with on-board stored, paraffin-encapsulated, dry reagents
To facilitate long-shelf life at room temperature, it is necessary to store the reagents in a dry state. Additionally, to simplify the flow control of the microfluidic system, it is desirable to isolate and protect the PCR reagents from the flow stream. We accomplish these objectives by storing all the PCR reagents (except the target DNA template) inside the PCR chamber. The reagents are introduced into the PCR chamber during the chip assembly and passivated with paraffin film. The procedure for the reagents’ encapsulation is described in the Supplementary Information.
To carry out the amplification process, one only needs to flow the target template, suspended in water, into the reaction chamber. During the initial denaturation step of the thermal cycling process, the wax melts. By the combined action of surface tension and buoyancy forces, the molten wax migrates, releasing the dry reagents and enabling their hydration. As a byproduct, we have “hot-start” effect24 since the enzymes are released and hydrated only at elevated temperatures. This way we reduce the incidence of non-specific amplification that may occur at temperatures lower than the optimized annealing temperature.
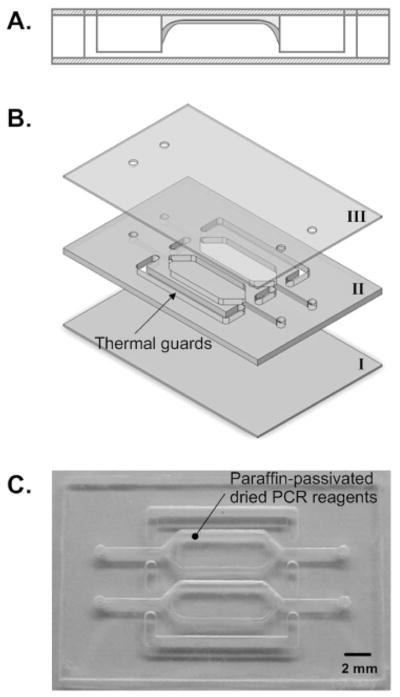
Fig. 1 is a schematic of the PCR chamber with pre-stored, wax-encapsulated reagents. Fig. 1A depicts the cross-section of the reactor and points out the location of the stored reagents. Fig. 1B is an exploded view of the chip. Fig. 1C is a photograph of the chip. The chips used in the experiments contained two reaction chambers. One chamber operated with dry-stored, wax-encapsulated reagents while the second chamber served as a control and operated with wet reagents. Both chambers were subjected to the same thermal cycling process. We constructed the chip in this way to enhance direct comparison of the two PCR methods.
Figure 1.
A schematic of the PCR chip with pre-stored, wax-encapsulated, dry reagents. (A) cross-section of a reactor. (B) An exploded view of the chip comprised of three layers of polycarbonate sheets (the thicknesses of layers I, II, and III are, respectively, 250μm, 750μm, and 250μm). (C) A photograph of the PCR chip containing two PCR reactors.
3. Paraffin migration upon heating
The key factor for the successful operation of our dry storage PCR reactor is the migration of the paraffin out of the way, once it has been heated above its melting temperature, so that it does not interfere with the reactor’s operation and does not clog any of the conduits. Since the PCR reactor is shallow (about 750μm in height), it was not possible to carry out flow visualization in the reactor itself. Instead, we constructed a mock-up of the reactor consisting of a relatively thin, tall Hele-Shaw cell (10mm height × 8mm width × 3mm depth). Due to its relatively large height, the buoyancy forces in the Hele-Shaw cell are significantly larger than in the actual PCR reactor and so are the time constants associated with the heating process. Nevertheless, we found it instructive to observe what happens to the paraffin once it has melted.
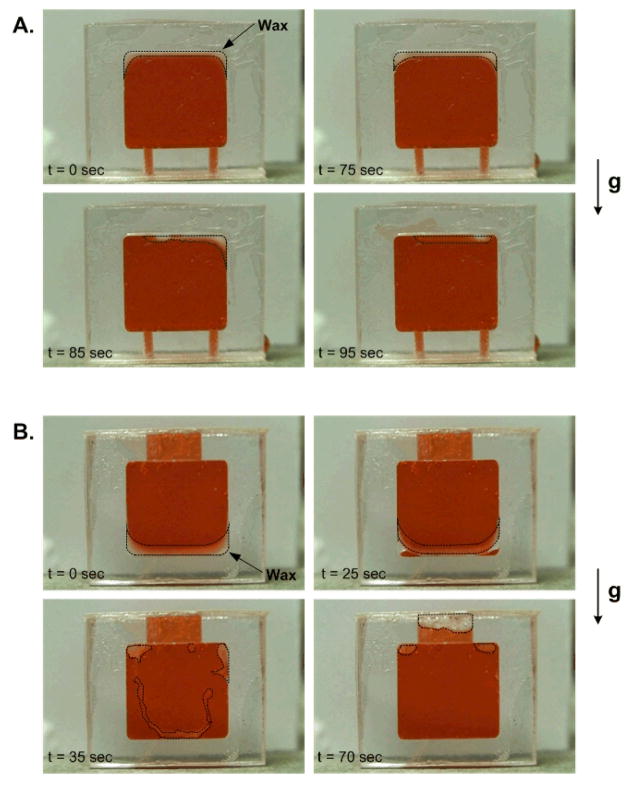
We considered the two cases depicted in Fig. 2. In the first case (Fig. 2A), the paraffin layer was initially deposited along the reactor’s ceiling. In the second case (Fig. 2B), the paraffin film was deposited along the reactor’s floor and the reactor was equipped with a collection cap at its top. The reactor chamber was filled with red-dyed water, sealed with adhesive, and placed on a hot plate at 95°C. The chain of events inside the reactor was monitored with a video camera. In the frames shown in Fig. 2, the water appears dark while the paraffin is whitish. Thermal expansion was accommodated by the air trapped inside the chamber during the chamber sealing step.
Figure 2.
Visualization of the migration of the wax initially coated along (A) the ceiling and (B) the floor of a polycarbonate chamber. The dyed water appear dark and the wax is whitish. The chamber was held in a vertical position and heated on a hot plate maintained at 95 °C. The dotted lines identify the contour of the wax patch.
Fig. 2A shows the paraffin’s migration when the paraffin was initially deposited along the chamber’s ceiling. The molten wax migrated toward the ceiling’s center. We speculate that the process was driven by surface tension effects. Most likely, due to convection and other effects, the temperatures next to the side walls were slightly hotter than at the center. The horizontal temperature gradients induced surface tension gradients, which, in turn, caused the paraffin to flow towards the center.
Fig. 2B illustrates the case when the paraffin was initially deposited along the reactor’s floor. Due to the lower conductivity of the polycarbonate, one would expect horizontal temperature gradients with the temperature attaining its highest value at the corners. The paraffin appears to first melt at the corners and move upwards, most likely by the action of buoyancy forces (the paraffin is lighter than water). The entire wax layer lifted and migrated upwards. Most of the paraffin ended up inside the cap at the reactor’s ceiling, although a small quantity was trapped at the top corners. Fig. 2 illustrates that with the combined action of surface tension and buoyancy forces and through judicious design of the chamber’s geometry, one can control the migration path of the paraffin.
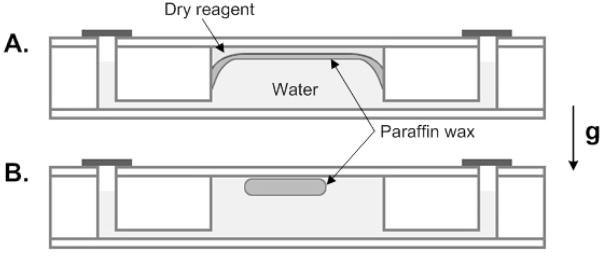
Due to the large difference in dimensions, the process described in Fig. 2 does not represent accurately the actual one that takes place in our PCR reactor. Although we were not able to observe directly the paraffin migration in our PCR reactor, we did monitor the initial and final locations of the paraffin. Fig. 3 is a cartoon of the initial (A) and final (B) positions of the paraffin. The initial and final states are similar to the ones observed in Fig. 2.
Figure 3.
Schematics of (A) the initial and (B) the final position of the paraffin
4. Experimental Set-Up and Materials
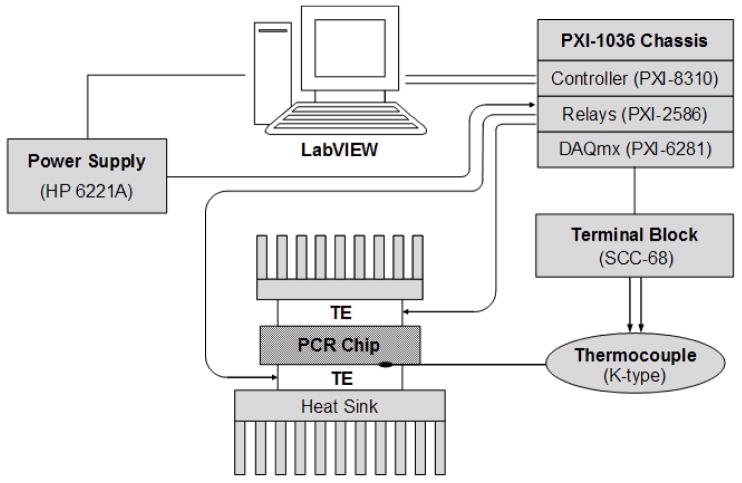
The PCR reactors with preloaded, encapsulated reagents were filled with water containing the nucleic acid target and placed between two thermoelectric (TE) units (Fig. 4). To minimize the temperature gradient across the height of the reactor, we used two TE modules (Melcor, Trenton, NJ), each with its own heat sink – one placed beneath and one above the PCR reactor. The TE modules were powered with a 2-channel, DC power supply (HP 6221A, Agilent Technologies, Inc., Palo Alto, CA). The power supply was connected to the TE units via a relay module (PXI-2586) to facilitate the switching of the power polarity (i.e., alternate between heating and cooling).
Figure 4.
A schematic diagram of the thermoelectric-based, thermocycler setup. The PCR micro reactor is sandwiched between two Peltier units controlled with a LabVIEW™ program.
The thermal cycling was controlled with a LabVIEW™ (National Instruments, Austin, TX) program through a PXI control module (PXI-8310). A K-type thermocouple (75 μm, Omega Engineering, Inc.) placed between the bottom TE and the PCR reactor was connected to the terminal block (SCC-68) which, in turn, interfaced with a NI data acquisition card (PXI-6281).
The temperature acquired with the thermocouple was used as the feedback signal for the PID controller programmed in LabVIEW™. Half the output value of the PID control loop was sent to each channel of the power supply. In other words, the same amount of power was supplied to the bottom and top TE units. The controller applied constant (100%) power during the ramping period. Three different PID gains corresponding to each step of a cycle were employed when the temperature approached the prescribed, set temperatures.
In the course of the controller design, we used a PCR chip equipped with embedded thermocouples to correlate the external thermocouple readings with those of the internal thermocouples. Once the system had been calibrated, the thermocycler did not require the insertion of a thermocouple inside the reactor.
To prepare the PCR mix, we used Illustra PuRe Taq Ready-To-Go PCR beads (GE Healthcare, Piscataway, NJ) containing 2.5 units of DNA polymerase, 10 mM Tris-HCl, 50 mM KCl, 1.5 mM MgCl2, 200 μM dNTPs, carbohydrate stabilizers, and BSA. Since the beads do not contain primers, it was necessary to dissolve the beads and add the primers.
For a 30μl reaction chamber, one and a half PCR beads were dissolved in water along with 1μl of PEG 8000 (Sigma Aldrich) and the appropriate primer mix. The mixture was transferred into a well of a SampleGard® 384-well plate (Biomatrica, San Diego, CA), where proprietary preservative was dry-stored. After the preservative dissolved in the mixture, the preservative-PCR mix solution was dispensed into the PCR reactor for drying and subsequent wax passivation as depicted in Fig. 2. The drying was done at room temperature. These are less than ideal conditions and may have resulted in some loss of enzyme activity.
Proof of concept experiments were carried out with lambda DNA, about 48kb in length (Takara Bio, Inc., Shiga, Japan). Primer Mixture-A (20 μM each) was included in the dry, encapsulated reagents. The sample consisted of lambda DNA dissolved in water. The amplicon was approximately 1kb. The control tests were carried out with liquid reagents.
Subsequent to sample introduction, the access holes were sealed with AlumaSeal II foil (Excel scientific, Wrightwood, CA). The PCR chip was heated and cooled with two thermoelectric (TE) units. To reduce contact resistance between the PCR chip and the TE surfaces, thermal compound (Arctic Silver, Inc., Visalia, CA) was applied at the interface between the TE surface and the chip.
The thermal cycling was performed by an initial denaturing step at 94°C for 1min followed by 30 cycles (denaturation: 94°C, 20s; annealing: 60°C, 20 s; extension: 72°C, 40s), with a final extension at 72°C for 5min. The thermal cycling time was not optimized and can potentially be significantly shortened.
5. Results and Discussion
Since precise temperature control is critical for satisfactory performance of the PCR reactor, we invested some effort to determine the thermal characteristics of the reactor. Subsequently, a sequence of experiments was carried out with different concentrations of target DNA to prove that the concept of pre-stored, paraffin-encapsulated reagents is, indeed, viable.
5.1 Are two better than one?
We compared the performance of PCR reactors operating with one and two TE units. Two thermocouples were embedded inside the PCR chamber. One thermocouple was positioned at the center of the chamber’s floor and the other at the center of the chamber’s ceiling.
In the first set of experiments, the chip was cycled with its bottom side attached to the TE unit and its top side exposed to the ambient. The chip’s bottom layer (layer I in Fig. 1B) was 250μm thick, and the PCR chamber was 750μm high. To examine the thermal performance, the controller was programmed to maintain the chamber’s temperature at 94°C, 60°C, and 72°C for 45s each. When the set temperatures were 94°C, 60°C, and 72°C, the steady-state temperature differences between the bottom and the top were, respectively, 1.9°C, 0.8°C, and 1.2°C. The one-sided heating mode yielded ramp rates of about 2.9°Cs−1 (based on the time needed to achieve 95% of the prescribed temperature change).
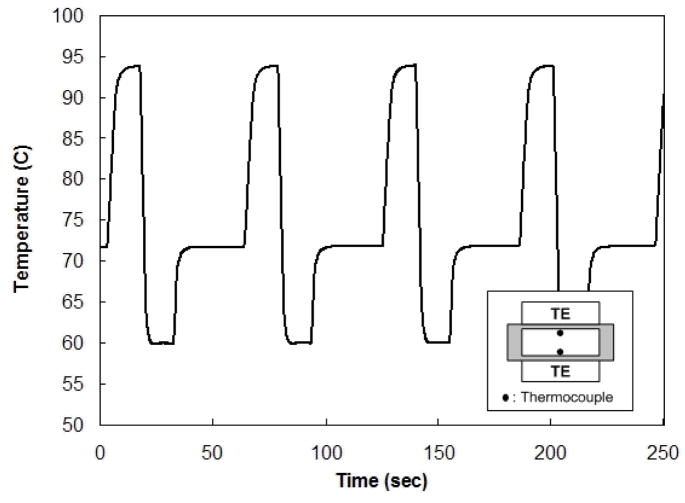
To improve the chamber’s thermal performance, we engaged two TE units – one at the bottom and one at the top (Fig. 4) - and reduced the thickness of the bottom polycarbonate layer (layer I in Fig. 1) to 125μm. Fig. 5 depicts the bottom (solid line) and top (dashed line) temperatures as functions of time. The pre-set cycling conditions comprised denaturation at 94°C for 15s, annealing at 60°C for 15s, and extension at 72°C for 30s. As is evident from Fig. 5, there was no significant difference between the bottom and top temperatures; the two curves nearly overlapped each other. The heating and cooling rates were, respectively, about 7.5°C s−1 and 9.3°C s−1 (based on the time needed to achieve 95 % of the prescribed temperature variation).
Figure 5.
The bottom (solid line) and top (dashed line) temperatures as functions of time during the cycling process when the reactor is controlled with two Peltier units
The thermal response of the reactor with the dual-TE arrangement exhibited significant improvement over the single TE mode.
5.2 The effect of the paraffin layer on the temperature distribution
Due to differences in specific heat and thermal conductivity between the paraffin and the water, the presence of the paraffin in the PCR reactor may adversely affect the temperature distribution. We evaluated the effect of the paraffin layer theoretically by solving a one-dimensional conduction equation. Since the heat transfer by pure conduction is slower than convection and since natural convection is likely to reduce temperature gradients, we stipulate that the calculations presented here provide a worse case scenario.
The one-dimensional mathematical model consists of the bottom PC layer (layer I in Fig. 1B), water, paraffin, and the top PC layer (layer III in Fig. 1B) in the direction of the x-axis. The temperature distribution in layer (i) is given by the dimensionless heat equation
| (1) |
where is the time constant of the water layer; ρ is the density; C is the specific heat;θ= (T−T∞)/(Tk−T∞) and T are, respectively, the dimensional and dimensionless temperatures; t is the dimensionless time; H is the layer’s height; and λ is the thermal conductivity. The subscripts i = B, W, P, and T denote, respectively, the bottom polycarbonate layer, the water layer, the paraffin layer, and the top polycarbonate layer. Witness that x is normalized in each layer with the specific layer’s thickness.
The initial condition is:
| (2) |
The top and bottom boundary temperatures are prescribed as functions of time:
| (3) |
At the interfaces between the layers, we require temperature and heat flux continuity:
| (4) |
The density, specific heat, and thermal conductivity of the molten paraffin27 are, respectively, 760 kg m−3, 2.51 kJ kg−1K−1, and 0.24 W m−1K−1. The time constant associated with the water layer (in the absence of the wax) is (ρW = 995 kg m−3, CW = 4.18 kJ kg−1 K−1, λW = 0.628 W m−1K−1). Since the time constants associated with the polycarbonate layers and the thin paraffin layer are much smaller than the time constant of the water layer, the thermal processes in these layers are approximately quasi-steady and we would expect nearly linear temperature profiles in the polycarbonate and paraffin layers.
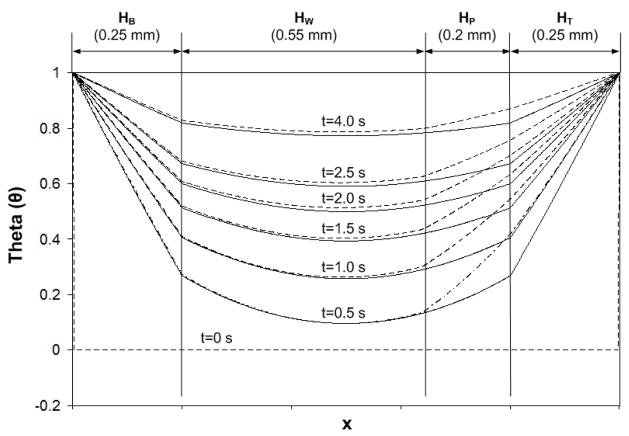
We solved the heat equation numerically with 600 finite elements. Fig. 6 depicts the instantaneous dimensionless temperature distribution θ as a function of spatial location at various times t=0, 0.5, 1, 1.5, 2, 2.5 and 4s when HB=250μm and HT=250μm. Initially, θ (x,0)=0, and both boundaries are maintained at θ=1. The solid line and dashed line correspond, respectively, to {HW, HP}={750μm, 0} (no paraffin) and {550μm, 200μm} (paraffin layer is present). Fig. 6 illustrates that, although the presence of the paraffin alters somewhat the temperature distribution inside the reactor, most of the effect is confined to the region occupied by the paraffin. We also note that the temperature distribution in the actual reactor is likely to be more uniform than the theoretical predictions due to the presence of convection.
Figure 6.
Instantaneous, dimensionless temperature distribution along the reactor’s height at various times t = 0, 0.5, 1, 1.5, 2, 2.5 and 4 s in the absence (solid line) and presence (dashed line) of a paraffin layer. The subscripts B, W, P, and T denote, respectively, the bottom polycarbonate layer, the water layer, the paraffin layer, and the top polycarbonate layer.
5.3 DNA Amplification
To prove the concept of a PCR reactor with pre-stored, encapsulated reagents, we carried out a sequence of PCR amplification experiments with solutions of lambda DNA suspended in water at various concentrations. As a control, we carried out PCR amplification in the traditional way with wet reagents in one of our polycarbonate reactors. The PCR products were detected with agarose gel electrophoresis (1.5 %, EtBr stained).
To check whether the paraffin all by itself may adversely affect the amplification process, we deposited a paraffin layer in the PCR chamber in the same way as we would deposit paraffin for the reagents’ storage, but without any reagents. The reagents were added to the reactor in wet form. The PCR products from the reactor with the paraffin patch and the PCR reactor without the paraffin patch yielded gel electrophoresis bands with nearly identical intensity (not shown). Hence, we conclude that the paraffin has no adverse effect on the amplification process.
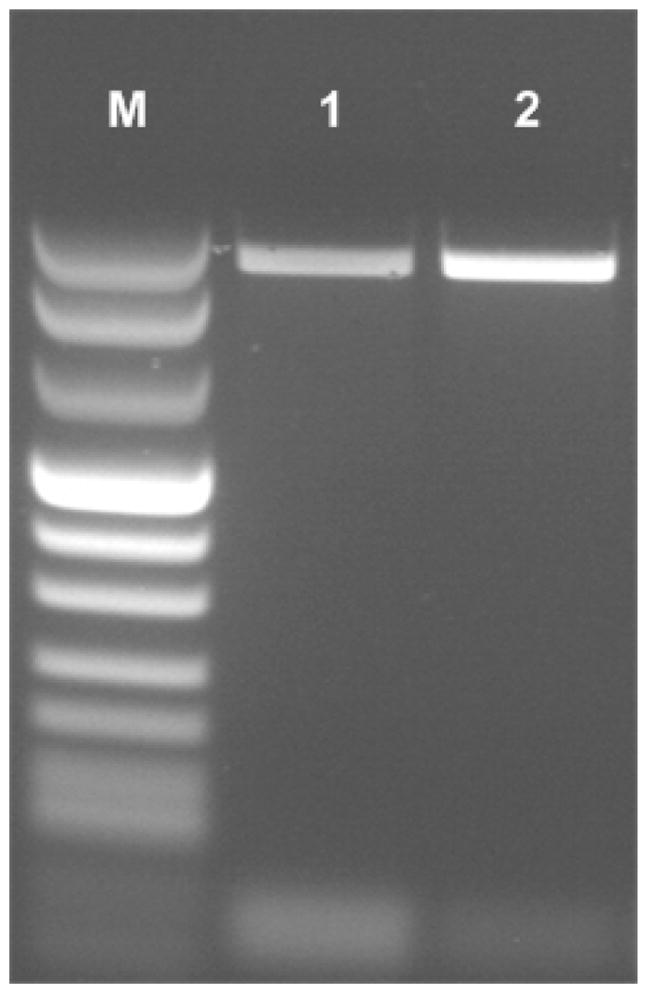
Next, we carried out a sequence of experiments with pre-stored, encapsulated reagents and DNA varying in mass from 10pg to 10fg (~200 copies). All the experiments were repeated at least three times. In parallel, we carried out PCR in the polycarbonate reactor using wet reagents. In one chip, we inserted the same amount of target DNA as in the chip with the dry stored reagents (positive control). In the other chip, we inserted a sample without any target DNA (negative control). A sample of gel images of the amplicons obtained after 35 cycles with the wet reagents and the paraffin-encapsulated reagents is shown in Fig. 7. The amplicon’s size is about 1kb. Lane M is a marker VIII ladder. Lanes 1 and 2, correspond, respectively, to the products of the reactor with the paraffin-encapsulated, dry-stored reagents and the reactor with the wet reagents. The negative control (image not shown) yielded no bands.
Figure 7.
Agarose gel (1.5 %) electrophoresis images of PCR products amplified from a 10fg lambda DNA template. All the PCR amplifications were carried out in the polycarbonate reactor (35 cycles). Lane M is a marker VIII ladder. Lanes 1 and 2 correspond, respectively, to the products of the PCR reactor with the paraffin-encapsulated reagents and the PCR reactor operating with wet reagents.
After correcting for the background light emission, we used the marker band’s intensity to generate a molecular mass standard curve. The curve was then used to estimate the mass of the PCR amplicons. The mass of the PCR products from the reactor with the paraffin encapsulated reagents was about 71±7% (n=3, standard deviation) of the product’s mass from the reactor operating with wet reagents. We suspect that the slightly lower efficiency of the reactor with the encapsulated reagents was because we used room air to dry the reagents in a relatively lengthy process, which may have adversely affected enzyme activity. It is likely that more sophisticated drying techniques such as freeze-drying would improve our PCR reactor’s yield. But, even if this were not the case, the simplification in the chip’s operation offered by the paraffin-encapsulation paradigm outweighs, in many cases, the small reduction in PCR efficiency.
Since paraffin storage is a known concept, we have not carried out a careful study of the shelf-life of the paraffin-encapsulated reagents. We did, however, store a few chips with preloaded, paraffin encapsulated reagents at room temperature and without any humidity control, for one and five months. At the end of the periods, the PCR chambers with the preloaded reagents were tested and yielded amplified products.
6. Conclusions
We describe a self-contained, polycarbonate PCR chip with paraffin-passivated, dry pre-stored reagents. The reagents can be either pre-stored in the PCR chamber prior to the chip assembly (as described in this paper) or encapsulated outside the chip and inserted after completion of the chip fabrication process.
The PCR chip was thermally controlled with a pair of Peltier units using a LabVIEW™ control program. The use of two Peltier units (instead of one) and the thermal guards improved the temperature uniformity in the PCR chamber and reduced the time constant of the system.
The experiments indicate that the presence of the paraffin in the PCR chamber has no adverse effect on the amplification efficiency. Once the paraffin melts, buoyancy and surface tension forces drive the paraffin “out of the way,” facilitating the release and hydration of the PCR reagents. The PCR reactor operated successfully with paraffin-encapsulated, pre-stored reagents, facilitating the detection of 10fg of lambda DNA template. It is likely that better results could be achieved with further optimization and through the use of more sophisticated drying methods for the reagents such as freeze drying. The concept described here can be extended to include the use of paraffins with different melting temperatures for controlled release of reagents at different operating temperatures.
Pre-storage of the reagents in the PCR chamber greatly simplifies the design and flow control of lab-on-chip devices and is an important step in the construction of a fully integrated, self-contained, single-chamber microfluidic unit that facilitates lysis, nucleic acid isolation, amplification, and detection in a single chamber.
Supplementary Material
Acknowledgments
We are grateful to Drs. Xianbo Qiu and Dafeng Chen for helpful discussions. This work was supported, in part, by NIH Grant U01DE017855 to the University of Pennsylvania and by the Institute for Translational Medicine and Therapeutics (ITMAT).
References
- 1.Holland CA, Kiechle FL. Curr Opin Microbiol. 2005;8:504–509. doi: 10.1016/j.mib.2005.08.001. [DOI] [PubMed] [Google Scholar]
- 2.Malamud D, Bau H, Niedbala S, Corstjens P. Adv Dent Res. 2005;18:12–16. doi: 10.1177/154407370501800104. [DOI] [PubMed] [Google Scholar]
- 3.Inganäs M, Derand H, Eckersten A, Ekstrand G, Honerud AK, Jesson G, Thorsen G, Söderman T, Andersson P. Clin Chem. 2005;51:1985–1989. doi: 10.1373/clinchem.2005.053181. [DOI] [PubMed] [Google Scholar]
- 4.Yager P, Edwards T, Fu E, Helton K, Nelson K, Tam MR, Weigl BH. Nature. 2006;442:412–418. doi: 10.1038/nature05064. [DOI] [PubMed] [Google Scholar]
- 5.Herr AE, Hatch AV, Throckmorton DJ, Tran HM, Brennan JS, Giannobile WV, Singh AK. Proc Natl Acad Sci. 2007;104:5268–5273. doi: 10.1073/pnas.0607254104. [DOI] [PMC free article] [PubMed] [Google Scholar]
- 6.Linder V. Analyst. 2007;132:1186–1192. doi: 10.1039/b706347d. [DOI] [PubMed] [Google Scholar]
- 7.Wilding P, Shoffner MA, Kricka LJ. Clin Chem. 1994;40:1815–1818. [PubMed] [Google Scholar]
- 8.Belgrader P, Benett W, Hadley D, Richards J, Stratton P, Mariella R, Jr, Milanovich F. Science. 1999;284(5413):449–450. doi: 10.1126/science.284.5413.449. [DOI] [PubMed] [Google Scholar]
- 9.Neuzil P, Zhang C, Pipper J, Oh S, Zhuo L. Nucleic Acids Res. 2006;34(11):e77. doi: 10.1093/nar/gkl416. [DOI] [PMC free article] [PubMed] [Google Scholar]
- 10.Kopp MU, De Mello AJ, Manz A. Science. 1998;280:1046–1048. doi: 10.1126/science.280.5366.1046. [DOI] [PubMed] [Google Scholar]
- 11.Easley CJ, Karlinsey JM, Landers JP. Lab Chip. 2006;6:601–610. doi: 10.1039/b600039h. [DOI] [PubMed] [Google Scholar]
- 12.Rodriguez I, Lesaicherre M, Tie Y, Zou Q, Yu C, Singh J, Meng LT, Uppili S, Gopalakrishnakone P, Selvanayagam ZE. Electrophoresis. 2003;24:172–178. doi: 10.1002/elps.200390010. [DOI] [PubMed] [Google Scholar]
- 13.Krishnan M, Burke DT, Burns MA. Anal Chem. 2004b;76(22):6588–6593. doi: 10.1021/ac0488356. [DOI] [PubMed] [Google Scholar]
- 14.Neuzil P, Pipper J, Hsieh TM. Mol BioSystems. 2006;2:292–298. doi: 10.1039/b605957k. [DOI] [PubMed] [Google Scholar]
- 15.Xiang Q, Xu B, Fu R, Li D. Biomed Microdevices. 2005;7:273–279. doi: 10.1007/s10544-005-6069-8. [DOI] [PubMed] [Google Scholar]
- 16.Marcus JS, Anderson WF, Quake SR. Anal Chem. 2006;78:956–958. doi: 10.1021/ac0513865. [DOI] [PubMed] [Google Scholar]
- 17.Yao L, Liu B, Chen T, Liu S, Zou T. Biomed Microdevices. 2005;7:253–257. doi: 10.1007/s10544-005-3999-0. [DOI] [PubMed] [Google Scholar]
- 18.Giordano BC, Ferrance J, Swedberg S, Huhmer AF, Landers JP. Anal Biochem. 2001;291:124–132. doi: 10.1006/abio.2000.4974. [DOI] [PubMed] [Google Scholar]
- 19.Yang J, Liu Y, Rauch C, Stevens RL, Liu RH, Lenigk R, Grodzinski P. Lab Chip. 2002;2:179–187. doi: 10.1039/b208405h. [DOI] [PubMed] [Google Scholar]
- 20.Chen Z, Wang J, Qian S, Bau HH. Lab Chip. 2005;5:1277–1285. doi: 10.1039/b508275g. [DOI] [PubMed] [Google Scholar]
- 21.Wang J, Chen Z, Corstjens PLAM, Mauk MG, Bau HH. Lab Chip. 2005;6:46–53. doi: 10.1039/b511494b. [DOI] [PubMed] [Google Scholar]
- 22.Blatt JM, Allen MP, Baddam S, Chase CL, Dasu BN, Dickens DM, Hardt SJ, Hebert RT, Hsu Y, Kitazawa CT, Li S, Mangan WM, Patel PJ, Pfeiffer JW, Quiwa NB, Scratch MA, Widunas JT. Clin Chem. 1998;44(9):2051–2052. [PubMed] [Google Scholar]
- 23.Weigl BH, Gerdes J, Tarr P, Yager P, Dillman L, Peck R, Ramachandran S, Lemba M, Kokoris M, Nabavi M, Battrell F, Hoekstra D, Klein EJ, Denno DM. Proc SPIE. 2006;6112:1–11. [Google Scholar]
- 24.Brivio M, Li Y, Ahlford A, Kjeldsen BG, Reimers JL, Bu M, Syvänen A-C, Bang DD, Wolff A. μTAS 2007. Paris, France: 2007. pp. 59–61. [Google Scholar]
- 25.Rey L, May JC. Freeze-drying/lyophilization of pharmaceutical and biological products. Marcel Dekker; New York: 1999. [Google Scholar]
- 26.Chou Q, Russell M, Birch DE, Raymond J, Bloch W. Nucleic Acids Res. 1992;2:180–181. doi: 10.1093/nar/20.7.1717. [DOI] [PMC free article] [PubMed] [Google Scholar]
- 27.Sheikh AH, Eftekhar J, Lou DYS. AIAA 82-0846, AIAA/ASME 3rd Joint Thermophysics, Fluids, Plasma and Heat Transfer Conference. St Louis; Missouri, USA: 1982. [Google Scholar]
Associated Data
This section collects any data citations, data availability statements, or supplementary materials included in this article.


