

Abstract
We use a parallel frequency-domain optical coherence tomography (FDOCT) system to generate a scatter-mode image of the hamster cheek pouch epithelium. To our knowledge, this is the first optical coherence tomography (OCT) image of a biological sample obtained using a thermal light source in the frequency domain. The system employs an imaging spectrometer to acquire depth-resolved profiles from adjacent spatial points without the need for any scanning. To enable this imaging modality, we have considered that signals originating from multiple depths combine in a different manner in FDOCT compared to time-domain optical coherence tomography (TDOCT). Because a multicomponent FDOCT signal is a coherent sum, it is necessary to limit the number of modes that contribute to the detected signal. Conversely, multicomponent TDOCT signals can be represented as incoherent sums, where increasing the number of modes improves the signal.
Since its introduction in 1991, optical coherence tomography (OCT) has been demonstrated as an excellent modality for performing fast cross-sectional imaging of biological samples with high resolution and high sensitivity [1]. While the bulk of OCT systems have employed a laser or superluminescent diode (SLD) light source, as an alternative, thermal light sources offer the advantage of a significantly larger spectral bandwidth centered at a lower wavelength, enabling superior depth resolution. Thermal light sources can also provide access to spectral windows that are not readily available using coherent sources.
OCT with a thermal light source has been previously demonstrated in both the time and frequency domains [2,3], but to this point OCT images of biological samples using a thermal source have only been demonstrated using time domain optical coherence tomography (TDOCT) [4]. In this Letter, we present our parallel frequency domain optical coherence tomography (FDOCT) system that uses a thermal light source and operates in scatter mode, an imaging geometry designed to enhance detection of scattered light over reflected light. This enables spectral analysis of scattering media using coherence gating, which has been a topic of recent interest, initiated by Fourier domain low coherence interferometry [5,6]. To justify the design of this system, we examine the fact that multicomponent signals combine differently in FDOCT compared to TDOCT by analyzing the Wigner time-frequency distributions of the detected signals. We also present a parallel FDOCT image of the ex vivo hamster cheek pouch. To our knowledge, this is the first image of biological tissue collected with FDOCT using a thermal light source.
The parallel FDOCT system, shown in Fig. 1, is based on a 4f interferometer [7]. A similar system was used by Grajciar et al. [3] to execute parallel OCT but used a cylindrical lens between lenses L1 and L2 to focus the light in one dimension. White light from a Xe arc lamp (150 W, Newport) is coupled to a 200 μm core multimode fiber. The output of the fiber is collimated by lens L1 before entering the 4f interferometer formed by lenses L2, L3, L4, and L5 along with the beam splitter (BS). The light is separated by BS into two beams that are incident upon a reference mirror and the experimental sample, respectively. Light scattered by the sample is recombined with the reference signal by BS and reimaged onto the detection plane by the 4f imaging system formed by lenses L3 and L5. The detection plane coincides with the entrance slit of an imaging spectrometer (Shamrock 303i, Andor Technology), which spatially resolves and spectrally disperses 256 detection channels.
Fig. 1.

Schematic of the parallel FDOCT system using a xenon arc-lamp source.
Unlike most TDOCT or FDOCT systems, the sample arm of the presented system was designed to operate in “scatter mode.” The light incident on the sample is collimated rather than focused, and the sample is tilted such that reflected light is not directed back to the beam splitter. Instead, only light backscattered by the sample is collected by lens L3 and mixed with the reference field at BS. This adjustment of sample arm geometry allows for the analysis of scattering media by avoiding saturation of the detector pixels by the large surface reflections. This reflection can be orders of magnitude greater than the signal originating from deeper tissue layers.
To obtain scatter-mode images in the frequency domain with a thermal source, it is necessary to limit the number of modes that contribute to each detected signal. Here each mode is considered to span an area given by the square of the transverse coherence length. We limit the contributing modes by spatially resolving the detected signal by coherence area at the detection plane using the system shown in Fig. 1. Such resolution by spatial mode is not necessary in TDOCT, as the signals combine in a different manner. We will examine this difference by analyzing the detected signals in the time and frequency domains using the Wigner time–frequency distribution [8].
For an interference signal, the Wigner distribution (WD) of the total electric field (ET = ES + ER) can be represented as the sum of the WD of the sample (ES) and reference fields (ER), along with that of the cross terms representing the interference between them: WT = WR + WS + Wcross.
If we consider a sample field of n components, the Wigner function for the total field will consist of the sum of the WD of the reference field, n sample WDs (which we combine into WS), and the WDs of the n cross terms between the reference field and each component of the signal field: .
To examine the differences between FDOCT and TDOCT we need to consider the interference information that is contained in the WDs of the cross terms. In the frequency domain, our detected signal is the frequency marginal of the WD
| (1) |
Here a is the temporal coherence length of the source, ωo is the center frequency, and Tn is the time delay of the nth component of the signal field relative to the reference field. The result is a sum of truncated cosine terms. Because these terms add coherently, phase differences between terms will reduce the fringe visibility. In OCT, reduced fringe visibility equates to degradation of depth scan signal strength.
Alternatively, in the time domain the detected signal is a function of the time delay or path-length difference between the sample and reference fields. Each point of the detected signal is the time-averaged time marginal of the WD. Here we have taken the power spectrum of the signal by including both the in-phase (cos) and out-of-phase (sin) quadratures:
| (2) |
The result of this calculation is a sum of Gaussian functions of Tn, the time delay. Each Gaussian pulse represents the power contained in the interference signal due to the nth field component. Unlike the coherent sum of energy signals in the frequency domain [Eq. (1)], the power signals in the time domain sum incoherently and are less vulnerable to phase differences between field components. As we will show, in FDOCT the resolution of the detected signal by mode is critical in minimizing the destructive effects of phase differences between field components on the coherent sum of energy signals.
To demonstrate, we will analyze data acquired using the experimental system shown in Fig. 1 with a scattering standard as the sample. The randomly changing phase differences between the n components of the signal field provide a good basis for the demonstration of coherent and incoherent summation of the signal components.
Figure 2(a) shows the raw spectra collected by the imaging spectrometer for the scattering sample. The random phases of the interference fringes occur as a result of the random location of scatterers within the sample. Figure 2(b) shows depth scans generated by taking the magnitude of the Fourier-transformed wavenumber spectra. In the case of the solid curve, the raw spectra from the different spatial points were summed together before the Fourier transform was performed. This operation is analogous to a FDOCT detection scheme, which sums many modes at the detection plane. As a result of the coherent sum of the energy signals, the phase differences between the signal components reduce interference efficiency and therefore degrade depth information.
Fig. 2.
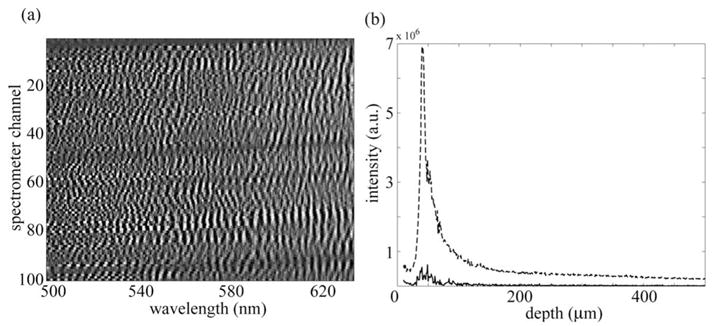
(a) Experimental spectra obtained from a scattering standard sample. (b) Depth scans generated from raw spectra in (a). Depth information is degraded by summing spectra before Fourier transforming (solid curve) but preserved by summing channels after Fourier transforming (dashed curve).
Alternatively, the dashed curve in Fig. 2(b) shows the depth scan generated by summing the information from different spatial points after the individual wavenumber spectra had been individually Fourier transformed. This is analogous to an incoherent sum where the power from each coherence channel is combined. By utilizing the imaging spectrometer to maintain the spatial resolution of the sample field in the detected signal, the individual energy signals maintain their interference efficiency. A summed depth scan is obtained by first transforming the cosines so that the signals add incoherently without degrading the depth information.
Figure 3 shows a scatter-mode image of the hamster cheek pouch epithelium obtained from the presented parallel FDOCT system with a thermal light source. The presented image contains the average of 25 successive scans to improve the signal-to-noise ratio (SNR). The image was obtained without the need for scanning a reference mirror or spatially scanning the light beam on the sample. The image shows several tissue layers as well as folds at points where the sample, which was not stretched, did not adhere to the sample coverglass. To our knowledge, this is the first OCT image of a biological sample collected in the frequency domain using a thermal light source.
Fig. 3.

Parallel FDOCT image of a hamster cheek pouch: E, squamous epithelium; M, mucosa; S, submucosa; and F, tissue fold. Scale bars correspond to 50 μm vertically and 125 μm horizontally.
The ultrabroad bandwidth and low center wavelength of the thermal light source yields a theoretical axial resolution of 1.03 μm, which is comparable to today’s best ultrahigh resolution TDOCT and FDOCT systems. The experimental depth resolution of the system was determined using a mirror for a sample to be 1.22 μm FWHM. The detected spectrum is limited to the 500–625 nm range by the span of the spectrometer when using a 1200 line/mm grating. The high resolution of this grating is necessary to achieve the depth range presented here. The lateral resolution of the system is 26 μm, equal to the width of the detector pixels. This is poorer than many current TDOCT and FDOCT systems, but it is achieved in a single shot, without the need for beam scanning. The SNR of the presented image was determined by a separate experiment to be 89 dB, slightly worse than the SNR of typical coherent-source TDOCT and FDOCT systems.
The above analysis shows that the coherent summation of signals in FDOCT can result in decreased interference efficiency when many modes are present. The parallel FDOCT system referenced above [3] used a cylindrical lens to focus more light on the sample. This serves to add more coherence areas to the detected signal that lowers the interference efficiency. This may be a reason that satisfactory FDOCT images were not obtained using a thermal light source in that work. Instead, a spatially coherent SLD was used to image biological samples with their parallel FDOCT system. The spatial coherence length of light from an SLD can be 1 order of magnitude larger than that from a thermal source. Thus, even when using the cylindrical lens, many fewer modes are combined when using an SLD versus the thermal source. We note that this effect is the exact opposite of that seen with TDOCT, where the incoherent summation results in improved interference efficiency when many modes are combined.
In summary, we have presented a scatter-mode image of epithelial tissue using a parallel FDOCT system with a thermal light source. We are able to observe subsurface scattering by tilting the tissue surface to avoid specular reflection and by limiting the number of modes contributing to each signal channel by resolving the image by coherence area. The summation of signals has been compared for TDOCT and FDOCT based on the Wigner time–frequency distribution. This analysis shows that the two modalities combine signals in a different manner. The coherent summation of signals in FDOCT has the consequence that signal fidelity is reduced as more coherence areas are included. This is in contrast to TDOCT, where the incoherent sum results in an increase in signal fidelity with the inclusion of more coherence areas. These results may lead to new avenues for parallel, scatter-mode FDOCT imaging.
Acknowledgments
We gratefully acknowledge experimental help from Jesse Sandberg and Xiaoxin Chen. This research has been supported by grants from the Coulter Foundation, the National Institutes of Health (NCI R21-CA120128), and the National Science Foundation (BES 03-48204).
Footnotes
OCIS codes: 170.4500, 120.3180, 030.1640.
References
- 1.Huang D, Swanson EA, Lin CP, Schuman JS, Stinson WG, Chang W, Hee MR, Flotte T, Gregory K, Puliafito CA, Fujimoto JG. Science. 1991;254:1178. doi: 10.1126/science.1957169. [DOI] [PMC free article] [PubMed] [Google Scholar]
- 2.Fercher AF, Hitzenberger CK, Sticker M, Moreno-Barriuso E, Leitgeb R, Drexler W, Sattmann H. Opt Commun. 2000;185:57. [Google Scholar]
- 3.Grajciar B, Pircher M, Fercher AF, Leitgeb RA. Opt Express. 2005;13:1131. doi: 10.1364/opex.13.001131. [DOI] [PubMed] [Google Scholar]
- 4.Vabre L, Dubois A, Boccara AC. Opt Lett. 2002;27:530. doi: 10.1364/ol.27.000530. [DOI] [PubMed] [Google Scholar]
- 5.Wax A, Yang CH, Izatt JA. Opt Lett. 2003;28:1230. doi: 10.1364/ol.28.001230. [DOI] [PubMed] [Google Scholar]
- 6.Graf RN, Wax A. Opt Express. 2005;13:4693. doi: 10.1364/opex.13.004693. [DOI] [PMC free article] [PubMed] [Google Scholar]
- 7.Wax A, Yang CH, Dasari RR, Feld MS. Opt Lett. 2001;26:322. doi: 10.1364/ol.26.000322. [DOI] [PubMed] [Google Scholar]
- 8.Graf RN, Wax A. J Opt Soc Am A. 2007;24:2186. doi: 10.1364/josaa.24.002186. [DOI] [PMC free article] [PubMed] [Google Scholar]