

Abstract
Oligomerization of G protein-coupled receptors has been proposed to affect receptor function and regulation; however, little is known about the molecular nature of such complexes. We previously utilized bioluminescence resonance energy transfer (BRET) to demonstrate that the prototypic Family B secretin receptor can form oligomers. We now explore the order of oligomerization present utilizing unique bimolecular fluorescence complementation and energy transfer techniques. The non-fluorescent carboxyl-terminal and amino-terminal halves of yellow fluorescent protein (YFP) were fused to the carboxyl terminus of the secretin receptor. These constructs bound secretin normally and signaled in response to secretin like wild type receptor. When co-expressed on COS cells, these constructs physically interacted to yield typical YFP fluorescence in biosynthetic compartments and at the plasma membrane, reflecting receptor homo-dimerization. However, the addition of another potential partner in form of Rlu- or CFP-tagged secretin receptor yielded no significant BRET or FRET signal, respectively, under conditions in which intact YFP-tagged secretin receptor yielded such a signal. Absence of higher order receptor oligomers was further confirmed using saturation BRET techniques. Absence of significant resonance transfer to the secretin receptor homo-dimer was true for carboxyl-terminally-tagged secretin receptor, as well as for receptor incorporating the transfer partner into each of the three distinct intracellular loop domains. These results suggest that the secretin receptor can exist only as a structurally-specific homo-dimer, without being present as higher order oligomers.
Keywords: Bimolecular fluorescence complementation, bioluminescence resonance energy transfer, fluorescence resonance energy transfer, G protein-coupled receptor, receptor oligomerization, secretin receptor
1. Introduction
Oligomerization has been reported to exist for many guanine nucleotide-binding protein (G protein)-coupled receptors (GPCRs), based on co-immunoprecipitation and resonance energy transfer studies [1]. While these approaches can establish molecular associations, they have typically not distinguished dimers from higher order oligomers. These studies have even been criticized as possibly reflecting random associations of laterally mobile receptors in the plasma membrane or aggregation of receptors, rather than representing distinct, functionally important complexes [2], although this criticism has itself been debated [3]. There is not yet broad agreement regarding when physiologically significant GPCR oligomerization might occur and what its functional impact might be [4].
Current understanding of GPCR oligomerization varies considerably among the major structural groups within this superfamily. Best understood is the smallest group of GPCRs that belong to Family C and have very large extracellular amino-terminal domains. The metabotropic glutamate receptor and the calcium-sensing receptor are known to be present as covalent dimers that form through distinct associations between these domains, as documented by crystal structures [5, 6]. The largest group of GPCRs that belong to Family A have been extensively reported to associate with themselves and with each other, but many questions remain unresolved regarding the nature and functional importance of such complexes [1-4, 7-9]. Understanding of the oligomerization of Family B GPCRs is even more limited, with a relatively small number of reports in the current literature [10-12].
This study focuses on a prototypic Family B GPCR, the secretin receptor. Based on BRET (bioluminescence resonance energy transfer) and FRET (fluorescence resonance energy transfer) studies, this receptor has been reported to be present in the plasma membrane as constitutive homo-oligomers that are not affected by binding agonist ligands [11]. Additionally, the secretin receptor is capable of associating with other members of Family B to form hetero-oligomers [11]. Recent reports examining the molecular basis of secretin receptor oligomerization ruled out contributions of its amino-terminal and carboxyl-terminal tail regions [13], and identified transmembrane segment four of this receptor as an important contributor to its homo-oligomerization [14]. Transmembrane segment four mutants that disrupted secretin receptor oligomerization were shown to be functionally distinct from wild type receptor, having reduced agonist-stimulated cAMP responses [14]. These data suggest the functional importance of secretin receptor oligomeric complexes and the likelihood that these are structurally distinct [14-16].
In the current work, we have utilized bimolecular fluorescence complementation to further characterize the nature of secretin receptor complexes and have defined them to represent receptor dimers, and not higher order oligomers. Such homo-dimeric complexes provide the important potential for allosteric modulation, ligand cooperativity, and differential effects mediated by the primary and secondary protomer [17, 18]. Since Family B GPCRs contain several very important potential drug targets, it will be critical to explore whether this theme is consistent throughout the family and might also be applicable to other structurally-related receptors.
2. Materials and Methods
2.1. Receptor constructs
Tagged human secretin receptor (HSecR) and human Type B cholecystokinin receptor (hCCKBR) constructs were prepared in pcDNA3.0 eukaryotic expression vector. These included receptor constructs with cyan fluorescent protein (CFP), renilla luciferase (Rlu), and yellow fluorescent protein (YFP) or its amino-terminal or carboxyl-terminal fragments, YFP(1-158) (YN) or YFP(159-238) (YC) (kindly provided by Dr. C. Berlot, Geisinger Clinic, Danville, PA), respectively, at the receptor carboxyl terminus. Additional constructs having Rlu inserted into the first (position 513), second (position 735), and third (position 993) intracellular loops of the secretin receptor were also prepared, following the strategy previously utilized to prepare analogous CFP-labeled constructs [19]. Rlu-tagged Gαs was prepared by mutagenesis of Gαs-YFP (also provided by Dr. C. Berlot). All sequences were confirmed by direct DNA sequencing.
2.2. Cell culture and transfections
COS cells were used for the transient expression of secretin receptor constructs for receptor binding, cAMP measurement, immunostaining, BRET and FRET studies. Twenty-four h before transfection, cells were plated in 10 cm tissue culture dishes at a density of 0.5 million cells/dish and cultured in Dulbecco's Modified Eagle's Medium (DMEM) supplemented with 5 % Fetal Clone II (Hyclone laboratories, Logan, UT). Cells were transfected with approximately 3 μg of total DNA per dish using the diethylaminoethyl (DEAE)-dextran method [11]. Assays were performed 48-72 h later. For morphological FRET and immunostaining studies, the transfected cells were lifted and replated onto coverslips 24 h before study.
2.3. Microscopy
Morphologic techniques were utilized to establish correct trafficking of the receptor constructs, as well as their fluorescence characteristics at the plasma membrane. To establish surface expression, we utilized HA-tagged receptor constructs and anti-HA immunofluorescence, as we have described [20]. Transfected COS cells seeded onto 25-mm coverslips were washed with phosphate-buffered saline (PBS) and fixed in 2 % (w/v) paraformaldehyde in PBS for15 min. Non-specific antibody recognition sites were blocked using 1 % (v/v) normal goat serum. Incubations with primary antibody (mouse anti-HA epitope, 1:500) and secondary antibody (Rhodamine Red X-labeled goat anti-mouse antibody, Invitrogen, Carlsbad, CA, 1:500) were carried out in a humidified chamber for 1 h. Cells were then washed three times with PBS before being mounted on a microscopic slide using Vectashield. Immunoreactivity was visualized with a Zeiss LSM 510 confocal microscope (excitation, 543 nm argon laser; emission, LP550 filter; pinhole diameter 2.6 airy units, Plan-Apochromat 63X/1.4NA oil).
Transfected COS cells were also directly evaluated for YFP fluorescence using a Zeiss LSM 510 confocal microscope (Thornwood, NY) with the following settings: excitation, 488 nm argon laser; emission, LP505 filter; pinhole diameter 2.6 airy units, Plan-Apochromat 63X/1.4NA oil. Images underwent background subtraction and were assembled using Adobe Photoshop 7.0 (Mountain View, CA). Fluorescent receptor expression at the cell surface was quantified using Metamorph 6.3 (Molecular Devices, Sunnyvale, CA).
2.4. Receptor binding assays
Secretin receptor binding studies were performed in intact, transfected COS cells. Receptor-expressing COS cells were mixed with 2 pM (125I-Tyr10)secretin-27 radioligand (approximately 20,000 cpm/tube, specific radioactivity 2,000 Ci/mmol) in Krebs-Ringer/HEPES (KRH) medium containing 25 mM HEPES, pH 7.4, 104 mM NaCl, 5 mM KCl, 2 mM CaCl2, 1 mM KH2PO4, and 1.2 mM MgSO4, with 0.01% soybean trypsin inhibitor, 1 mM phenylmethylsulfonyl fluoride, and 0.2 % bovine serum albumin, in the absence or presence of increasing concentrations (0 to 1μM) of unlabeled secretin for 1 h at room temperature. Bound and free radioligand were then separated by centrifugation and repeated washing with ice-cold medium. Receptor-bound radioactivity was quantified using a γ spectrometer. Binding data were analyzed using the LIGAND program [21] and were plotted using the nonlinear least-squares curve-fitting routine in Prism (GraphPad 3.0, San Diego, CA).
2.5. cAMP assays
Agonist-stimulated cAMP accumulation in receptor-bearing COS cells was quantified using the LANCE assay from PerkinElmer (Wellesley, MA), which was performed in 384-well white Optiplates with a 2103 Envision plate reader, as we previously described [14]. COS cells expressing receptor constructs in KRH medium containing 0.2 % bovine serum albumin, 0.01 % soybean trypsin inhibitor, 0.1 % bacitracin, and 1 mM 3-isobutyl-1-methylxanthine were stimulated for 30 min at 37 °C with increasing concentrations of secretin (1pM to 1μM). The incubation was terminated by adding chilled 6% perchloric acid and the pH of the supernatant was adjusted to 6.0 using 30 % KHCO3. Equal volumes of sample (6 μl of cell supernatant) were mixed with Alexa Fluor® 647-labeled cAMP antibodies in KRH medium containing 0.1 % bovine serum albumin and incubated for 30 min at room temperature. The reaction mixture was then mixed with 12 μl of detection mixture containing europium-labeled streptavidin and biotin-cAMP and further incubated for 1 h. Time-resolved FRET signals were measured after excitation at 340 nm, with emission quantified at 615 and 665 nm wavelengths.
2.6. BRET studies
BRET studies were performed using COS cells that had been transfected using 3 μg of receptor DNA per plate, divided equally among two or three constructs for each condition. Assays were performed for aliquots of approximately 25,000 cells per well in 96-well white Optiplates, as described previously [14]. The BRET assay was initiated by adding the cell-permeant Renilla luciferase-specific substrate, coelenterazine h (Biotium, Hayward, CA), to the cell suspension to yield a final concentration of 5 μM. The BRET signal was collected using the 2103 Envision fluorescence plate reader (PerkinElmer, Wellesley, MA) set up with the <700 nm mirror and with emission filter sets for luminescence (460 nm, bandwidth 25 nm) and fluorescence (535 nm, bandwidth 25 nm). The BRET ratio was calculated based on the ratio of fluorescence and luminescence emission [14].
Saturation BRET experiments were performed, as described previously [14]. For these, COS cells were transfected with a fixed amount of Rlu-tagged construct (1.0 μg DNA/dish) and with increasing amounts of YFP-tagged construct (0.3 μg to 6 μg DNA/dish). Assays were performed 48 h after transfection. Fluorescence and luminescence intensities were quantified using specified filter sets in representative aliquots of the same populations of cells utilized in each set of BRET studies. Background-subtracted values were used to calculate the acceptor-donor ratios that were plotted relative to the BRET ratios. Curves were fit to these data and were evaluated for quality-of-fit based on R2 values using Prism 3.0. When a single phase exponential curve was found to represent a significantly better fit than the linear function (F test p value <0.05), it was utilized to calculate the BRETmax and BRET50 values.
Because of the potential impact of high, potentially unphysiologic levels of receptor expression in this type of oligomerization study, we also performed additional saturation BRET studies with low levels of receptor expression, in the physiologic or even sub-physiologic range. In this case, COS cells were transfected with a fixed amount of Rlu-tagged receptor construct (0.05 μg DNA/dish) and with increasing amounts of YFP-tagged receptor construct (0.03 μg to 0.6 μg DNA/dish). Assays were performed 48 h after transfection. Results were plotted as ratios of YFP fluorescence to Rlu luminescence.
2.7.Fluorescence spectroscopy
Steady-state fluorescence intensities were collected in a Fluoromax-3 fluorometer (SPEX industries, Edison, NJ) at 25 °C using a 1 ml quartz cuvette. Fluorescence resonance energy transfer (FRET) data were acquired by excitation at 433 nm with emission collected from 450 nm to 600 nm. YFP fluorescence was quantified from 500 nm to 600nm after excitation at 480nm. Untransfected cells and medium were utilized to correct for background fluorescence. Anisotropy measurements at room temperature were recorded using a Fluoromax-3 fluorometer equipped with an automatic polarizer and a thermostatically-regulated cuvette holder, as we described previously [22].
2.8. Morphological FRET microscopy
Morphological FRET imaging was performed using an Axiovert 200M inverted epifluorescence microscope (Carl Zeiss, Thornwood, NY) having fixed filter set (Chroma Technology Corp., Brattleboro, VT) for CFP (excitation, 436/20 nm; dichroic mirror, 455 dclp; and emission, 480/40 nm), YFP (excitation, 500/20 nm; dichroic mirror, Q515 lp; and emission, 535/30 nm), and FRET (excitation, 436/20 nm; dichroic mirror, 455 dclp; and emission, 535/30 nm), as described previously [11]. Raw images were collected separately for each of the channels with constant exposure times using a monochromatic ORCA-12ER CCD camera (Hamamatsu, Bridgewater, NJ) with automated QED-InVivo 2.039 acquisition software (Media Cybernetics Inc., Silver Spring, MD). Donor and acceptor bleed-through coefficient into the FRET channel were calculated and corrected [11] using the sensitized-emission method provided by Metamorph version 6.3 (Molecular Devices, Sunnyvale, CA). Corrected FRET represents FRETc = FRET-(B*CFP)-(A*YFP) where FRET, CFP, and YFP represent blank (background signal within the respective images)-subtracted images collected in the corresponding channels. B and A are the bleed-through coefficients. Grey scale digital images were background-subtracted and then assembled into figures using Adobe Photoshop 7.0 (Mountain View, CA).
3. Results
3.1. Expression of secretin receptor constructs
Secretin receptor constructs tagged at the carboxyl terminus with YFP or its fragments, YN (YFP(1-158)) and YC (YFP(159-238)), were expressed well in COS cells and trafficked normally to the cell surface. Shown in Figure 1 are images documenting immunolabeling of HA-tagged receptor constructs with these carboxyl-terminal tags appearing at the cell surface. The functional characteristics of these constructs are shown in Figure 2 and quantified in Table 1. They bound secretin normally and had normal cAMP responses to secretin stimulation.
Fig 1.
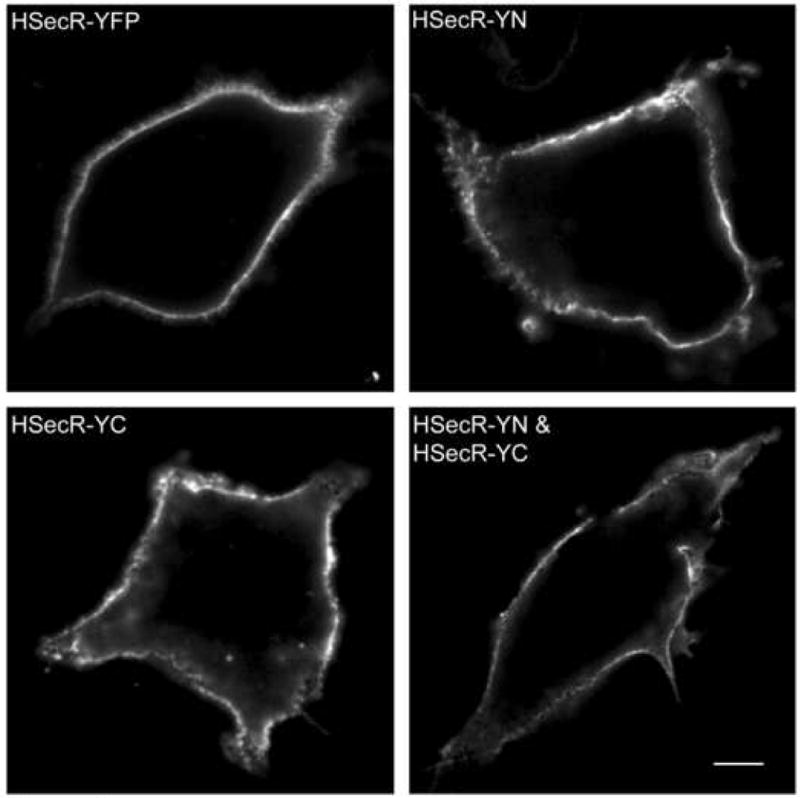
Morphologic localization of YN- and YC-tagged secretin receptor constructs. Shown are representative confocal immunofluorescence images illustrating cell surface localization of HA-tagged secretin receptors expressed on the surface of non-permeabilized COS cells, as indicated. Similar to wild type secretin receptor, the receptor constructs tagged with non-fluorescent YFP fragments were able to traffic normally to the plasma membrane. Bar, 25 μm.
Fig 2.
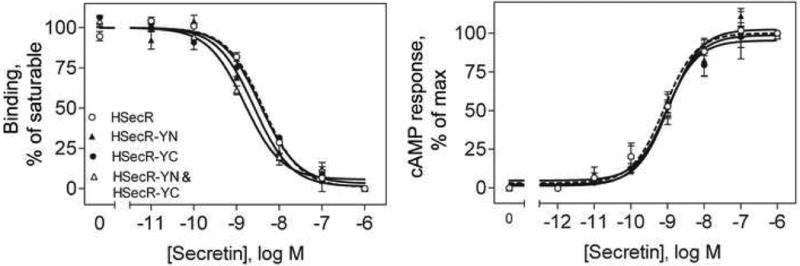
Binding and biological characteristics of tagged secretin receptor constructs expressed on intact, non-permeabilized COS cells. Shown are secretin competition-binding curves (left panel) and secretin-stimulated cAMP responses (right panel) of cells expressing wild type receptor or co-expression of secretin receptors tagged with YN and YC at the carboxyl terminus. See Table 1 quantitative analysis of these data. Data represent means ± S.E.M. of 3 to 4 independent assays performed in duplicate.
Table I. Binding and biological activity characteristics of tagged secretin receptor constructs expressed in intact COS cells.
| Receptor constructs | Ki (nM) | Bmax (×103) sites/cell | cAMP response EC50 (nM) |
|---|---|---|---|
| HSecR-YFP | 3.7 ± 0.4 | 70.7 ± 12.9 | 1.31 ± 0.31 |
| HSecR-YN | 2.5 ± 0.8 | 61.5 ± 21.1 | 1.36 ± 0.37 |
| HSecR-YC | 3.5 ± 0.8 | 81.6 ± 38.5 | 1.27 ± 0.68 |
| HSecR-YN&HSecR-YC | 2.2 ± 0.7 | 67.5 ± 20.7 | 1.20 ± 0.16 |
Data are expressed as means ± S.E.M of values from 3-4 independent experiments performed in duplicate.
3.2. Bimolecular fluorescence complementation evidence of secretin receptor homo-dimerization
Consistent with the previous demonstration of secretin receptor oligomerization using BRET technology, the bimolecular fluorescence complementation approach documented the ability of the non-fluorescent carboxyl-terminal and amino-terminal fragments of YFP attached to secretin receptor constructs to physically interact and to become fluorescent, with characteristics typical of intact YFP. Figure 3 shows confocal images of YFP fluorescence from tagged secretin receptor constructs expressed in COS cells. No fluorescence was observed for either of the YFP fragments expressed alone or for the complementary fragments co-expressed on the cell surface attached to the secretin receptor and to the structurally-unrelated Type B cholecystokinin (CCK) receptor. The complementary fragments of YFP attached to the carboxyl terminus of the human Type B CCK receptor were functionally similar to untagged wild type receptor in regard to agonist-stimulated calcium responses (EC50 values (nM), HCCKBR, 0.54±0.14; HCCKBR-YN, 0.52±0.07; HCCKBR-YC, 0.45±0.06). When the complementary YFP fragments were both attached to secretin receptor constructs, typical YFP fluorescence was observed at the cell surface. It is important to note that this technique was utilized to determine only whether a significant BRET signal above background could be produced, and the intensity of the signal should not be compared with the two molecule BRET studies. This relates to the various combinations of non-productive as well as productive pairings that can occur, with this even more complex in the bimolecular fluorescence complementation experiments, making quantitative comparisons between these techniques problematic. It is also important to recognize that bimolecular complementation may occur co-translationally, and due to the strong energy of association, that this may be functionally irreversible as the dimeric complex traverses the biosynthetic compartments on its way to the plasma membrane. This should not represent a problem in the current studies, since data from studies using intact complementarily-tagged secretin receptor constructs clearly demonstrate an oligomeric state of these constructs at the cell surface.
Fig 3.
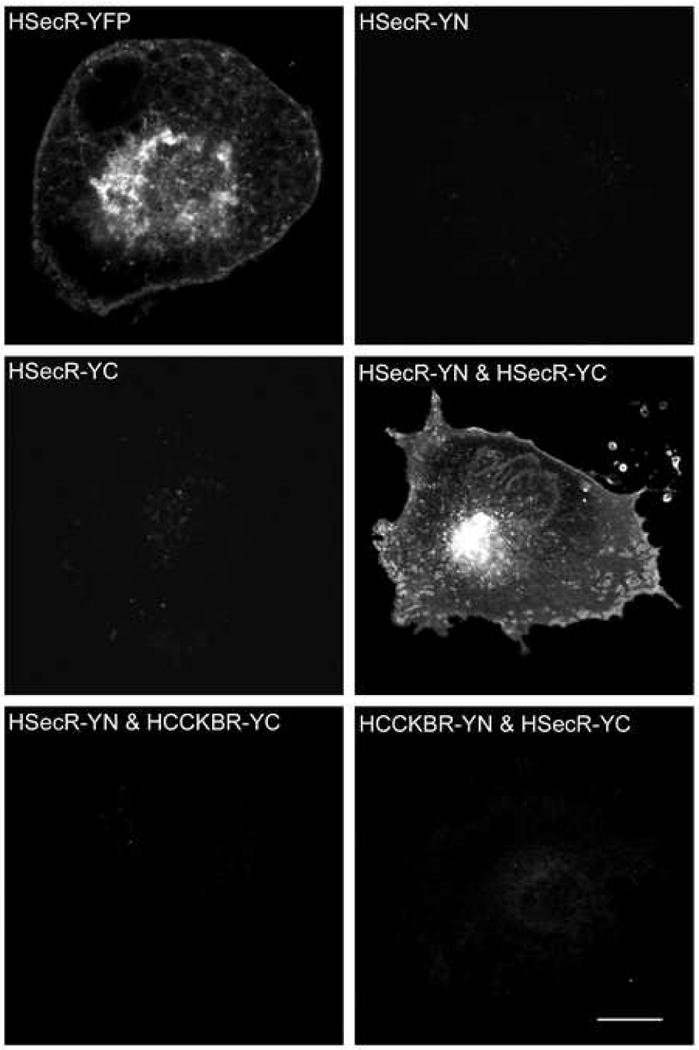
Bimolecular fluorescence complementation. Shown are representative confocal fluorescence images of COS cells expressing various receptor constructs, as indicated. Surface expression of each construct was established by saturable radioligand binding analysis. Images support physical interaction between YN-tagged secretin receptor and YC-tagged secretin receptor, supporting secretin receptor homo-dimerization. Absence of fluorescence when YN and YC were tagged to structurally-distinct receptors that were co-expressed support the structural specificity of the secretin receptor interaction. Bar, 25 μm.
Figure 4 illustrates the fluorescence emission spectra of intact YFP attached to the secretin receptor and YFP reconstituted from its non-fluorescent amino-terminal and carboxyl-terminal fragments attached to secretin receptor constructs that are co-expressed. The background-subtracted fluorescence intensities (× 103) at 525 nm (peak emission) represented 463±24 for HSecR-YFP and 260±11 for the condition in which the amino-terminal and carboxyl-terminal non-fluorescent fragments of YFP attached to the secretin receptor were co-expressed. Fluorescence anisotropy measurements of intact and reconstituted forms of YFP are also shown in Figure 4. These document adequate mobility with sufficient rotational freedom of this fluorescence acceptor for it to be valid in energy transfer studies.
Fig 4.
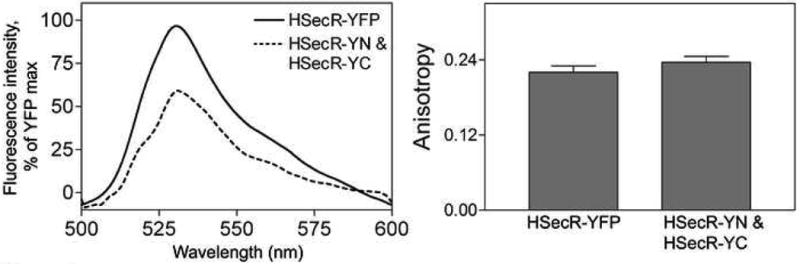
Fluorescence spectra and anisotropy of receptor tagged with fragments of YFP. Shown are fluorescence emission spectra (left panel) and steady state fluorescence anisotropy data (right panel) for intact YFP-tagged secretin receptor and YFP reconstituted from its fragments attached to secretin receptor constructs that were co-expressed in COS cells. The cells were excited at 480 nm and emission was acquired from the region between 500 nm and 600 nm. Data represent means ± S.E.M. of values from four independent experiments performed in duplicate.
3.3. BRET studies of higher order receptor oligomerization
We utilized resonance transfer combined with bimolecular fluorescence complementation to examine whether secretin receptor oligomerization could involve more molecules than the two receptor molecules involved in the complementation studies. In this approach, Rlu (Renilla luciferase)-tagged secretin receptor was utilized as potential donor and YFP reconstituted from its fragments (YN and YC) that were tagged to associated secretin receptor constructs was utilized as acceptor. A positive control represented intact YFP attached to the secretin receptor as acceptor. Figure 5 shows a clear BRET signal between Rlu- and intact YFP-tagged secretin receptors, but absence of a BRET signal when the Rlu-tagged receptor was co-expressed with the pair exhibiting bimolecular fluorescence complementation. To validate the ability to combine bimolecular fluorescence complementation with BRET to demonstrate the interaction of three molecules, we utilized the established association between the secretin receptor and the heterotrimeric G protein, Gαs. The secretin receptor constructs exhibiting bimolecular fluorescence complementation were able to effectively pair with Rlu-tagged Gαs to yield a significant BRET signal in this assay. This was not different from the signal coming from intact YFP-tagged secretin receptor co-expressed with this Rlu-tagged G protein. Of note, no significant BRET signal was observed when the Rlu-tagged Gαs was co-expressed with YFP-tagged human Type B cholecystokinin receptor (a Gq-coupled receptor).
Fig 5.
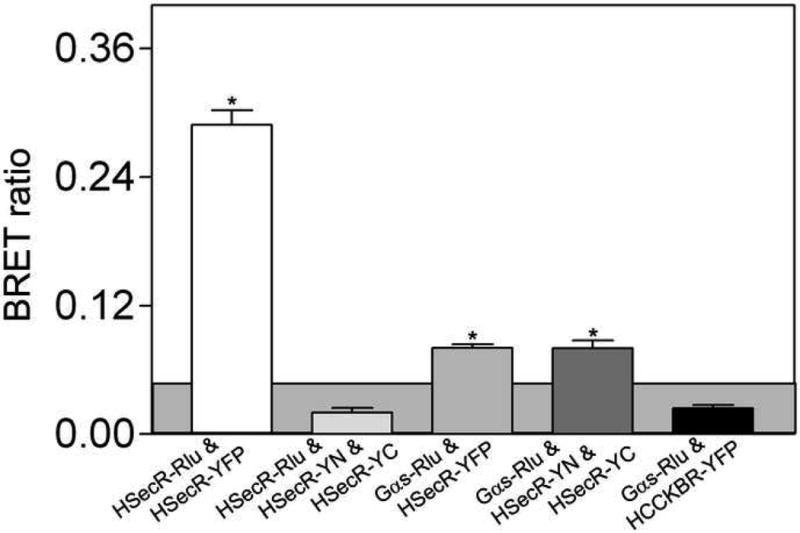
BRET assays. Shown are BRET signals generated from COS cells expressing Rlu-tagged secretin receptor with YFP-tagged or co-expressed YN- and YC-tagged secretin receptor constructs. For each condition, a total of 3 μg of DNA was utilized, divided equally among the noted constructs. Shown also are BRET signals obtained from cells expressing YFP-tagged or YN- and YC-tagged secretin receptor constructs with Gαs-Rlu constructs. As a negative control, the BRET signal between Gαs-Rlu and YFP-tagged Type B cholecystokinin receptor was not found to be significant. The shaded area represents the non-specific BRET signal that can be generated between Rlu-tagged secretin receptor and YFP-tagged structurally-unrelated Type B cholecystokinin (CCKBR) receptor. BRET ratios above this were considered to be significant. Data are presented as means±S.E.M. of five independent experiments. * p<0.05, indicate BRET signals significantly above background.
The static BRET results were confirmed further with saturation BRET experiments (Fig 6). Unlike the intact YFP-tagged secretin receptor co-expressed with the Rlu-tagged receptor that yielded a saturable signal reaching an asymptote, the pair of constructs exhibiting bimolecular fluorescence complementation co-expressed with the Rlu-tagged receptor only generated a linear signal reflecting non-specific bystander interactions [14]. Similarly, the static BRET signal between Rlu-tagged Gαs and YFP-tagged secretin receptor or pairs of constructs exhibiting bimolecular fluorescence complementation generated a saturable BRET signal that reached an asymptote (Fig 6B).
Fig 6.
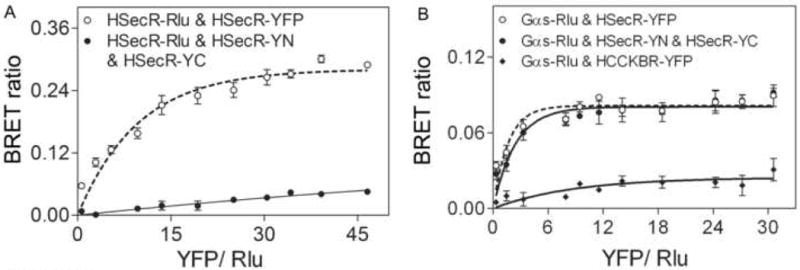
Saturation BRET analysis. Shown in panels A and B are BRET saturation curves plotted as ratios of YFP fluorescence to Rlu luminescence that were obtained using a fixed amount of donor (1.0 μg DNA/dish) and increasing amounts of acceptor (0.3 μg to 6 μg DNA/dish), as indicated. HSecR-Rlu/HSecR-YFP generated an exponential curve that increased until values reached saturation and the HSecR-Rlu/HSecR-YN/HSecR-YC yielded a curve that was not different from a linear fit to the data. Similarly, Gαs-Rlu/HSecR-YFP or Gαs-Rlu/HSecR-YN/HSecR-YC yielded an exponential curve that reached saturation, while the Gαs-Rlu/HCCKBR-YFP condition produced data that was adequately fit to a line. Data are represented as means±S.E.M of four independent experiments. * p<0.05 indicates a BRET signal significantly above background.
We also performed two series of BRET studies with low concentrations of secretin receptor expression to be certain that these receptor association observations would also be relevant to physiologic levels of receptor expression [14]. For these experiments, cell surface receptors were quantified morphologically using densitometric analysis of fluorescence in that compartment representing YFP-receptor expression as shown in Figure 7, as well as by using quantitative secretin radioligand-binding analysis. Indeed, in the range of these experiments, from approximately 500 to 20,000 receptors per cell, the Pearson correlation coefficients clearly demonstrated a linear relationship between the amount of receptor construct DNA utilized and receptor expression, both at the level of cell surface fluorescence and at the level of direct quantitation of binding sites in intact cells. These values were r=0.96, p<0.001 for cell surface fluorescence and r=0.92, p<0.003 for binding sites.
Fig 7.
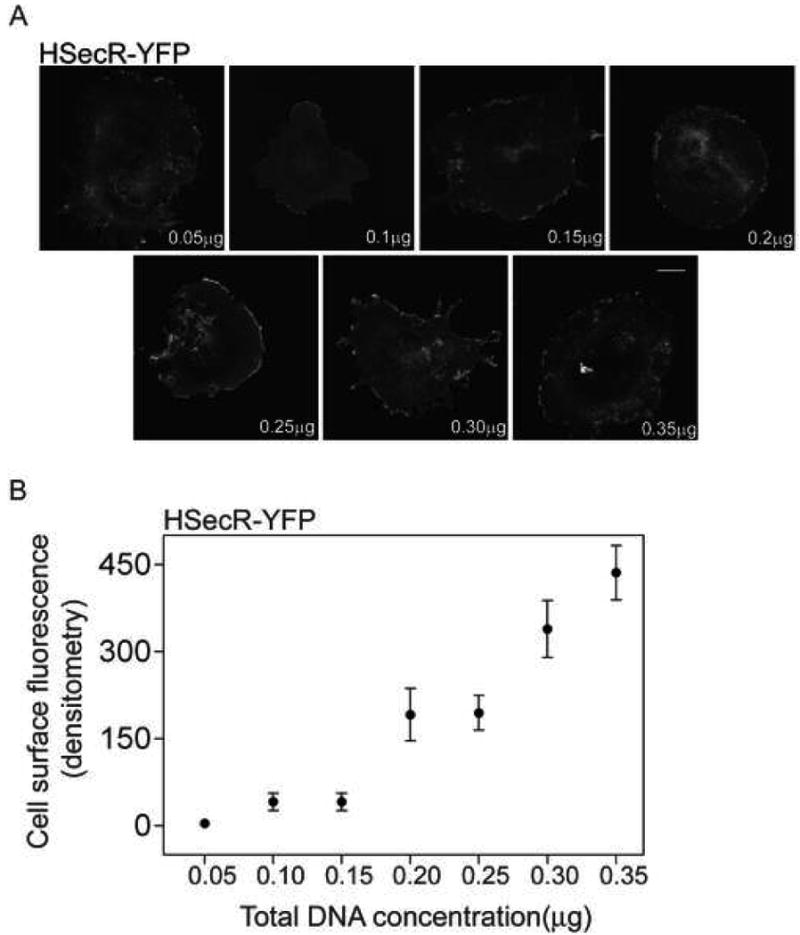
Levels of cell surface expression of secretin receptor. Shown in panel A are representative confocal images of YFP-tagged HSecR (acceptor in BRET studies) revealing increasing levels of receptor expression with increasing amounts of DNA, with the predominant location of receptor on the cell surface. Shown in panel B is the quantitative analysis of the fluorescence signal that represents YFP-tagged receptor at the cell surface in the type of transfection experiment shown in panel A. Levels of receptor expression ranged from approximately 500 sites per cell to 20,000 sites per cell. Data are presented as means±S.E.M of four independent experiments. Bar, 25 μm.
As further evidence for the relevance of these findings to physiologic levels of receptor expression, saturation BRET experiments analogous to those illustrated in Figure 6 were also performed with low levels of receptor expression. In this case, COS cells were transfected with only 0.05 μg Rlu-tagged receptor construct DNA/dish and with 0.03 μg to 0.6 μg YFP-tagged receptor construct DNA/dish. The results of these experiments are shown in Figure 8. These data demonstrate that Rlu- and YFP-tagged secretin receptor constructs yielded a saturable BRET signal that reached an asymptote, while the expression of Rlu-tagged secretin receptor with secretin receptor constructs exhibiting bimolecular complementation yielded only a low level, non-saturable signal.
Fig 8.
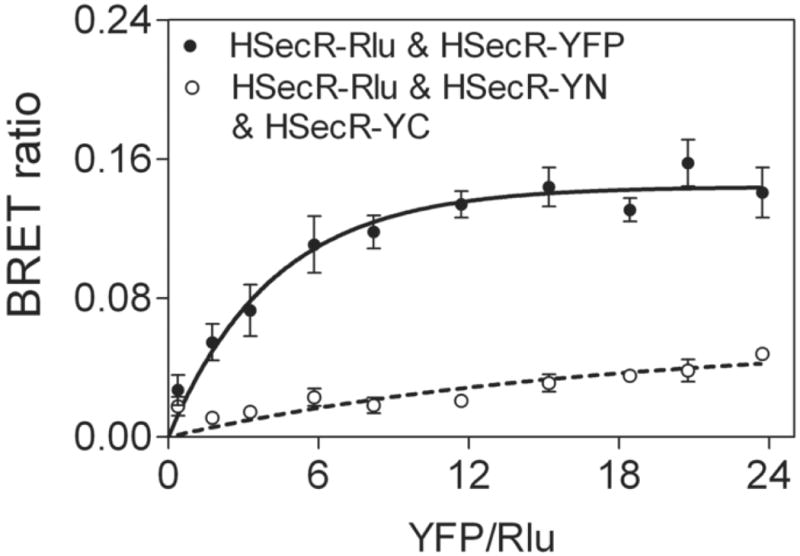
Saturation BRET analysis with sub-physiologic levels of receptor expression. Shown are BRET saturation curves plotted as ratios of YFP fluorescence to Rlu luminescence, utilizing 0.05 μg Rlu-tagged receptor construct DNA/dish and 0.03 μg to 0.6 μg YFP-tagged receptor construct DNA/dish. At levels of donor receptor expression in the range of 500 sites per cell, HSecR-Rlu & HSecR-YFP generated a curve that reached saturation, while the HSecR-Rlu & HSecR-YN & HSecR-YC condition best fit a linear relationship that did not saturate. This is similar to what was observed in Figure 6 under conditions with higher levels of receptor expression. Data are presented as means±S.E.M of four independent experiments.
Because of the possibility of less-than-optimal geometry and/or distances for energy transfer when the donor Rlu was at the carboxyl terminus of the secretin receptor, we also performed analogous studies with secretin receptor constructs in which the Rlu was inserted into each of the three distinct intracellular loop regions of that receptor. Similar to the carboxyl-terminal location, none of the loop constructs yielded a significant BRET signal with the pair of secretin receptor constructs exhibiting bimolecular fluorescence complementation (Fig 9).
Fig 9.
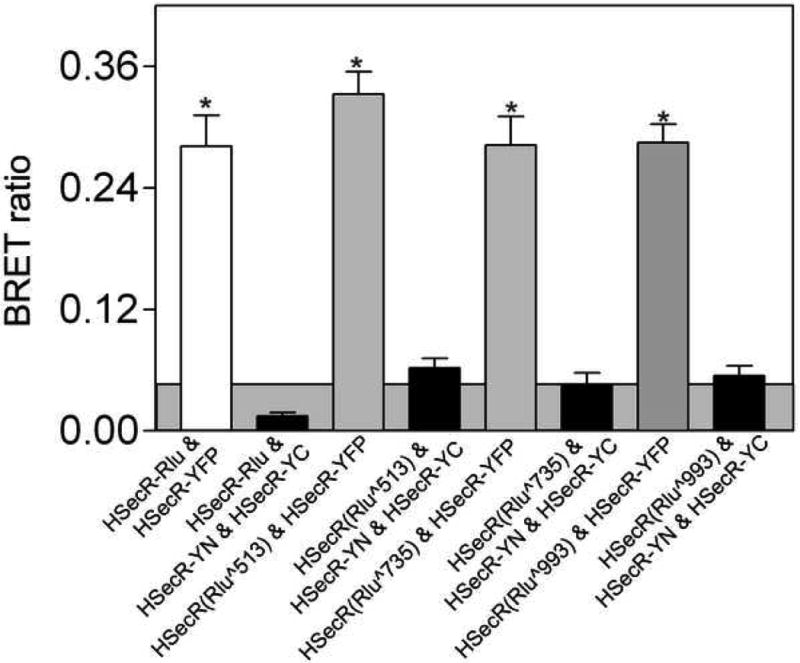
BRET studies utilizing varied positions of the donor. Shown are the BRET signals generated with donor situated within intracellular loops 1, 2, and 3 of the secretin receptor. Each was co-expressed with HSecR-YFP or with the combination of HSecR-YN and HSecR-YC. The total amount of DNA used for each transfection was 3μg, divided equally among the noted constructs. No significant BRET signal was obtained with any of the receptor constructs expressed in combination with HSecR-YN and HSecR-YC. The shaded area represents the non-specific BRET signal that can be generated between Rlu-tagged secretin receptor and YFP-tagged structurally-unrelated Type B cholecystokinin (CCKBR) receptor. Values represent means±S.E.M of data from four independent experiments. * p<0.05 indicates a BRET signal significantly above background.
3.4. Morphological FRET microscopy
This morphological technique further confirmed the absence of higher order oligomerization of the secretin receptor beyond the dimerization reflected in the YFP fluorescence exhibited at the cell surface after co-expression of YN- and YC-tagged secretin receptors (Fig 10). Unlike the clear FRET signal at the plasma membrane coming from expression of intact YFP-tagged secretin receptor with CFP (cyan fluorescent protein)-tagged receptor, expression of the pair of secretin receptor constructs exhibiting fluorescence complementation along with the CFP-tagged receptor yielded no significant FRET signal.
Fig 10.
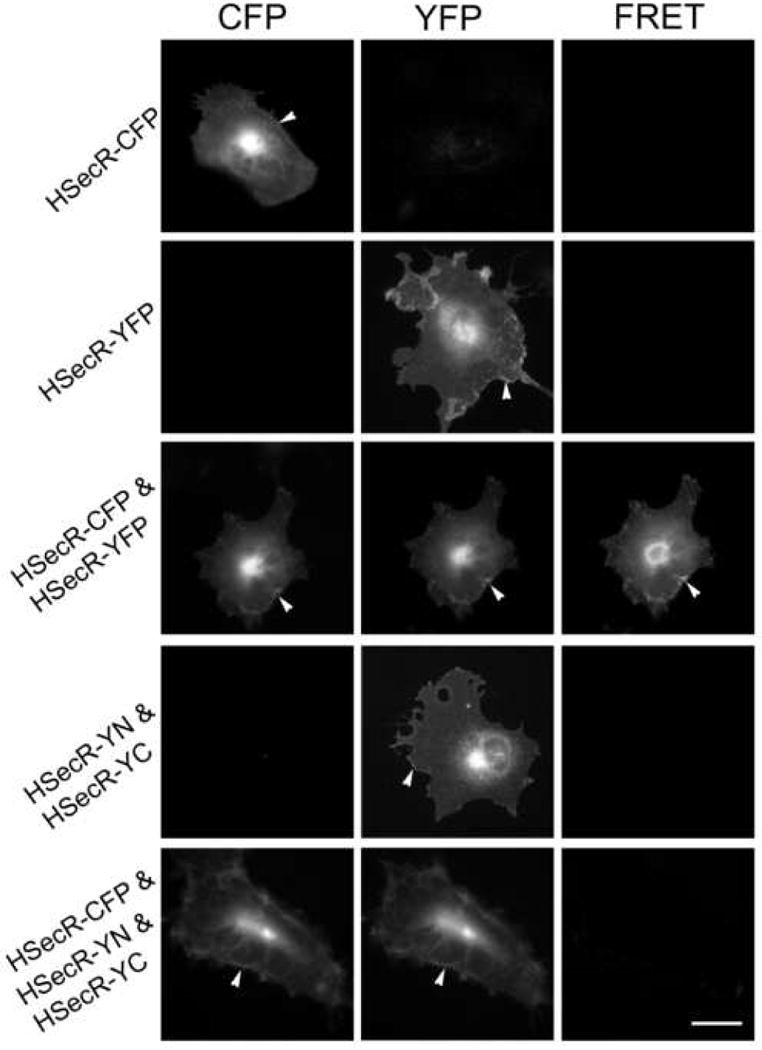
FRET microscopy. Shown are representative microscopic images of COS cells expressing CFP-and YFP-tagged HSecR or CFP-tagged HSecR along with YN- and YC-tagged secretin receptor constructs. Images shown in the left, middle and right column represent background-subtracted, corrected CFP images, background-subtracted, corrected YFP images, and corrected FRET images, respectively. The wild type receptor exhibited a significant FRET signal at the cell surface (arrowheads) and in intracellular compartments. There was no significant FRET signal generated from co-expression of CFP-tagged secretin receptor with the YN- and YC-tagged secretin receptor constructs. The images shown are representative of data from four similar experiments. Bar, 25 μm.
4.Discussion
Oligomerization of GPCRs has been implicated in their normal biosynthesis and trafficking, in the selectivity and affinity of ligand binding, and in their regulation and desensitization [1, 18, 23, 24]. Insight into the molecular mature of oligomeric complexes should provide an opportunity to better understand the structural basis for these processes. It is unlikely that nonspecific receptor aggregates or high order oligomers provide a distinct structural mechanism for these functional events. In contrast, the structurally-specific secretin receptor dimers that are supported by the current work provide a basis for further study of linkage between structure and function.
Bimolecular fluorescence complementation approaches provide a powerful method for the direct demonstration of the physical interaction between two tagged molecules [25, 26]. In this technique, yellow fluorescent protein (YFP) has been divided into two component regions, neither of which is fluorescent by itself. When the two regions are able to physically associate with the correct spatial geometry and dipole orientation, the fluorescence typical of intact YFP protein can be reconstituted. Indeed, we have demonstrated that this occurs when these two portions of YFP are attached to the carboxyl terminus of the secretin receptor and these constructs are co-expressed in the same cell. This reflects the homo-dimerization of the secretin receptor.
It is of particular interest that a third copy of the secretin receptor appears to be unable to associate with an intact homo-dimer of the same receptor. This was demonstrated using BRET methodology, with the third copy of the receptor labeled at its carboxyl-terminal tail, as well as within each of its three distinct intracellular loop domains. If a higher order oligomer could be formed, one would expect at least one of these positions to yield a significant BRET signal. Additionally, the static BRET results were evaluated with saturation BRET methodology and found to confirm this interpretation. Further, morphological FRET was also utilized and found to yield the same conclusion that the secretin receptor forms homo-dimers at the cell surface, without evidence for higher order oligomers. An important positive control demonstrated that Gαs could elicit a positive BRET signal when expressed with the intact homo-dimeric secretin receptor, with this signal not different from the signal it generates with a single secretin receptor construct tagged with intact YFP. This control was also shown to be specific for Gs-coupled receptors, with no significant BRET signal observed for a Gq-coupled control receptor.
The implications of a specific dimeric structure could be quite significant. Recent work has demonstrated that the amino terminus and carboxyl terminus of the secretin receptor do not contribute to its oligomerization [13]. Similarly, competition with each of the seven transmembrane segment peptides revealed that only transmembrane segment four effectively competes for secretin receptor oligomerization [14]. When coupled with the current data, these observations suggest that the homo-dimeric secretin receptor complex forms between helix four of one protomer and helix four of a second protomer. This supports a high degree of structural specificity of this dimeric complex. It is not yet clear whether this might also exist for other Family B GPCRs. The helical bundle of Family B GPCRs is predicted to be quite distinct from that of the better studied Family A GPCRs containing rhodopsin and the β2-adrenergic receptor [27, 28]. With the transmembrane segments likely most important for the oligomerization of the secretin receptor [10, 13, 14], a distinct mechanism for this group of GPCRs is quite likely.
We already know that secretin receptor homo-oligomers are stable, forming constitutively and not being disrupted by agonist binding [11]. We also know that disruption of the oligomeric secretin receptor complexes has functional implications, with reduced cAMP responsiveness [14]. Now that we have learned that this represents a structurally-specific homo-dimer, rather than a higher-order oligomer, it becomes easier to envision this as facilitating G protein coupling for this prototypic Family B GPCR. It is even possible that the stoichiometry of receptor to G protein could be two to one, as suggested in a recent report [29], while several other studies have clearly demonstrated single Family A GPCRs as being sufficient for G protein coupling [30, 31]. Nevertheless, Family B GPCRs may be distinct and unique in this regard. Insight into this will be very important as we begin to examine the structural basis of allosteric modulation, ligand cooperativity, and even the possibility of having distinct functional implications of occupying the primary and secondary protomer of this homo-dimeric complex.
Acknowledgments
The authors thank L.-A. Bruins and M. L. Augustine for their excellent technical assistance. The authors acknowledge Dr. C. S. Lisenbee for helpful discussions in which some of the concepts for these studies were initially developed and for his involvement in preliminary experiments.
The abbreviations used were the following
- BRET
bioluminescence resonance energy transfer
- CFP
cyan fluorescent protein
- FRET
fluorescence resonance energy transfer
- HSecR
human secretin receptor
- KRH
Krebs-Ringer–HEPES
- Rlu
Renilla luciferase
- YFP
yellow fluorescent protein
- YN
YFP(1-158)
- YC
YFP(159-238)
Footnotes
This work was supported by grants from the National Institutes of Health, DK46577 (LJM), and from the Fiterman Foundation (LJM).
Publisher's Disclaimer: This is a PDF file of an unedited manuscript that has been accepted for publication. As a service to our customers we are providing this early version of the manuscript. The manuscript will undergo copyediting, typesetting, and review of the resulting proof before it is published in its final citable form. Please note that during the production process errors may be discovered which could affect the content, and all legal disclaimers that apply to the journal pertain.
References
- 1.Milligan G. G protein-coupled receptor dimerization: function and ligand pharmacology. Mol Pharmacol. 2004;66:1–7. doi: 10.1124/mol.104.000497.. [DOI] [PubMed] [Google Scholar]
- 2.James JR, Oliveira MI, Carmo AM, Iaboni A, Davis SJ. A rigorous experimental framework for detecting protein oligomerization using bioluminescence resonance energy transfer. Nat Methods. 2006;3:1001–1006. doi: 10.1038/nmeth978. [DOI] [PubMed] [Google Scholar]
- 3.Bouvier M, Heveker N, Jockers R, Marullo S, Milligan G. BRET analysis of GPCR oligomerization: newer does not mean better. Nat Methods. 2007;4:3–4. doi: 10.1038/nmeth0107-3. [DOI] [PMC free article] [PubMed] [Google Scholar]
- 4.Gurevich VV, Gurevich EV. GPCR monomers and oligomers: it takes all kinds. Trends Neurosci. 2008;31:74–81. doi: 10.1016/j.tins.2007.11.007. [DOI] [PMC free article] [PubMed] [Google Scholar]
- 5.Pin JP, Kniazeff J, Liu J, Binet V, Goudet C, Rondard P, Prezeau L. Allosteric functioning of dimeric class C G-protein-coupled receptors. Febs J. 2005;272:2947–2955. doi: 10.1111/j.1742-4658.2005.04728.x. [DOI] [PubMed] [Google Scholar]
- 6.Zhang Z, Sun S, Quinn SJ, Brown EM, Bai M. The extracellular calcium-sensing receptor dimerizes through multiple types of intermolecular interactions. J Biol Chem. 2001;276:5316–5322. doi: 10.1074/jbc.M005958200. [DOI] [PubMed] [Google Scholar]
- 7.Breit A, Lagace M, Bouvier M. Hetero-oligomerization between beta2- and beta3-adrenergic receptors generates a beta-adrenergic signaling unit with distinct functional properties. J Biol Chem. 2004;279:28756–28765. doi: 10.1074/jbc.M313310200. [DOI] [PubMed] [Google Scholar]
- 8.Carrillo JJ, Lopez-Gimenez JF, Milligan G. Multiple interactions between transmembrane helices generate the oligomeric alpha1b-adrenoceptor. Mol Pharmacol. 2004;66:1123–1137. doi: 10.1124/mol.104.001586. [DOI] [PubMed] [Google Scholar]
- 9.Meyer BH, Segura JM, Martinez KL, Hovius R, George N, Johnsson K, Vogel H. FRET imaging reveals that functional neurokinin-1 receptors are monomeric and reside in membrane microdomains of live cells. Proc Natl Acad Sci USA. 2006;103:2138–2143. doi: 10.1073/pnas.0507686103. [DOI] [PMC free article] [PubMed] [Google Scholar]
- 10.Ding WQ, Cheng ZJ, McElhiney J, Kuntz SM, Miller LJ. Silencing of secretin receptor function by dimerization with a misspliced variant secretin receptor in ductal pancreatic adenocarcinoma. Cancer Res. 2002;62:5223–5229. [PubMed] [Google Scholar]
- 11.Harikumar KG, Morfis MM, Lisenbee CS, Sexton PM, Miller LJ. Constitutive formation of oligomeric complexes between family B G protein-coupled vasoactive intestinal polypeptide and secretin receptors. Mol Pharmacol. 2006;69:363–373. doi: 10.1124/mol.105.015776. [DOI] [PubMed] [Google Scholar]
- 12.Langer I, Gaspard N, Robberecht P. Pharmacological properties of Chinese hamster ovary cells coexpressing two vasoactive intestinal peptide receptors (hVPAC1 and hVPAC2) Br J Pharmacol. 2006;148:1051–1059. doi: 10.1038/sj.bjp.0706816. [DOI] [PMC free article] [PubMed] [Google Scholar]
- 13.Lisenbee CS, Miller LJ. Secretin receptor oligomers form intracellularly during maturation through receptor core domains. Biochemistry. 2006;45:8216–8226. doi: 10.1021/bi060494y. [DOI] [PMC free article] [PubMed] [Google Scholar]
- 14.Harikumar KG, Pinon DI, Miller LJ. Transmembrane segment IV contributes a functionally important interface for oligomerization of the Class II G protein-coupled secretin receptor. J Biol Chem. 2007;282:30363–30372. doi: 10.1074/jbc.M702325200. [DOI] [PubMed] [Google Scholar]
- 15.Seck T, Baron R, Horne WC. The alternatively spliced deltae13 transcript of the rabbit calcitonin receptor dimerizes with the C1a isoform and inhibits its surface expression. J Biol Chem. 2003;278:23085–23093. doi: 10.1074/jbc.M211280200. [DOI] [PubMed] [Google Scholar]
- 16.Harikumar KG, Dong M, Cheng Z, Pinon DI, Lybrand TP, Miller LJ. Transmembrane segment peptides can disrupt cholecystokinin receptor oligomerization without affecting receptor function. Biochemistry. 2006;45:14706–14716. doi: 10.1021/bi061107n. [DOI] [PMC free article] [PubMed] [Google Scholar]
- 17.Ciruela F, Casado V, Rodrigues RJ, Lujan R, Burgueno J, Canals M, Borycz J, Rebola N, Goldberg SR, Mallol J, Cortes A, Canela EI, Lopez-Gimenez JF, Milligan G, Lluis C, Cunha RA, Ferre S, Franco R. Presynaptic control of striatal glutamatergic neurotransmission by adenosine A1-A2A receptor heteromers. J Neurosci. 2006;26:2080–2087. doi: 10.1523/JNEUROSCI.3574-05.2006. [DOI] [PMC free article] [PubMed] [Google Scholar]
- 18.Franco R, Casado V, Mallol J, Ferrada C, Ferre S, Fuxe K, Cortes A, Ciruela F, Lluis C, Canela EI. The two-state dimer receptor model: a general model for receptor dimers. Mol Pharmacol. 2006;69:1905–1912. doi: 10.1124/mol.105.020685. [DOI] [PubMed] [Google Scholar]
- 19.Lisenbee CS, Harikumar KG, Miller LJ. Mapping the architecture of secretin receptors with intramolecular fluorescence resonance energy transfer using acousto-optic tunable filter-based spectral imaging. Mol Endocrinol. 2007;21:1997–2008. doi: 10.1210/me.2007-0063. [DOI] [PubMed] [Google Scholar]
- 20.Lisenbee CS, Dong M, Miller LJ. Paired cysteine mutagenesis to establish the pattern of disulfide bonds in the functional intact secretin receptor. J Biol Chem. 2005;280:12330–12338. doi: 10.1074/jbc.M414016200. [DOI] [PubMed] [Google Scholar]
- 21.Munson PJ, Rodbard D. Ligand: a versatile computerized approach for characterization of ligand-binding systems. Anal Biochem. 1980;107:220–239. doi: 10.1016/0003-2697(80)90515-1. [DOI] [PubMed] [Google Scholar]
- 22.Harikumar KG, Hosohata K, Pinon DI, Miller LJ. Use of probes with fluorescence indicator distributed throughout the pharmacophore to examine the peptide agonist-binding environment of the family B G protein-coupled secretin receptor. J Biol Chem. 2006;281:2543–2550. doi: 10.1074/jbc.M509197200. [DOI] [PubMed] [Google Scholar]
- 23.Terrillon S, Bouvier M. Roles of G-protein-coupled receptor dimerization. EMBO Rep. 2004;5:30–4. doi: 10.1038/sj.embor.7400052. [DOI] [PMC free article] [PubMed] [Google Scholar]
- 24.Milligan G. G protein-coupled receptor dimerisation: molecular basis and relevance to function. Biochim Biophys Acta. 2007;1768:825–835. doi: 10.1016/j.bbamem.2006.09.021. [DOI] [PubMed] [Google Scholar]
- 25.Hynes TR, Tang L, Mervine SM, Sabo JL, Yost EA, Devreotes PN, Berlot CH. Visualization of G protein betagamma dimers using bimolecular fluorescence complementation demonstrates roles for both beta and gamma in subcellular targeting. J Biol Chem. 2004;279:30279–30286. doi: 10.1074/jbc.M401432200. [DOI] [PubMed] [Google Scholar]
- 26.Heroux M, Hogue M, Lemieux S, Bouvier M. Functional calcitonin gene-related peptide receptors are formed by the asymmetric assembly of a calcitonin receptor-like receptor homo-oligomer and a monomer of receptor activity-modifying protein-1. J Biol Chem. 2007;282:31610–31620. doi: 10.1074/jbc.M701790200. [DOI] [PubMed] [Google Scholar]
- 27.Fredriksson R, Lagerstrom MC, Lundin LG, Schioth HB. The G-protein-coupled receptors in the human genome form five main families. Phylogenetic analysis, paralogon groups, and fingerprints. Mol Pharmacol. 2003;63:1256–1272. doi: 10.1124/mol.63.6.1256. [DOI] [PubMed] [Google Scholar]
- 28.Frimurer TM, Bywater RP. Structure of the integral membrane domain of the GLP1 receptor. Proteins. 1999;35:375–386. [PubMed] [Google Scholar]
- 29.Baneres JL, Parello J. Structure-based analysis of GPCR function: evidence for a novel pentameric assembly between the dimeric leukotriene B4 receptor BLT1 and the G-protein. J Mol Biol. 2003;329:815–829. doi: 10.1016/s0022-2836(03)00439-x. [DOI] [PubMed] [Google Scholar]
- 30.Bayburt TH, Leitz AJ, Xie G, Oprian DD, Sligar SG. Transducin activation by nanoscale lipid bilayers containing one and two rhodopsins. J Biol Chem. 2007;282:14875–14881. doi: 10.1074/jbc.M701433200. [DOI] [PubMed] [Google Scholar]
- 31.White JF, Grodnitzky J, Louis JM, Trinh LB, Shiloach J, Gutierrez J, Northup JK, Grisshammer R. Dimerization of the class A G protein-coupled neurotensin receptor NTS1 alters G protein interaction. Proc Natl Acad Sci USA. 2007;104:12199–12204. doi: 10.1073/pnas.0705312104. [DOI] [PMC free article] [PubMed] [Google Scholar]