

Abstract
Purpose
To determine the feasibility of utilizing diffusion tensor MRI (DT-MRI) based muscle fiber tracking to create biomechanical models of the quadriceps mechanism in healthy subjects and those with chronic lateral patellar dislocation (LPD).
Materials and Methods
Four healthy (average 14.5 years old; BMI 21.8) and four chronic LPD (average 17.3 years old; BMI 22.4) females underwent DT and axial T1W MRI of the thighs. The anatomical and physiologic cross sectional areas (ACSA and PCSA, respectively) and pennation angle were calculated of the vastus lateralis oblique (VLO) and vastus medialis oblique (VMO) muscles. The predicted resultant force vector on the patella was calculated.
Results
The VLO pennation angles in healthy and LPD subjects were 18.7 and 14.5°, respectively (p=0.141). The VMO pennation angles in healthy and LPD subjects were 11.4 and 14.8°, respectively (p=0.02). The ACSA and PCSA VLO:VMO ratios in healthy and LPD subjects were 1.9:1.6 and 2.1:1.6, respectively (p=0.025 and 0.202, respectively). Regardless of whether ACSA or PCSA was used to predict resultant lateral force vectors, the values differed between healthy and LPD subjects (~2 and ~5.3°, respectively; p<0.05).
Conclusion
Chronic LPD patients had more laterally directed predicted resultant force vectors than healthy subjects. Our preliminary results suggest that biomechanical models of the quadriceps mechanism in patients with chronic LPD and healthy subjects can be created in healthy subjects and patients with chronic LPD using DT-MRI.
Keywords: Magnetic resonance imaging (MRI), Diffusion tensor imaging (DTI), Patellar dislocation, Muscle fibers, Leg anatomy, humans
INTRODUCTION
Acute and chronic lateral patellar dislocation (LPD) frequently presents during adolescence, and can be disabling, with no single effective treatment option (1). The etiology for patellar dislocation often is multifactorial and may include a high Q angle, a measure of patella orientation with respect to the anterior superior iliac spine and tibial tuberosity; a shallow and excessively broad trochlear fossa, as assessed using the sulcus angle; and an imbalance in the maximum force potentials of the vastus medialis (VM) and vastus lateralis (VL) muscles. Because the muscle imbalance within the quadriceps mechanism is a common etiological factor (2), initial rehabilitation efforts often will include preferential strengthening of the VM with the aim of preventing recurrent dislocation.
The force potential of a muscle is determined by its size, fiber type composition (3), level of neural activation, and architecture. The last property refers to the arrangement of muscle fibers with respect to the muscle’s line of action. It can be quantified in a simple manner using parameters such as the fiber length and pennation angle (θ), which is the angle formed by the local tangent line to the muscle fibers and the local tangent line to the tissue of fiber insertion, typically an aponeurosis. Muscle volume, fiber length, and θ collectively determine a muscle’s physiological cross sectional area (PCSA), which represents the number of sarcomeres in parallel and predicts actual muscle force production better than its anatomical CSA (ACSA) (3). In LPD, the imbalance in force potential in the VL and VM may result from diminished neural activation and/or atrophy of the VM (2,4), as suggested by electromyography (EMG) (5) and combined MRI and EMG data (6).
In order to obtain in vivo muscle architecture data, many recent studies have used brightness-mode ultrasound (US). In addition, several recent studies have demonstrated that diffusion-tensor (DT)-MRI also allows the quantitative determination of muscle fiber orientation (7–9). By measuring water diffusion in six or more non-colinear directions, water diffusion can be described using a tensor model. The diffusion tensor includes three eigenvalues, which carry information about the magnitude of the diffusion coefficient, and three eigenvectors, which carry information about the orientational dependence of the diffusion. Because water diffuses most readily along the long axis of the muscle fiber (10), the direction of the principal eigenvector corresponds to the local muscle fiber orientation (7,11). Through computer modeling, these data are used to reconstruct and render the path and orientation of muscle fibers within a muscle. Muscle fiber tracking data can subsequently be used to calculate θ (7,8) and the PCSA (9). The use of DT-MRI rather than US for muscle architecture studies in LPD may be advantageous because DT-MRI uses tomographic imaging, and pennation is known to be heterogeneous in the quadriceps muscles (12). Further, the probe rotations required to bring both the aponeurosis and fascicles into focus in the narrow depth of field of planar US reduces the reproducibility of the measurement (13) and results in a constantly changing frame of reference that obscures the 3D aspects of muscle architecture. Moreover, US requires manual specification of tangent lines to the muscle fascicles and aponeuroses, reducing objectivity and increasing analysis time, and 2D US methods may underestimate fascicle lengths and pennation angles as compared to 3D methods (14).
In summary, there are multiple etiological factors contributing to LPD, some of which may be amenable to conservative or surgical treatment. The creation of patient-specific biomechanical models of the quadriceps mechanism using DT-MRI data may help to improve and tailor these treatment plans. However, to our knowledge, no study has assessed the feasibility of utilizing DT-MRI to create biomechanical force vector representations of any muscle. Therefore, the purpose of this study was to determine the feasibility of utilizing DTI based muscle fiber tracking and PCSA to predict biomechanical resultant force vectors, as well as substantiate muscle architectural differences, of components of the quadriceps mechanism in healthy volunteers and in patients with symptomatic recurrent patellar dislocation. We show that with DT-MRI, in vivo, non-invasive, and individualized biomechanical resultant force vectors can be predicted for components of the quadriceps mechanism using data from a single exam.
MATERIALS AND METHODS
Patient Selection
This prospective cohort study of 4 healthy adolescent girls and 4 adolescent girls with symptomatic LPD was approved by our institutional review board. Written informed assent was obtained from all volunteers and written informed consent was obtained from their parents. The control population consisted of 4 healthy adolescent girls having mean (standard deviation, SD) age 14.5 (1) yrs and body mass index (BMI) of 21.8 (3) kg/m2. The study population consisted of 4 adolescent girls with symptomatic lateral patellar dislocation having age=17.3 (1.2) yrs and BMI=22.4 (1.6) kg/m2. The control group had no history of knee trauma requiring immobilization or treatment by an orthopedic surgeon. The LPD patients all had symptomatic recurrent LPD, were under the care of an orthopedic surgeon, and were undergoing or had undergone physical rehabilitation. None had prior surgical management for LPD.
MRI Acquisition and Analysis
MRI data were acquired using a 3T Philips Achieva MR imager/spectrometer. The subject was positioned with the lower extremity parallel to the long axis of the magnet bore. Because patellar instability is greatest in the extended position (15,16), the subject was positioned supine with the knees slightly elevated and the leg flexed by 15° about the knee (as determined with a manual goniometer). The left thigh and knee were imaged in the control subjects. The most affected thigh and knee, as indicated by patient self-report, were imaged. A pair of 14×17 cm, Sensitivity Encoding (SENSE) flexible surface coils were placed over the distal portion of the anterior thigh and a second pair was placed over the proximal portion of the anterior thigh. The subject was introduced into the magnet such that the middle portion of the thigh was at the magnet isocenter. Imaging procedures began with the acquisition of three-plane gradient-echo scout images of the entire thigh. Then, one or more SENSE reference scans were made to map the sensitivity profiles of the coils. Next, a series of T1-weighted axial anatomical images was acquired, beginning at the tibial plateau and extending to the neck of the femur; depending on the size of the subject, either 72 or 80 images were acquired. The images were acquired using a fast spin-echo sequence with an echo-train length of 3, TR/TE=500/14 ms, FOV=256×256 mm, acquired matrix=192×96 (reconstructed matrix=256×256), and slice thickness=5 mm. Finally, axial DT-MRI data were acquired (Figure 1). Packets containing four slices were obtained in the region of the knee and packets containing eight slices were obtained in the mid-thigh region. The DT-MRI data were reformatted into a single data set having slice positions and thicknesses corresponding exactly to those of the anatomical images. Prior to each acquisition, first and second order shimming was performed, using volumes of interest covering the thigh’s cross-section only (in the left-right and anterior-posterior directions) and slightly larger than the slice packet (in the foot-head direction). The use of slice packet-specific shimming ensured more consistent image quality by accounting for the differences in tissue geometry between the various parts of the thigh. The DT-MRI data were acquired using a single-shot EPI sequence with spectral pre-saturation inversion-recovery (SPIR) fat suppression, TR/TE=5000/44 ms, diffusion-weighting (b-) value=400 s/mm2, FOV=256×256 mm, acquired matrix=96×96 (reconstructed matrix=128×128), a SENSE factor of 1.1, 2 excitations, and diffusion weighting in six directions as specified by Jones et al (17).
Figure 1.
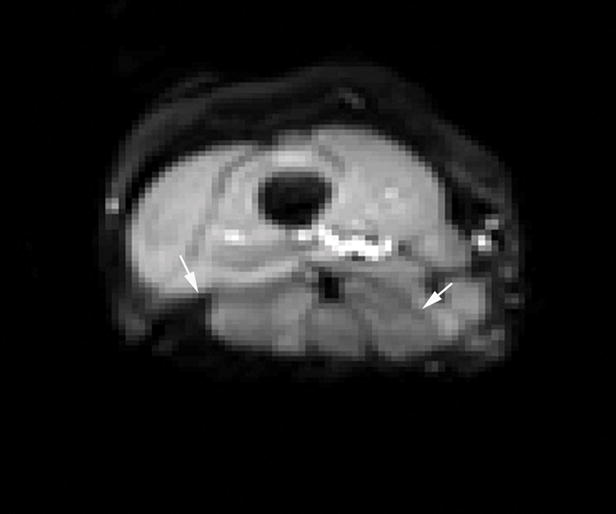
DTI axial through the distal thigh. Phase encoding was in the anterior-posterior direction to direct chemical shift artifact to the posterior thigh musculature (arrows), thereby improving raw data acquisition of the quadriceps mechanism.
In order to determine the level of confidence in the orientation estimates for the principal eigenvector, the signal-to-noise ratio (SNR) was determined in two representative images acquired under identical conditions as:
| [1] |
where S is the mean signal in a region of interest (ROI) in one of the images and σN is the noise standard deviation in the same ROI in the difference image. Further image analysis was conducted by adapting methods for this application as described by Lansdown et al (8). The diffusion weighted images were registered to the b=0 image by applying an affine transformation, performed using the Philips Research Imaging Development Environment (PRIDE) Diffusion Registration tool (version 0.4). Then the diffusion tensor and derived measures (including the fractional anisotropy, FA) were calculated using the Philips PRIDE Fiber Tracking tool (v. 6.0a1). To calculate the total muscle volume and to provide a stop criterion for fiber tracking, a mask was separately defined around each of the muscles of interest (vastus lateralis oblique (VLO) and vastus medialis oblique (VMO)) using a semi-automated boundary finding and smoothing algorithm (Figure 2a) (18). Also, the aponeurosis of fiber insertion was identified as the signal void on the medial aspect of the VLO or on the lateral aspect of the VMO. Typically, the aponeurosis extended superiorly from the patella about for one-half to two-thirds of the total muscle length. In each slice, its location was digitized by manually defining 5 to 10 points (Figure 2b).
Figure 2.
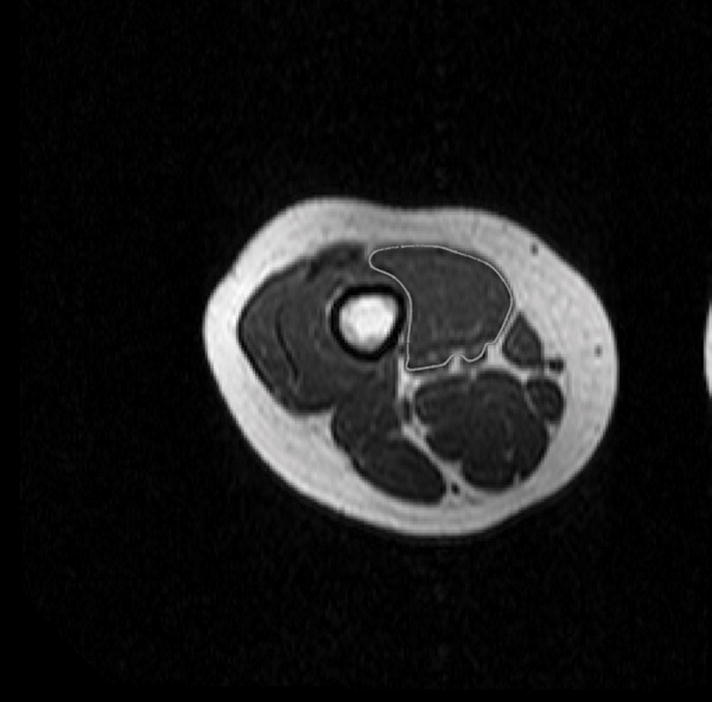
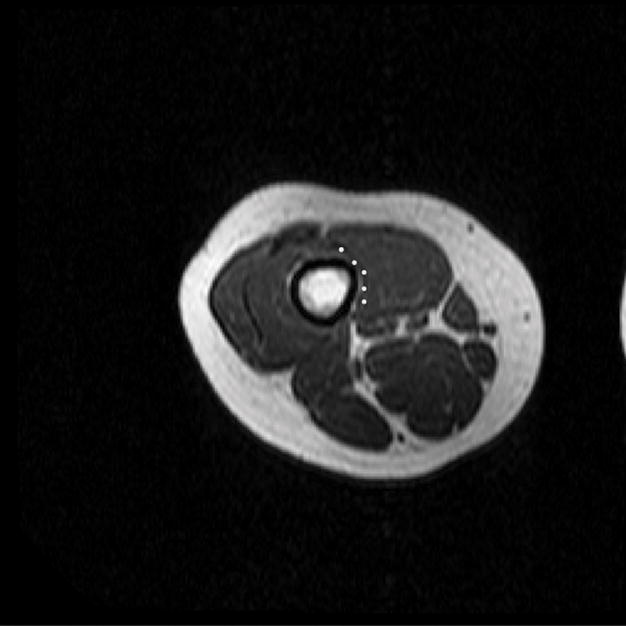
(A) T1 – weighted axial image through the distal right thigh. Semi-automated tracing of the VMO boundary was performed to calculate volume and ACSA, as well as to define points for the outer boundary for termination of muscle fiber tracking from the DTI dataset. (B) Manual aponeurosis tracing of the VMO was performed, and this was used to initiate muscle fiber tracking. A similar technique was used to trace the VLO as well.
To initiate fiber tracking, the digitized aponeurosis positions were used to form a 3-dimensional mesh reconstruction such that the spatial resolution at all points in the mesh was ≥0.25 points/mm2. Each point was used as the seed point of a fiber tract. So that fiber tracking would begin in the muscle itself rather than in the low-signal region of the aponeurosis, the mesh was shifted by ±2 voxel widths (with the sign depending on the muscle and laterality). Fiber tracking was performed by following the direction of greatest diffusion, terminating the procedure if FA<0.2, >0.75, or if the boundary of the mask was reached.
Musculoskeletal Geometric Measurements
For each muscle, the cross-sectional area in each acquired slice was determined by counting the number of voxels in the mask and multiplying by the in-plane resolution (0.01 cm2). The ACSA was determined as the maximum of these values (i.e., the maximum cross-sectional area of the muscle perpendicular to the long axis of the lower extremity). The muscle volume (VM) was determined by summing the total number of voxels in the mask and multiplying by the voxel size (0.005 cm3). The PCSA was calculated for each muscle as follows:
| [2] |
where LF is the length of each fiber tract, measured by summing the distance between each successive pair of points along the fiber tract. The pennation angle at the point of fiber tract insertion was determined by adapting previously described methods (8). Briefly, the plane tangent to seed point of the fiber tract was defined. The normal unit vector to that plane (n̂) was calculated and a series of position vectors (r1–5) were defined between the starting point for the fiber tract and each of the first five points along the fiber tract. The θ at the point of fiber tract insertion was calculated was as the average of the arcsines of the dot products of r1–5 and n. The average value of θ for the entire muscle, weighted by relative aponeurosis area, was used in Eq. [1].
The origin of each muscle was defined as centroid of the most superior position in the mask and the insertions for the VLO and VMO were defined, respectively, as the lateral and medial poles of the patella. The line of action of each muscle was defined as a straight line connecting its origin and insertion. The relative anterior-posterior orientation of the line of action to the femoral shaft (αAP) was determined by calculating the arccosine of the dot product of the sagittal components of the muscles’ lines of action and a position vector describing the orientation of the femoral shaft. A similar analysis was conducted for the muscle and femur components lying in the frontal plane, allowing calculation of the relative left-right orientation (αLR). In order to predict the effect of this geometry and the muscles’ force potentials on patellar motion during an isometric contraction at 15° of knee flexion, anterior-posterior and left-right force vectors were calculated for each muscle by using the ACSA and PCSA to reflect the vectors’ magnitudes and using αAP and αLR to reflect their directions. The VLO’s and VMO’s individual force vectors were added, and the orientation of the resultant force vectors in the anterior-posterior and left-right directions (F→AP and F→LR, respectively) were calculated. In addition, the VLO/VMO volume, ACSA, and PCSA ratios (VLO:VMOVol, VLO:VMOACSA, and VLO:VMOPCSA, respectively) were determined for each subject. Finally, from axial T1-weighted images, congruence and suclus angle measurements (Figure 3) were calculated for healthy volunteers and symptomatic dislocators (19).
Figure 3.
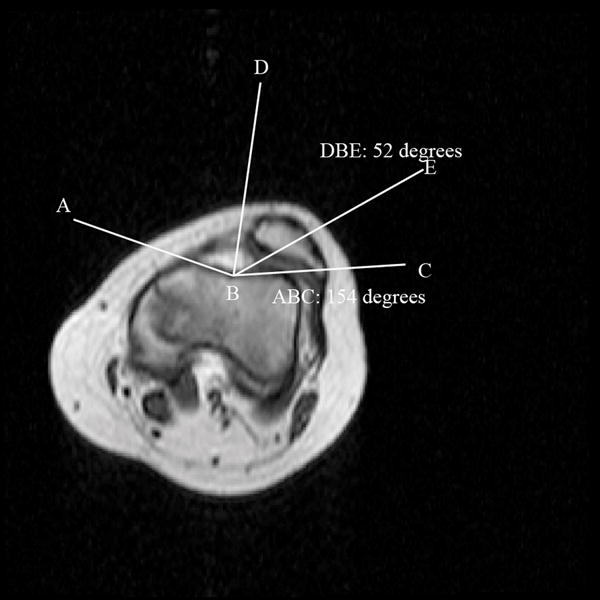
T1 – weighted axial image through the patellofemoral joint in a subject with patellar dislocation, illustrating the calculation of the sulcus and congruence angles. Sulcus angle calculation: ABC. Congruence angle: Angle generated between BD (midpoint of sulcus angle) and BE (line generated between sulcus and lowest point of patellar articular cartilage). For this subject, the sulcus angle was 154 degrees, and congruence angle was laterally deviated by 52 degrees.
Statistics
Descriptive statistics include the mean and SD. Student’s t-test was used to compare the mean values of θVLO, θVMO, VLO:VMOVol, VLO:VMOACSA, VLO:VMOPCSA, F→AP, and F→LR between controls and dislocators. Because previous studies have indicated that systematic differences in diffusivities and FA between muscles that may relate to fiber cross-sectional area (20–23), the mean values of the eigenvalues of the diffusion tensor (λ1–3) and FA were measured for the slice with the largest ACSA and were compared using a two-factor analysis of variance (ANOVA; Muscle×Group). Statistical calculations were performed using Microsoft Excel, except for the ANOVA (performed using Matlab). Statistical significance was accepted at p<0.05.
RESULTS
Subjects with patellar dislocation had laterally deviated congruence angles (20° (SD 28°)), while control subjects had slightly medially deviated congruence angles (−9° (SD 12°)) (p=0.04). Also, they tended to have larger sulcus angles than healthy volunteers (145° (SD 10°) vs. 133° (SD 10°), p=0.058).
In the muscles of interest, the SNR in the non-diffusion weighted images was greater than 50. Figure 4 shows sample fiber tracking results for the VLO and VMO. Quantitative analysis showed that VLO:VMOACSA was significantly higher in dislocators than in controls, but that VLO:VMOPCSA and VLO:VMOVol did not differ significantly (Table 1). θVMO was larger in dislocators than in controls (Table 2). The direction of F→AP and F→LR differed between controls and dislocators, regardless of whether they were computed using the ACSA or PCSA methods (Figure 5, Table 3), and indicated that in dislocators, the resultant force vectors tended to be directed more laterally and anteriorly.
Figure 4.
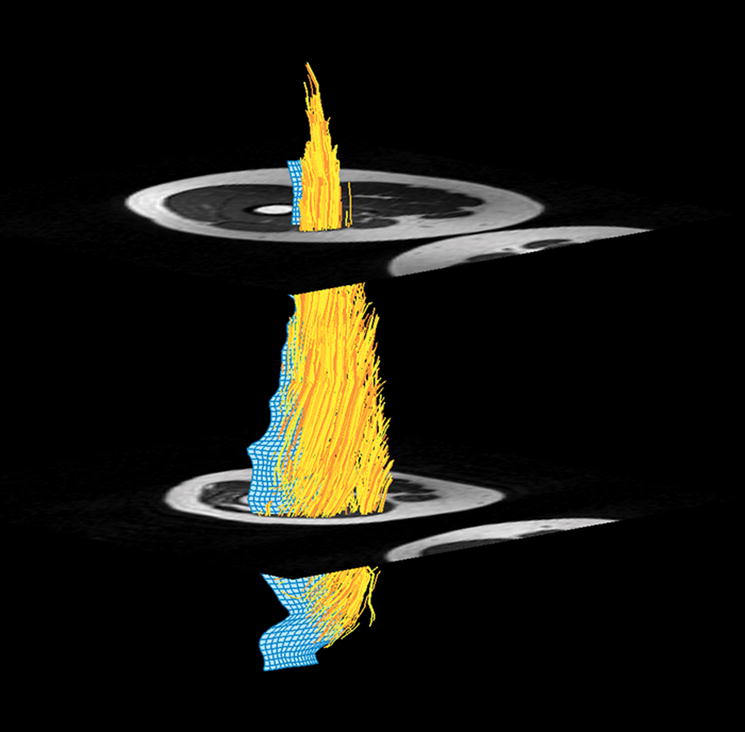
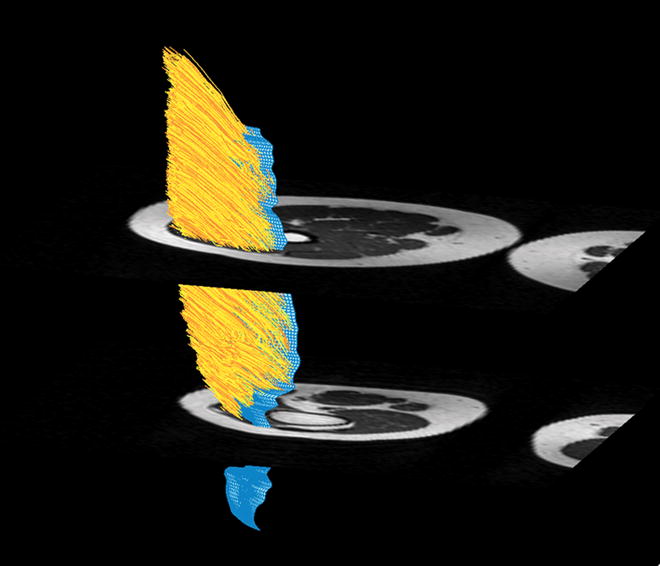
Figure 4a. Muscle fiber tracking of the VMO. 4b. Muscle fiber tracking of the VLO. The blue 3-D mesh is created from manual aponeurosis tracing from the T1 axial dataset (Figure 2b). Muscle fiber tracking (yellow) is derived from DTI data by propagating fiber tracking along the point of maximal diffusion. Fiber tracking was terminated when FA was <0.2 or >0.75, or reached the boundary of the mask (Figure 2a).
Table 1.
VLO:VMO ratios
| Volume | Range | ACSA | Range | PCSA | Range | |
|---|---|---|---|---|---|---|
| Controls | 1.6 (0.2) | 1.4–1.8 | 1.4 (0.2) | 1.2–1.6 | 2.1 (0.8) | 1.1–3.1 |
| Dislocators | 1.7 (0.4) | 1.4–2.2 | 1.9 (0.4) | 1.5–2.3 | 1.6 (0.6) | 1.3–2.6 |
| One-tailed p | 0.267 | 0.025 | 0.202 |
Mean (standard deviation) is given for calculations based on relative volumes, ACSA, and PCSA.
Table 2.
Pennation angles of the VLO and VMO
| VLO | Range | VMO | Range | |
|---|---|---|---|---|
| Control | 18.7 (6.6) | 11.9–25.2 | 11.4 (2) | 9.3–14.2 |
| Dislocators | 14.5 (2.6) | 11.5–17.7 | 14.8 (1.6) | 12.7–16.3 |
| One-tailed p | 0.141 | 0.02 |
Mean (standard deviation) is given.
Figure 5.
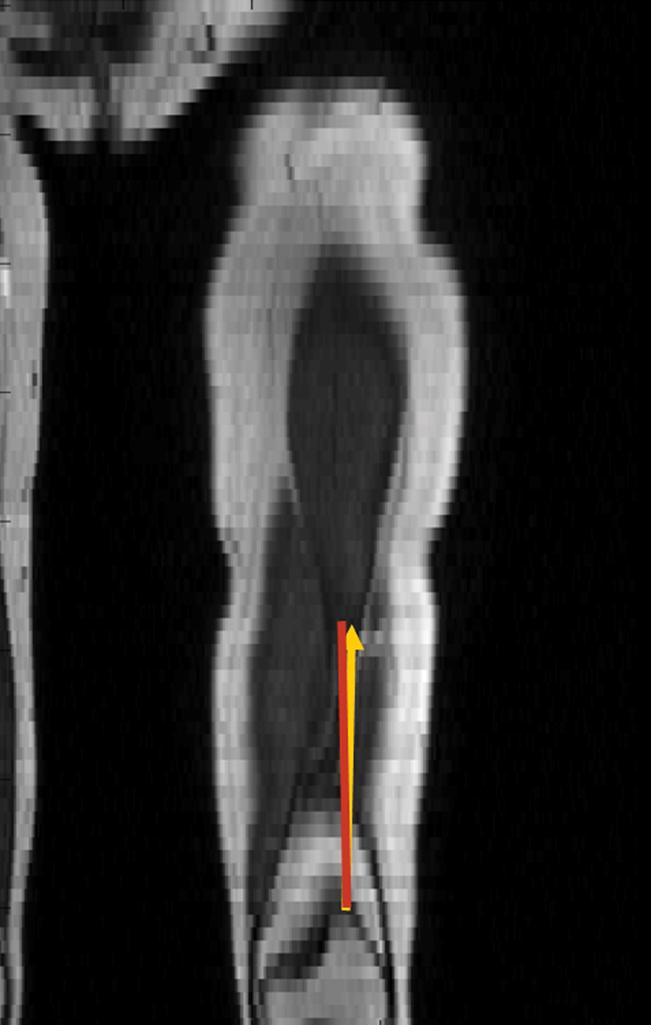
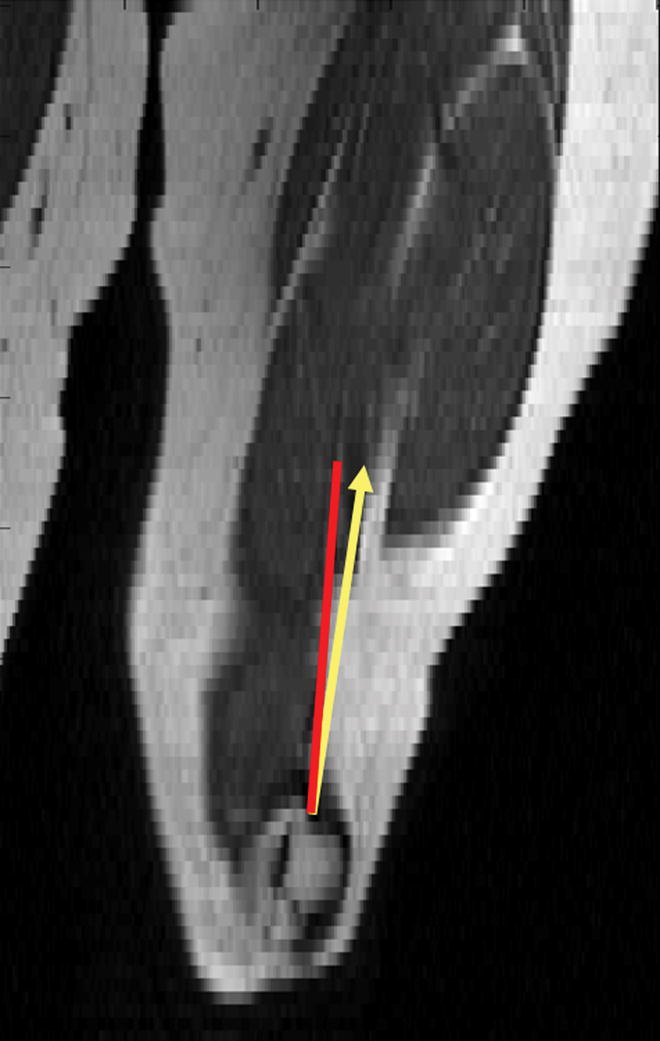
Figure 5a. Coronal reconstruction of T1-weighted images in a healthy volunteer. 5b Coronal reconstruction of T1-weighted images of an adolescent female with symptomatic lateral patellar dislocation. The red line indicates the femoral shaft direction. The yellow line indicates the net lateral vector force in both healthy volunteer and subject with symptomatic lateral patellar dislocation.
Table 3.
Orientation of resultant force vectors (in degrees)
| ACSA | PCSA | |||
|---|---|---|---|---|
| Anterior-Posterior | Left-Right | Anterior-Posterior | Left-Right | |
| Control | 2.0 (1.2) | 2.0 (1.0) | 2.1 (1.4) | 2.0 (1.0) |
| Dislocators | 5.6 (3.4) | 5.2 (2.8) | 5.8 (3.4) | 5.3 (2.6) |
| One-tailed p | 0.048 | 0.038 | 0.044 | 0.032 |
For anterior-posterior measurements, positive angles reflect anterior orientation from the femoral shaft and for left-right measurements, positive angles reflect lateral deviation from the femoral shaft. Mean (standard deviation) is given.
The values for λ1–3 and FA are reported in Table 4. No significant main effects were observed, although there was a tendency for FA to be lower in the VMO than in the VLO (p=0.052). For λ2, there was a significant interaction (p=0.031) such that λ2 was greater in the VMO for dislocators than for controls and was smaller in the VLO for dislocators than for controls.
Table 4.
Diffusivities and derived data
| VLO | VMO | ||
|---|---|---|---|
| λ1 | Control | 2.29 (0.12) | 2.01 (0.20) |
| Dislocators | 2.12 (0.12) | 2.13 (0.08) | |
| λ2 | Control | 1.64 (0.09) | 1.49 (0.12) |
| Dislocators | 1.59 (0.08) | 1.63 (0.06) | |
| λ3 | Control | 1.27 (0.10) | 1.25 (0.14) |
| Dislocators | 1.23 (0.08) | 1.37 (0.06) | |
| FA | Control | 0.29 (0.04) | 0.24 (0.04) |
| Dislocators | 0.27 (0.04) | 0.23 (0.04) |
Mean (standard deviation) is given. No significant differences were observed.
DISCUSSION
DT-MRI is a non-invasive, reproducible (24) test that may potentially be used to evaluate muscle damage, microstructure, and architecture. DT-MRI has recently been shown to detect changes resulting from muscle injury or damage (9,25,26). DT-MRI may also be sensitive to cellular microstructure, including muscle fiber diameter (10,20,21,27,28), which may explain muscle-, gender-, and age-related differences in the transverse diffusivities (λ2 and λ3) and FA (20–22). Our results show that the structural muscle fiber data derived from DT-MRI may be successfully incorporated to create biomechanical vector force representations of muscle units. Furthermore, these models can differentiate muscle fiber orientation and resultant force vectors of muscular components of the quadriceps mechanism in healthy volunteers and symptomatic patellar dislocators.
DT-MRI presents a large number of technical challenges to be overcome, including low signal (due to the short T2 of muscle), high diffusivity (further reducing signal), difficult regions to shim, limb motion, chemical shift artifact, and the need for non-planar region of interest definition in order to initiate fiber tracking. Our solutions to these problems were described by Lansdown et al (8). For this study, we found that we needed to adapt these techniques further by using surface coils (to increase the SNR to ~50, suggesting ~9–10° accuracy in the single-voxel fiber orientation estimates (29)), by reducing the number of slices per acquisition (to improve shimming, in particular around the knee region), and obtaining multiple SENSE coil sensitivity maps. The imaging approach described here, combining anatomic and DT-MRI, allows assessment of the structural properties contributing to lateral patellar dislocation, such as presence of underlying patellofemoral dysplasia. This combination provides a means for a quantitative and objective characterization of the architectural properties of entire muscles, including volume, pennation, fiber tract length, and line of action with respect to anatomic osseous landmarks. Therefore, while this technique requires some optimization and is time-consuming, the information that it provides is distinct from that provided by anatomic MRI alone.
We found that the VLO was larger than the VMO in all subjects (i.e., the VLO:VMO ratio was greater than 1), which is similar to previously published reports (16,30). Moreover in our DT-MRI study, the VLO:VMOACSA ratio was larger in LPD patients than in the controls; this finding is similar to EMG studies that have reported that patellar dislocators tend to have reduced amplitude in the VMO EMG signal, suggesting either relative atrophy or decreased neural activation of the VMO compared with healthy volunteers (4,31). The existence of the larger VLO:VMOACSA ratio would suggest that for equally activated VLO and VMO muscles, a relatively stronger VLO in the subjects with lateral patellar dislocation would contribute to further lateral displacement of the patella during normal activity beyond that observed through passive positioning of the subject in preparation for the imaging procedure.
The use of the DT-MRI data to calculate θ and PCSA revealed two additional important points. The first is that in the VLO, θ was significantly lower in the patellar dislocation subjects than in the controls; conversely, in the VMO, θ tended to be greater in the subjects than in the controls. Narici et al (32) used a unilateral lower limb suspension model to examine the effect of atrophy on muscle architecture, and observed decreases in both θ and fiber length. The tendency of θ to increase in the VMO, which is normally atrophied in LPD patients, is not consistent with this finding. This difference might be explained by the study of different muscles (VMO vs. gastrocnemius by Narici et al (32)) or the duration of the disuse period (essentially lifetime vs. 8 weeks). Alternatively, the tendencies for θ in both muscle groups are consistent with the lateral displacement of the patella (the point of insertion for both muscles). In this feasibility study, we elected to study the muscle at the point of maximum lateral displacement only. Future studies, in which muscle architecture is assessed at many angles of knee flexion (including those at which the patella is not dislocated), would be necessary to test the hypothesis explicitly.
A second important point is that, in contrast to the VLO:VMOACSA calculation, the VLO:VMOPCSA ratio did not differ between subjects and controls. PCSA calculations better reflect muscle force potential than ACSA since PCSA measures the entire volume of a muscle belly and considers muscle architecture patterns (3). Despite the similarity of VLO:VMOPCSA in subjects and controls, the resultant force vectors were more laterally directed in patients than in healthy volunteers. This is likely explained by subjects with patellar dislocation having had larger Q-angles compared with healthy volunteers. This increases the net lateral force, despite the fact that the predicted VLO muscle force was relatively smaller. In addition, the larger sulcus angle is expected to reduce the contact forces between the femoral condyles and the patella, allowing the patella to displace laterally. In addition to the greater lateral deviation in patients, our biomechanical force vector calculations predict more anteriorly directed resultant force vectors in dislocators compared with healthy volunteers (Table 4), further reducing patellar stability.
For completeness, we have reported the values of the eigenvalues and fractional anisotropy values of the diffusion tensor. There was a tendency (p=0.052) for FA to be larger in the VLO than in the VMO and there was a significant muscle by group interaction for λ2. There is evidence that λ1 and its eigenvector represent diffusion parallel to the long axes of muscle fibers (10). There is evidence to support the hypothesis that λ2 and λ3 have different structural determinants from each other (24,33),, and the different statistical behaviors of λ2 and λ3 in this study are consistent with this conclusion as well. However, the specific structural bases for λ2 and λ3 in skeletal muscle remain unclear. Given the diffusion time employed and values for the diffusivities observed, the structures responsible for differences in FA and λ2 would need to have dimensions on the order of 6–8μm and exist transverse to the long axis of the muscle fibers. It is not clear what structural difference might exist between muscles or study groups that could explain these findings.
The limitations of this study include only partial characterization of the quadriceps mechanism. The VMO and VLO were used for our calculations because they had well-defined and consistently identifiable aponeuroses for all our subjects. Also, they comprise 65% of the total quadriceps PCSA (16) and represent the quadriceps mechanism’s most medially and laterally positioned components. Second, studies were not controlled for individual Q-angles. This was not done because we realized early in the course of our study that there was significant intra- and inter-observer variability for Q-angle measurements. A reproducible method of obtaining Q-angles would have been obtained with radiography, but the radiation exposure was not considered acceptable for the study at this time. Predicted forces on the patella were calculated with the quadriceps in the relaxed state. A more physiologic vector force model could have been obtained by studying the architecture of the muscles during quadriceps muscle contraction; however, this is not feasible currently since complete DT-MRI acquisition is approximately one hour per study. Finally, it should be noted that US offers the advantage of being able to study a broader range of leg flexion angles than techniques using the closed bore space of an MR imager. However, we consider this to be a relatively minor disadvantage of DT-MRI since patellar dislocation occurs primarily within the final 20° of the extension movement, which is possible to accomplish when using surface coils and appropriate stabilization of the thigh.
In summary, our study shows that DT-MRI is a feasible method to non-invasively predict biomechanical resultant force vectors of selected muscles of the quadriceps mechanism in vivo; in particular, anatomic and DT-MRI muscle fiber tracking can detect biomechanical vector force differences between healthy subjects and subjects with patellar dislocation. In the future, we believe that DT-MRI muscle fiber tracking may be a helpful tool in tailoring physical therapy as well as monitoring treatment response during rehabilitation in subjects with patellar dislocation.
Acknowledgments
NIH/NIAMS R01 AR050101, NIH/NCRR M01 RR00095 This study was presented at the Radiologic Society of North America meeting, 2007. Manuscript type: original research
References
- 1.Fithian DC, Paxton EW, Cohen AB. Indications in the treatment of patellar instability. J Knee Surg. 2004;17(1):47–56. doi: 10.1055/s-0030-1247149. [DOI] [PubMed] [Google Scholar]
- 2.Beasley LS, Vidal AF. Traumatic patellar dislocation in children and adolescents: treatment update and literature review. Curr Opin Pediatr. 2004;16(1):29–36. doi: 10.1097/00008480-200402000-00007. [DOI] [PubMed] [Google Scholar]
- 3.Powell PL, Roy RR, Kanim P, Bello MA, Edgerton VR. Predictability of skeletal muscle tension from architectural determinations in guinea pig hindlimbs. J Appl Physiol. 1984;57(6):1715–1721. doi: 10.1152/jappl.1984.57.6.1715. [DOI] [PubMed] [Google Scholar]
- 4.Boucher JP, King MA, Lefebvre R, Pepin A. Quadriceps femoris muscle activity in patellofemoral pain syndrome. Am J Sports Med. 1992;20(5):527–532. doi: 10.1177/036354659202000507. [DOI] [PubMed] [Google Scholar]
- 5.Makhsous M, Lin F, Koh JL, Nuber GW, Zhang LQ. In vivo and noninvasive load sharing among the vasti in patellar malalignment. Med Sci Sports Exerc. 2004;36(10):1768–1775. doi: 10.1249/01.mss.0000142302.54730.7f. [DOI] [PubMed] [Google Scholar]
- 6.Besier TF, Gold GE, Beaupre GS, Delp SL. A modeling framework to estimate patellofemoral joint cartilage stress in vivo. Med Sci Sports Exerc. 2005;37(11):1924–1930. doi: 10.1249/01.mss.0000176686.18683.64. [DOI] [PubMed] [Google Scholar]
- 7.Damon BM, Ding Z, Anderson AW, Freyer AS, Gore JC. Validation of diffusion tensor MRI-based muscle fiber tracking. Magn Reson Med. 2002;48(1):97–104. doi: 10.1002/mrm.10198. [DOI] [PubMed] [Google Scholar]
- 8.Lansdown DA, Ding Z, Wadington M, Hornberger JL, Damon BM. Quantitative diffusion tensor MRI-based fiber tracking of human skeletal muscle. J Appl Physiol. 2007;103(2):673–681. doi: 10.1152/japplphysiol.00290.2007. [DOI] [PMC free article] [PubMed] [Google Scholar]
- 9.Heemskerk AM, Strijkers GJ, Vilanova A, Drost MR, Nicolay K. Determination of mouse skeletal muscle architecture using three-dimensional diffusion tensor imaging. Magn Reson Med. 2005;53(6):1333–1340. doi: 10.1002/mrm.20476. [DOI] [PubMed] [Google Scholar]
- 10.Cleveland GG, Chang DC, Hazlewood CF, Rorschach HE. Nuclear magnetic resonance measurement of skeletal muscle: anisotrophy of the diffusion coefficient of the intracellular water. Biophys J. 1976;16(9):1043–1053. doi: 10.1016/S0006-3495(76)85754-2. [DOI] [PMC free article] [PubMed] [Google Scholar]
- 11.Van Donkelaar CC, Kretzers LJ, Bovendeerd PH, Lataster LM, Nicolay K, Janssen JD, Drost MR. Diffusion tensor imaging in biomechanical studies of skeletal muscle function. J Anat. 1999;194(Pt 1):79–88. doi: 10.1046/j.1469-7580.1999.19410079.x. [DOI] [PMC free article] [PubMed] [Google Scholar]
- 12.Scott SH, Engstrom CM, Loeb GE. Morphometry of human thigh muscles. Determination of fascicle architecture by magnetic resonance imaging. J Anat. 1993;182(Pt 2):249–257. [PMC free article] [PubMed] [Google Scholar]
- 13.Klimstra M, Dowling J, Durkin JL, MacDonald M. The effect of ultrasound probe orientation on muscle architecture measurement. J Electromyogr Kinesiol. 2007;17(4):504–514. doi: 10.1016/j.jelekin.2006.04.011. [DOI] [PubMed] [Google Scholar]
- 14.Kurihara T, Oda T, Chino K, Kanehisa H, Fukunaga T, Kawakami Y. Use of three-dimensional ultrasonography for the analysis of the fascicle length of human gastrocnemius muscle during contractions. Int J Sport Health Sci. 2005;(3):226–234. [Google Scholar]
- 15.Senavongse W, Farahmand F, Jones J, Andersen H, Bull AM, Amis AA. Quantitative measurement of patellofemoral joint stability: force-displacement behavior of the human patella in vitro. J Orthop Res. 2003;21(5):780–786. doi: 10.1016/S0736-0266(03)00061-5. [DOI] [PubMed] [Google Scholar]
- 16.Farahmand F, Senavongse W, Amis AA. Quantitative study of the quadriceps muscles and trochlear groove geometry related to instability of the patellofemoral joint. J Orthop Res. 1998;16(1):136–143. doi: 10.1002/jor.1100160123. [DOI] [PubMed] [Google Scholar]
- 17.Jones DK, Horsfield MA, Simmons A. Optimal strategies for measuring diffusion in anisotropic systems by magnetic resonance imaging. Magn Reson Med. 1999;42(3):515–525. [PubMed] [Google Scholar]
- 18.Damon BM, Lansdown DA, Ding Z. Validation and implementation of an automated boundary finding algorithm for muscle anatomy studies. Society of Magnetic Resonance in Medicine 14th Scientific Meeting and Exhibition; Seattle WA. 2006. p. 1008. [Google Scholar]
- 19.Herring JA. Disorders of the Knee. In: Herring JA, editor. Tachdjian’s Pediatric Orthopeaedics. Vol. 2. Philadelphia, PA: W.B. Saunders Company; 2002. pp. 789–837. [Google Scholar]
- 20.Galban CJ, Maderwald S, Uffmann K, de Greiff A, Ladd ME. Diffusive sensitivity to muscle architecture: a magnetic resonance diffusion tensor imaging study of the human calf. Eur J Appl Physiol. 2004;93(3):253–262. doi: 10.1007/s00421-004-1186-2. [DOI] [PubMed] [Google Scholar]
- 21.Galban CJ, Maderwald S, Uffmann K, Ladd ME. A diffusion tensor imaging analysis of gender differences in water diffusivity within human skeletal muscle. NMR Biomed. 2005;18(8):489–498. doi: 10.1002/nbm.975. [DOI] [PubMed] [Google Scholar]
- 22.Galban CJ, Maderwald S, Stock F, Ladd ME. Age-related changes in skeletal muscle as detected by diffusion tensor magnetic resonance imaging. J Gerontol A Biol Sci Med Sci. 2007;62(4):453–458. doi: 10.1093/gerona/62.4.453. [DOI] [PubMed] [Google Scholar]
- 23.Sinha S, Sinha U, Edgerton VR. In vivo diffusion tensor imaging of the human calf muscle. J Magn Reson Imaging. 2006;24(1):182–190. doi: 10.1002/jmri.20593. [DOI] [PubMed] [Google Scholar]
- 24.Heemskerk AM, Sinha TK, Ding Z, Blyth CP, Damon BM. Reproducibility of DTI-based muscle fiber tracking. Proceedings of the 16th Scientific meeting ISMRM; Berlin, Germany. 2007. [Google Scholar]
- 25.Zaraiskaya T, Kumbhare D, Noseworthy MD. Diffusion tensor imaging in evaluation of human skeletal muscle injury. J Magn Reson Imaging. 2006;24(2):402–408. doi: 10.1002/jmri.20651. [DOI] [PubMed] [Google Scholar]
- 26.Heemskerk AM, Strijkers GJ, Drost MR, van Bochove GS, Nicolay K. Skeletal muscle degeneration and regeneration after femoral artery ligation in mice: monitoring with diffusion MR imaging. Radiology. 2007;243(2):413–421. doi: 10.1148/radiol.2432060491. [DOI] [PubMed] [Google Scholar]
- 27.Tanner JE. Self diffusion of water in frog muscle. Biophysical journal. 1979;28(1):107–116. doi: 10.1016/S0006-3495(79)85162-0. [DOI] [PMC free article] [PubMed] [Google Scholar]
- 28.Saotome T, Sekino M, Eto F, Ueno S. Evaluation of diffusional anisotropy and microscopic structure in skeletal muscles using magnetic resonance. Magn Reson Imaging. 2006;24(1):19–25. doi: 10.1016/j.mri.2005.09.009. [DOI] [PubMed] [Google Scholar]
- 29.Damon BM, Wadington MC, Lansdown DA, Hornberger JL. Spatial heterogeneity in the muscle functional MRI signal intensity time course: effect of exercise intensity. Magn Reson Imaging. 2008;26(8):1114–1121. doi: 10.1016/j.mri.2008.01.023. [DOI] [PMC free article] [PubMed] [Google Scholar]
- 30.Morse CI, Degens H, Jones DA. The validity of estimating quadriceps volume from single MRI cross-sections in young men. Eur J Appl Physiol. 2007;100(3):267–274. doi: 10.1007/s00421-007-0429-4. [DOI] [PubMed] [Google Scholar]
- 31.Mariani PP, Caruso I. An electromyographic investigation of subluxation of the patella. J Bone Joint Surg Br. 1979;61-B(2):169–171. doi: 10.1302/0301-620X.61B2.438268. [DOI] [PubMed] [Google Scholar]
- 32.Narici M, Cerretelli P. Changes in human muscle architecture in disuse-atrophy evaluated by ultrasound imaging. J Gravit Physiol. 1998;5(1):P73–74. [PubMed] [Google Scholar]
- 33.Hatakenaka M, Matsuo Y, Setoguchi T, Yabuuchi H, Okafuji T, Kamitani T, Nishikawa K, Honda H. Alteration of proton diffusivity associated with passive muscle extension and contraction. J Magn Reson Imaging. 2008;27(4):932–937. doi: 10.1002/jmri.21302. [DOI] [PubMed] [Google Scholar]