

Abstract
The human Hrs and STAM proteins comprise the ESCRT-0 complex, which sorts ubiquitinated cell surface receptors to lysosomes for degradation. Here we report a model for the complete ESCRT-0 complex based on the crystal structure of the Hrs-STAM core complex, previously solved domain structures, hydrodynamic measurements, and Monte Carlo simulations. ESCRT-0 expressed in insect cells has a hydrodynamic radius of RH = 7.9 nm and is a 1:1 heterodimer. The 2.3 Å crystal structure of the ESCRT-0 core complex reveals two domain-swapped GAT domains and an antiparallel two-stranded coiled-coil, similar to yeast ESCRT-0. ESCRT-0 typifies a class of biomolecular assemblies that combine structured and unstructured elements, and have dynamic and open conformations to ensure versatility in target recognition. Coarse-grained Monte Carlo simulations constrained by experimental RH values for ESCRT-0 reveal a dynamic ensemble of conformations well suited for diverse functions.
Upon activation, many cell surface receptors are ubiquitinated (Kirkin and Dikic, 2007; Piper and Luzio, 2007) and internalized into early endosomes, from which they may be either recycled or degraded in lysosomes. Receptors are committed to the lysosomal pathway through the ESCRT complexes (Hurley, 2008; Nickerson et al., 2007; Slagsvold et al., 2006; Williams and Urbe, 2007). The ESCRTs direct the receptors into the lumen of multivesicular bodies (MVB), which subsequently fuse with lysosomes. The human ESCRT-0 complex consists of two subunits, Hrs (Hepatocyte growth factor-regulated tyrosine kinase substrate) and STAM (Signal Transducing Adaptor Molecule) (Asao et al., 1997). Two STAM isoforms, STAM and STAM2 (Endo et al., 2000), are present in humans. The depletion of Hrs in HeLa cells by RNA interference (Bache et al., 2003b; Lu et al., 2003) impairs the degradation of epidermal growth factor receptor (EGFR), as does either the genetic knockout of Hrs alone or STAM and STAM2 together in mouse (Kanazawa et al., 2003). Drosophila Hrs is essential for the degradation of EGFR and the Torso tyrosine kinase-linked receptor in Drosophila (Lloyd et al., 2002).
Hrs and STAM are modular, multidomain proteins with many interaction partners (Fig. 1). ESCRT-0 is targeted to endosomes via the FYVE (Fab1, YOTB, Vac1, and EEA1) domain of Hrs, which specifically binds to the endosomal lipid phosphatidylinositol 3-phosphate (PI(3)P) (Misra et al., 2001; Raiborg et al., 2001). Hrs binds to the endocytic components clathrin (Raiborg et al., 2002) and EPS15B (Roxrud et al., 2008). Hrs binds to the UEV (ubiquitin E2 variant) domain of the downstream ESCRT-I complex (Bache et al., 2003a; Pornillos et al., 2003) via the sequence motif PSAP (Fig. 1). Hrs is the subject of molecular mimicry by the HIV-1 virus, which recruits ESCRT-I to facilitate budding by mimicking the Hrs PSAP motif (Pornillos et al., 2003). ESCRT-0 binds ubiquitinated cargo via both subunits. Hrs recognizes ubiquitinated cargos via its DUIM (double-sided ubiquitin-interacting motif) (Hirano et al., 2006). STAM contains ubiquitin-binding UIM and VHS domains (Mizuno et al., 2003) and an SH3 domain that recruits the deubiquitinating enzymes (DUBs) AMSH and UBPY (McCullough et al., 2006; Row et al., 2006). The phosphoinositide (Stahelin et al., 2002), ubiquitin (Bilodeau et al., 2002; Shih et al., 2002), ESCRT-I (Bilodeau et al., 2003; Katzmann et al., 2003), and DUB (Ren et al., 2007) binding properties of ESCRT-0 are largely conserved from yeast to humans. By virtue of these interactions, ESCRT-0 serves to bridge the upstream machinery of endocytosis, and the downstream apparatus for MVB biogenesis.
Figure 1.
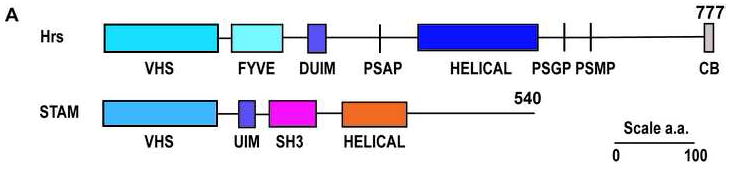
The Hrs and STAM subunits of the human ESCRT-0 complex.
Although much progress has been made in reconstructing essentially complete models of ESCRT-I (Kostelansky et al., 2007) and ESCRT-II (Im and Hurley, 2008) by combining crystal structures of fragments, hydrodynamic analysis, and modeling, the structure of the ESCRT-0 complex has been unclear. Hrs overexpressed in insect cells in the absence of STAM has been reported to form a hexamer (Pullan et al., 2006). In contrast, the complex of the minimal yeast Hrs and STAM fragments required for mutual association formed a 1:1 heterodimer (Prag et al., 2007). The yeast ESCRT-0 core consists of two domain-swapped GAT domains connected by an antiparallel coiled-coil (Prag et al., 2007). The implications of the yeast heterodimer structure for human ESCRT-0 are unclear because human and yeast Hrs lack statistically significant sequence identity within the helical region involved in forming the core complex.
In order to rectify this gap in understanding, we characterized the hydrodynamic properties of both endogenous ESCRT-0 from HeLa cells and recombinant full-length ESCRT-0, and found them to be 1:1 heterodimers. After mapping the minimal complex, we determined the crystal structure of the 1:1 human ESCRT-0 core complex and found it to be similar to the yeast core complex, despite the lack of sequence identity between the corresponding regions of the yeast and human Hrs cores. Finally, experimentally constrained coarse-grained Monte Carlo (MC) simulations were used to develop a structural model for the complete ESCRT-0 complex. This information provides a starting point for understanding the physical interrelationship of the many interactions and activities of ESCRT-0.
Results
The ESCRT-0 complex in HeLa cells
We sought to determine the size of the endogenous human ESCRT-0 complex in order to compare it to the recombinant complex. A HeLa cell lysate was pre-cleared, and applied to a gel filtration column. Immunoblotting of column fractions using anti-Hrs and anti-STAM antibody revealed that both Hrs and STAM elute in a single broad peak, centered at RH = 7.8-8.4 nm (Fig. 2A). The relative amounts of endogenous STAM and Hrs in each fraction are closely correlated, indicating that they co-migrate with each other. The most straightforward interpretation of these data, taken together with previous data demonstrating that Hrs and STAM associate with one another in cells (Asao et al., 1997; Bache et al., 2003b), is that the predominant state of both Hrs and STAM is as subunits of the assembled ESCRT-0 complex in HeLa cells.
Figure 2. SEC and light scattering of ESCRT-0.
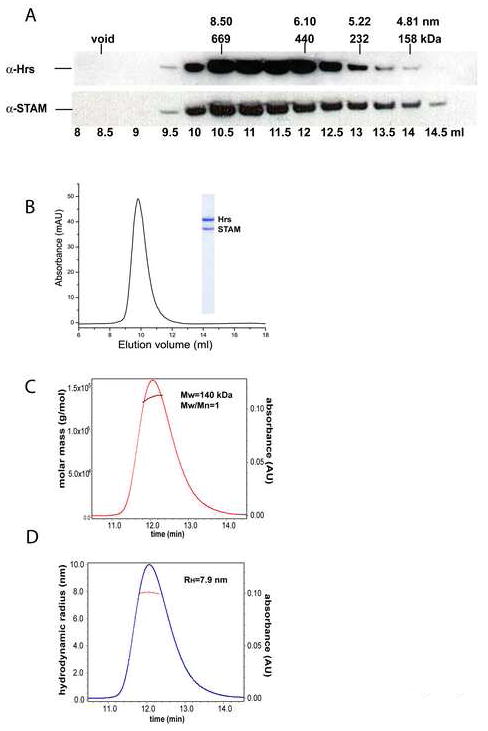
A. Gel filtration chromatography of Hrs and STAM in a HeLa cell extract. Each fraction from a Superdex 200 HR 10/30GL column was analyzed by SDS-PAGE and immunoblotting with antibodies against Hrs and STAM, as indicated. Corresponding elution volumes of protein standards (670, 440, 232, 158 kDa) and the void volume are indicated.Hydrodynamic properties of ESCRT-0. B. Gel filtration analysis of the recombinant full-length ESCRT-0 complex showing elution at RH = 7.8 nm. C. MALS analysis of ESCRT-0 complex eluted from an SEC column. The absolute molar mass versus elution time shows a peak at 140 kDa. D. RH versus elution time, obtained from SEC coupled to online QELS detection.
Reconstitution and hydrodynamics of ESCRT-0
The baculovirus-insect cell expression system was utilized to co-express full-length Hrs and STAM. Recombinant Hrs co-eluted with STAM during GST affinity chromatography and size exclusion chromatography (SEC). SEC of the purified complex showed a single peak at RH = 7.8 nm (Fig. 2B). The close agreement with the RH value for the endogenous complex suggests the recombinant complex is correctly assembled and is an appropriate model for the endogenous complex.
Multi-angle light scattering (MALS) and equilibrium analytical ultracentrifugation (AUC) were used to determine the oligomeric state of the complete ESCRT-0 complex in solution. On the basis of static light scattering, the experimental molecular mass was found to be 140 kDa, consistent with a monodisperse complex of 1:1 stoichiometry (Fig. 2C). Sedimentation equilibrium AUC confirmed the formation of a 1:1 monodisperse complex and returned a molecular mass of 144 ± 3 kDa (Fig. 3A). The native molecular weight was also measured for a complex in which both subunits were truncated following the C-terminus of the core domains, thereby removing large regions predicted to have a random coil conformation. This ΔCT construct has a reduced native molecular weight (Fig. 3B, Table 1), consistent with a 1:1 stoichiometry. In order to probe the solution conformation of ESCRT-0, its hydrodynamic radius was analyzed by quasi-elastic light scattering (QELS; Fig. 2C, D) and sedimentation-velocity AUC (Fig. 3C, D), in addition to the SEC analysis described above. Good agreement was observed between the different approaches (Table 1). From these data, we deduce consensus values of RH = 7.9 and 6.5 nm for the full-length and ΔCT complexes, respectively. Overall, the RH values are consistent with an elongated, non-globular conformation of the complex.
Figure 3. Analytical ultracentrifugation of ESCRT-0.
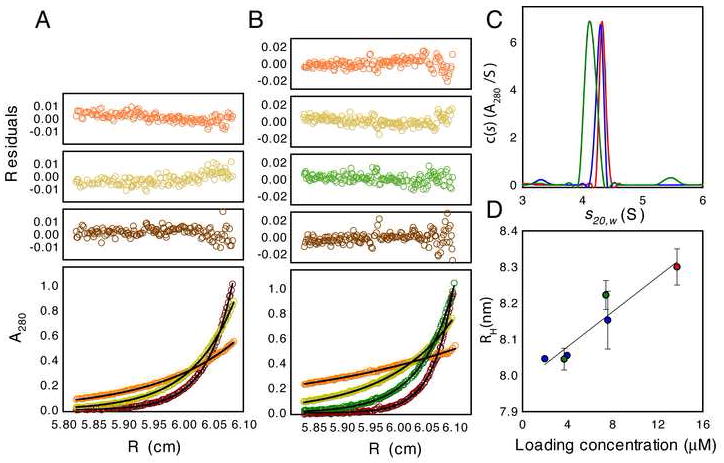
A. Sedimentation equilibrium profiles for ESCRT-0 at 4.0°C plotted as a distribution of the absorbance at 280 nm vs. radius at equilibrium. Data were collected at 8 (orange), 11 (yellow) and 14 (brown) krpm with a loading A280 of 0.28. The solid lines show the best-analysis in terms of a single ideal solute, the corresponding residuals are shown in the plots above. This analysis returns a molecular mass of 144 ± 3 kDa confirming that ESCRT –0 has a 1:1 Hrs:STAM1 stoichiometry. B. Sedimentation equilibrium profiles for ΔCT at 4.0°C plotted as a distribution of the absorbance at 280 nm vs. radius at equilibrium. Data were collected at 6 (orange), 10 (yellow), 14 (green) and 18 (brown) krpm with a loading A280 of 0.34. The solid lines show the best-analysis in terms of a single ideal solute, the corresponding residuals are shown in the plots above. This analysis returns a molecular mass of 106 ± 2 kDa confirming the 1:1 Hrs:STAM stoichiometry of the ΔCT construct. C. Continuous c(s) distributions for the full-length ESCRT-0 complex at loading concentrations of 7.6 μM in 150mM NaCl (blue) and 7.4 μM in 500mM NaCl (red), and for the ΔCT construct at a loading concentration of 10.4 μM (green). For the latter, the major species at 4.15 S corresponds to the 1:1 Hrs STAM complex. The presence of a second species at ~5.4 S is indicative of a weak ΔCT self-association as the contribution of this species increases with sample loading concentration. For this reason, the value of the hydrodynamic radius obtained by dynamic light scattering was much larger than that determined for the 4.15 S species by sedimentation velocity. D. Dependence of the ESCRT-0 hydrodynamic radius with the sample loading concentration. Data obtained by sedimentation velocity in 150mM NaCl (blue), 500mM NaCl (green) or dynamic light scattering (red) in 500mM NaCl are plotted as a function of the sample concentration and fit to a linear relation. The best-fit straight line shown (r2 = 0.90) returns a zero concentration RH of 8.0 ± 0.05 nm.
Table 1.
Hydrodynamic radius (RH) measurements.
| Construct | Hrs | STAM | SEC | RH (nm) AUC-DLSa | QELS |
|---|---|---|---|---|---|
| Full-length | 1-777 | 1-540 | 7.8±0.10 | 8.0±0.05 | 7.9±0.10 |
| ΔCT | 1-557 | 10-390 | 6.6±0.13 | 6.5±0.05 | 6.5±0.10 |
RH for the full-length construct was obtained by extrapolating the sedimentation velocity and dynamic light scattering values to zero concentration (Fig. S1). RH for ΔCT is based solely on sedimentation velocity and represents the average obtained from three concentrations. The full-length construct showed evidence of concentration dependence, while no such dependence was seen for the ΔCT construct. SEC and QELS were carried out at much lower concentrations for both constructs as described in the methods, and were analyzed at only one concentration value.
Mapping the ESCRT-0 core complex
The ΔCT construct was used as the starting point to map the minimal core complex responsible for ESCRT-0 assembly. Gel filtration showed that both proteins were co-eluted from a Ni affinity column and co-migrated in size-exclusion chromatography. Limited proteolysis of the ΔCT construct was used to map the minimal regions required for Hrs and STAM heterodimerization. Based on this analysis, the predicted helical domains (Fig. 1) of both Hrs and STAM contain the only mutually interacting regions of the two subunits. The boundaries of the core complex responsible for 1:1 heterodimer formation were mapped to residues 398-514 of Hrs and 300-378 of STAM, respectively.
Crystal structure of the ESCRT-0 core complex
The structure of the core complex was determined at 2.3 Å by a single isomorphous replacement with anomalous scattering (SIRAS; Table 2, Fig. 4A). The core contains one well-ordered copy each of the Hrs and STAM subunits. The overall structure has a barbell-like shape, with dimensions of roughly 95 × 15 × 15 Å. The buried area is 3647 Å2, which is 24% of the total surface area. Similar to the crystal structure of the yeast ESCRT-0 core complex (Prag et al., 2007), the two subunits are intertwined to form two domain-swapped GAT domains (Fig. 4B). The overall r.m.s.d. for 110 superimposable Cα coordinates from the human and yeast ESCRT-0 complexes is 1.58 Å. One GAT domain (HHS) consists of α1(residues 406-429), α3-N(residues 437-453) of Hrs, packing with α2-C(residues 357-375) of STAM (Fig 4B, C). Hrs contains a single turn helix, α2 (residues 432-436) that is not part of the canonical GAT domain three-helix fold, although it is closely integrated into the HHS bundle. The second GAT domain (SSH) comprises α1 (residues 304-316), α2-N(residues 327-336) of STAM, together with α3-C (residues 470-498) of Hrs. The two bundles are connected by an antiparallel coiled-coil formed by the central portion of Hrs α2 and STAM α2 helices.
Table 2.
Statistics of Data collection, SIRAS phasing and crystallographic refinement.
| Crystals | Native crystal I | EMP derivative (crystal I) | Native crystal II |
|---|---|---|---|
| Constructs | Hrs(398-514) | Hrs(398-514) | |
| STAM(282-387) | STAM(301-387) | ||
| Space group | I41 | I41 | |
| Unit cell axes (Å) | a=b=77.6, c=153.0 | a=b=78.1, c=152.9 | |
| X-ray source | CuKα | CuKα | SER-CAT 22-ID |
| Wavelength (Å) | 1.5418 | 1.5418 | 1.0000 |
| Resolution a (Å) | 3.60 (3.80-3.60) | 4.00 (4.30-4.00) | 2.30 (2.38-2.30) |
| No. of unique reflections | 5210 | 7481 | 20041 |
| I/σ(I) a | 9.6 (4.7) | 6.7 (2.5) | 23.4 (4.2) |
| Rsyma (%) | 13.4 (41.3) | 14.1 (52.6) | 7.7 (32.5) |
| Completeness a (%) | 99.3 (97.1) | 99.0 (97.7) | 99.4 (95.6) |
| Phasing and refinement | |||
| Fig. of Merit | |||
| after SHARP | 0.28 | ||
| after RESOLVE | 0.64 | ||
| R factor (%) | 23.5 | ||
| Free R factorb (%) | 25.3 | ||
| RMS bond length (Å) | 0.016 | ||
| RMS bond angle (°) | 1.367 | ||
| Average B- factors (Å2) | |||
| Hrs c | 42.4 | ||
| STAM c | 41.8 | ||
| Additional helix c | 41.5 | ||
| Water | 59.7 | ||
Values in parentheses refer to the highest-resolution shell.
Rfree is calculated for a randomly chosen 5% subset of reflections omitted from refinement.
Residual B factors after TLS refinement.
Figure 4. Crystal structure of the ESCRT-0 core complex.
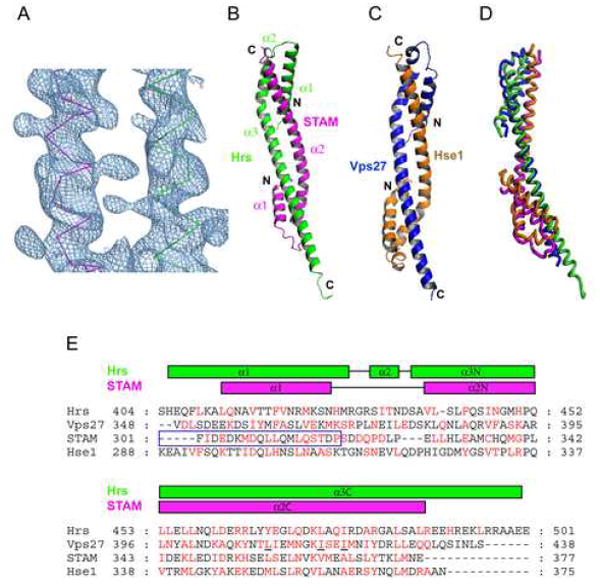
A. The SIRAS synthesis following density modification and phase extension is contoured at 1.0 σ and shown superimposed on a backbone model of the ESCRT-0 structure. B. Overall structure of the ESCRT-0 core complex; Hrs is green, and STAM is purple. C. Overall structure of yeast ESCRT-0 core complex; Vps27 is blue, and Hse1 is orange. D. Superposition of human and yeast core complexes. E. The core domains were aligned based on three-dimensional structural superposition (Hrs, STAM, Vps27 and Hse1). Residues in the hydrophobic interface between Hrs and STAM or Vps27 and Hse1 are colored in red. The STAM-specific motif of STAM (Mizuno et al., 2004) is highlighted in a blue box. Three residues of Vps27 whose mutation blocks complex formation and function in yeast (Prag et al., 2007) are underlined.
Ubiquitin binding by ESCRT-0 VHS domains
We followed up on the published finding that the STAM VHS domain binds to ubiquitin (Mizuno et al., 2003), and took this finding as an inspiration to test whether ubiquitin also bound to the Hrs STAM domain. The STAM VHS domain binds with low affinity (Fig. 5) comparable to that of other ubiquitin binding domains in the ESCRT pathway (Hicke et al., 2005; Hurley et al., 2006), while the Hrs VHS domain does not bind to ubiquitin.
Figure 5. Ubiquitin binding to the VHS domain of STAM.
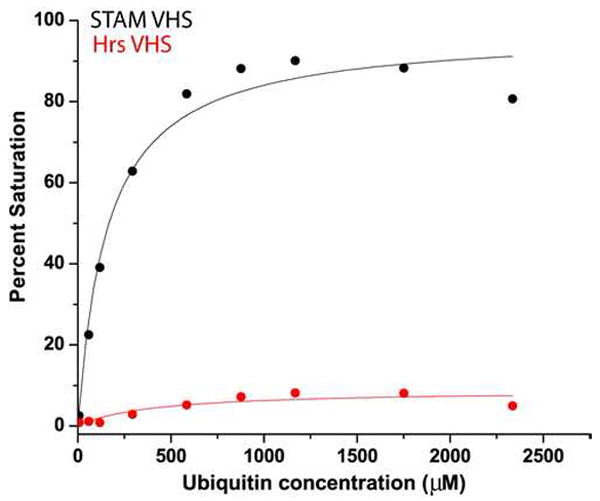
Binding isotherms showing ubiquitin binding to his-tagged STAM VHS domain (Kd=157 μM, black) and his-tagged Hrs VHS domain (binding not detectable, red).
Monte Carlo simulation analysis of the ESCRT-0 complex
We performed MC simulations of the full-length ESCRT-0 and ΔCT construct using the energy function and simulation model of (Kim and Hummer, 2008; Prag et al., 2007). To obtain an equilibrium ensemble of the complex structures consistent with the experimental hydrodynamic radius RH, a harmonic restraint was added that shifted the mean RH but approximately retained its variance (Fig. 6A). The simulations show complex structures that are highly dynamic and open (Fig. 6B-D), consistent with the previous simulation study of the yeast ESCRT-0 complex (30). In the unrestrained simulations, the full-length ESCRT-0 and ΔCT construct yield RH = 6.8 ± 0.6 nm and 5.6 ± 0.5 nm. The mean maximum extent of the full-length ESCRT-0 is 21.4 nm (Fig. 7A), comparable to values for full-length ESCRT-I and II. In order to assess whether the structure was consistent with the possibility of ubiquitin hand-off between ESCRT-0 and ESCRT-I, the distance distributions between the ESCRT-I binding PSAP motif and known or putative ubiquitin binding sites were computed. The DUIM motif of Hrs is the closest ubiquitin binding site to the PSAP motif, with a mean separation of 4.2 nm, consistent with its proximity in the primary sequence (Fig. 7B). The other two established ubiquitin binding sites are distributed farther from the PSAP motif, with mean separations of 6.6 to 9.3 nm (Fig. 7B). However, all of these ubiquitin binding sites have non-zero frequencies of close approach to the ESCRT-I binding site.
Figure 6. Structural model of the complete ESCRT-0 complex.
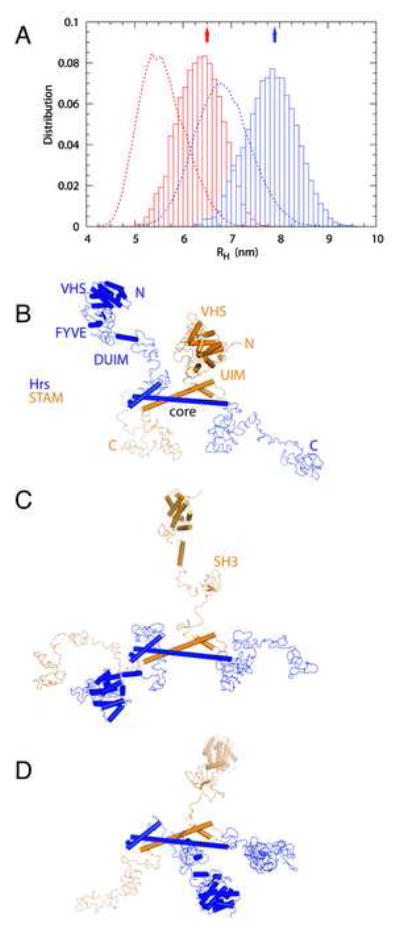
A. Distribution of the hydrodynamic radii for the full-length (blue) and ΔCT construct (red) from unconstrained (dotted curves) and constrained simulations (bars). The arrows indicate the experimental means. (B-D) Three snapshots from the constrained MC simulation of the full length complex. The conformations were superimposed on the basis of the core complex.
Figure 7. Dynamics of ESCRT-0.
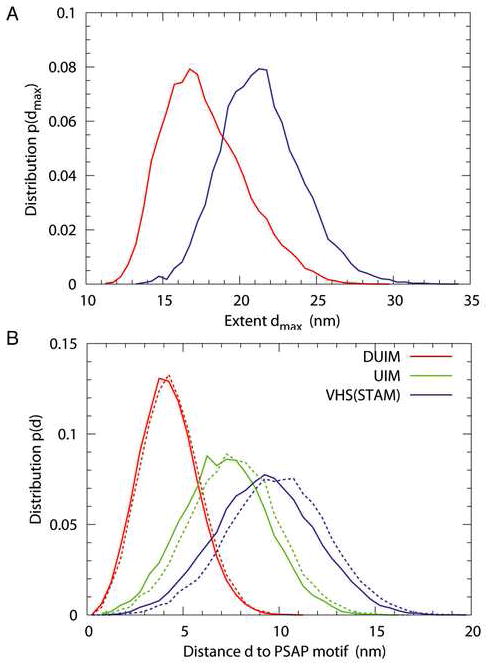
A. Distribution of extent (dmax) for the full-length (blue) and ΔCT construct (red) from restrained simulations. dmax is defined as the maximum distance between any pair of residues in a given conformation. B. Distribution of the distance between the Hrs PSAP motif and the domains Hrs DUIM (red), STAM UIM (green), Hrs VHS (blue), and STAM VHS (purple) for the full-length (solid) and ΔCT construct (dashed) from restrained simulations. The distances are measured between the centers of geometry of the domains.
We sought to determine to what extent the motions of the domains in the ESCRT-0 complex are correlated with one another. We calculated cross-correlation coefficients of rigid domains i and j with ρi,core = log(Ri,core/R0), where Ri,core is the distance between a domain i and the core domain, R0=40 Å is an arbitrary reference distance, and σi,core is the standard deviation of ρi,core. The domains within Hrs or STAM tend to be close to each other in space (Fig. S1) and show positive cross-correlations (Fig. S2). The positive correlations for domains i and j both within either Hrs or STAM, Ci-core,j-core ~ 0.3-0.9, indicate that these domains tend to be jointly close to or far from the core domain. In contrast, the domains of Hrs exhibit negative correlations with those of STAM, albeit at smaller magnitudes (Fig. S2; Ci-core,j-core ~ −0.2). Possible reasons for these anti-correlated domain motions are (1) effects of excluded volume, which keep Hrs domains away from the core domain if STAM domains are close and vice versa, and (2) competition between the Hrs and STAM domains for weak interactions with the core. To test the importance of steric effects, we have simulated the complex with only the repulsive part of the Lennard-Jones potential included, omitting the attractive part of the Lennard-Jones potential and electrostatic interactions, and omitting the hydrodynamic restraints. Without attractive interactions the magnitudes of cross-correlation coefficients are smaller (data not shown). For the domains within Hrs or STAM connected by linkers, the motions are less positively correlated, while the domains on Hrs and STAM separated by the core domain are essentially uncorrelated with −0.1 < Ci-core,j-core < 0. These results suggest that the short-range attractive and electrostatic interactions positively enhance the correlated interaction between Hrs and STAM domains and the core, resulting in competition between Hrs and STAM domains for the space close to the core. To check whether choosing the core domain as a reference point biases the correlation coefficients, we have calculated the 210 four-point cross-correlation coefficients, Cij,kl, for any domain combination i, j, k, l. We found that the above results were retained independent of the reference domain (data not shown). The cross-correlations were plotted against the number of residues separating domain pairs. For domains on different subunits, the number of residues was counted to and from the closest point in the core where Hrs and STAM make contact. The cross-correlations decrease monotonically as the number of residues separating the domain pairs increases. From this observation we conclude that the separation in the primary sequence is the main factor affecting the correlation of the three-dimensional location of the domains. In other words, there are no persistent specific interactions between different domains beyond what might be expected from proximity in the primary sequence.
Discussion
The first goal of this study was to address the functional oligomeric structures of the ESCRT-0 complex. In the concentric ring model, ESCRT-0 is proposed to nucleate the higher-order assembly of ESCRT complexes that is thought to direct the invagination and scission of intralumenal vesicles (ILVs) (Nickerson et al., 2007). The stoichiometry of the ESCRT-0 complex is thus a critical constraint on these models. In the event that the ESCRT-0 complex functioned as a hexamer, as has been reported for the Hrs subunit in isolation (Pullan et al., 2006), this would imply that the larger assembly contained at least six copies of ESCRT-I, six of ESCRT-II, and so on (Nickerson et al., 2007). We found that recombinant human ESCRT-0 purified from insect cell culture is a 1:1 heterodimer. The RH values for the recombinant ESCRT-0 and for endogenous ESCRT-0 from human cell culture are essentially identical, providing evidence that ESCRT-0 functions as a 1:1 heterodimer in its endogenous setting. These findings are consistent with the possibility that as few as one copy each of ESCRT-0, I, and II could direct the formation of an ILV.
The human and yeast ESCRT-0 core complexes have nearly identical three-dimensional structures. The similarity is especially striking in view of the mere 5% sequence identity between the core portions of human and yeast Hrs. In spite of these differences, residues previously found to be critical for complex assembly and sorting function in yeast ESCRT-0 map to structurally equivalent buried residues in the human complex. The architectural similarity in the complexes highlights the essential unity of ESCRT architecture among the Opisthokonta (Leung et al., 2008). The large divergence in Hrs sequences within the region of the core complex recalls the high degree of drift in ESCRT-0 as opposed to the more ancient ESCRT complexes (Leung et al., 2008).
Modular proteins and protein complexes such as ESCRT-0 represent a large class that is often intractable using conventional structural analysis. In order to obtain at least some information on the solution conformation of the full complex, we made every effort to determine the most accurate hydrodynamic parameters possible for both full-length and truncated ESCRT-0. Values of RH determined by SEC, QELS, AUC, and DLS were in excellent agreement with each other for both forms of the complex. The close agreement between RH values obtained from different methods encouraged us to view these as appropriate constraints for computational modeling.
A compact, globular protein with a native molecular weight equal to that of human ESCRT-0 (145 kDa) would be expected to have RH ~ 4.7 nm. The consensus experimental value we obtained, 7.9 nm, is far larger, indicating that ESCRT-0 is not globular and compact, but rather must have a rod-like character, a flexible, open conformation, or both. A simulation analysis of yeast ESCRT-0 (Prag et al., 2007) suggested that this complex was in a highly dynamic, open conformation. The weakness of this analysis was that no hydrodynamic or other experimental data were available on full-length yeast ESCRT-0, and it was not possible to verify this prediction. Hydrodynamic data have been used as constraints on ad hoc modeling of full-length ESCRT-I (Kostelansky et al., 2007) and ESCRT-II (Im and Hurley, 2008) complexes, and we sought to build on this precedent with more rigor. Here, we have modified a coarse-grained MC procedure (Kim and Hummer, 2008) to incorporate an RH restraint term.
Taken together, the simulations and hydrodynamic data show that human ESCRT-0 exists in solution as an ensemble of open conformations. This flexibility is likely to impede efforts to determine the full-length ESCRT-0 structure at higher resolution by electron microscopy or x-ray crystallography. Thus the hybrid structural model presented here is likely to provide the best available structural information on the full complex for some time to come. The lack of persistent inter-domain interactions observed in the simulations is consistent with the absence of biochemical evidence for intra-complex inhibition in the unubiquitinated form of the complex. Hrs is regulated by monoubiquitination, which is thought to lead to the intramolecular autoinhibition of its ubiquitin binding domains (Hoeller et al., 2006). This regulatory mechanism implies a high level of flexibility, consistent with our findings. The ESCRT-0 complex carries out a remarkable number of molecular tasks and binds to a wide range of cargo substrates of differing sizes and ubiquitination states. The flexibility of the complex documented here seems ideally suited to this diversity of function.
Two alternative mechanisms, which are not necessarily exclusive of one another, have been proposed for the sorting of ubiquitinated cargo by the ESCRTs (Hurley, 2008; Nickerson et al., 2007; Slagsvold et al., 2006; Williams and Urbe, 2007). In the “conveyor belt” model, cargo molecules are handed off consecutively from one ESCRT complex to another. In contrast, in the “concentric circle” model, multiple cargo molecules are clustered and bound cooperatively to an assembly of multiple ESCRT complexes. Structural analysis of the relatively rigid ESCRT-I and ESCRT-II complexes strongly argues against hand-off between these two complexes (Kostelansky et al., 2007). However, the dynamics of the more flexible ESCRT-0 complex allow the ubiquitin binding sites on Hrs and STAM to frequently approach the Hrs PSAP motif that is believed to bind to ESCRT-I. This leaves open the possibility that cargo hand-off could occur between these two complexes. In conclusion, the structure of the central complex responsible for initiating the ESCRT pathway in human cells has been elucidated, and methodology has been advanced that should be applicable to a broad class of multimodular proteins and complexes.
Materials and Methods
Fractionation of HeLa cell lysate
One plate of HeLa cells was harvested and cells were lysed on ice for 10 min in PBS buffer containing 0.6% β-octylglucoside, 1mM DTT, 1mM PMSF, 1mM DNase and protease inhibitor cocktail (Roche), pH 7.4. Lysate was precleared for 30 min at 100,000 × g centrifugation at 4°C. Supernatants were loaded onto a Superdex 200 10/300 column in PBS buffer containing 0.1% Tween 20, 0.5 mM PMSF, 1mM DTT, pH 7.4. Fractions were analyzed by western blotting using an anti-Hrs monoclonal antibody (Alexis) and an anti-STAM polyclonal antibody (Calbiochem).
Expression and purification of full-length ESCRT-0
The mouse Hrs gene was subcloned into the PH cassette of pFastBac Dual (Invitrogen), with an N-terminal His6-MBP tag followed by a TEV protease cleavage sequence. DNA coding for human STAM fused to an N-terminal GST and a TEV cleavage site was then subcloned into the P10 cloning site of the same pFast Bac Dual to co-express mouse Hrs and human STAM. Baculovirus was generated and harvested according to the Invitrogen Bac-to-Bac manual and used to infect Hi5 cells in culture medium supplemented with 0.1 mM ZnCl2. Hi5 cells were harvested after 48-72 hours of infection. Pellets were resuspended and lysed in PBS pH 7.4 buffer containing 0.6% β-octyl glucoside, 5mM β-mercaptoethanol (βME), 1mM DNase, 1mM PMSF and complete protease inhibitor cocktail (Roche). The lysate was clarified by centrifugation, applied to a glutathione-sepharose affinity column (GE Healthcare), and the ESCRT-0 complex was eluted with 50 mM reduced glutathione. The GST and His6-MBP tags were removed by TEV cleavage. The cleaved protein was concentrated and applied to a Superdex 200 column (GE Healthcare).
Expression and purification of truncated ESCRT-0 constructs and domains
DNA coding for fragments of human Hrs and STAM (Table 1 and see below under protein crystallization) were subcloned into pST39 (Tan, 2001). STAM was tagged with an N-terminal hexahistidine followed by a TEV protease cleavage site. A DNA fragment coding for the VHS domain of human Hrs (residues 1-143) or STAM (residues 1-143) was subcloned into the pHIS parallel 2 vector (Sheffield et al., 1999) separately with an N-terminal His6-tag and a TEV cleavage site. Plasmids were transformed into Escherichia coli Rosetta2 pLys (DE3) cells (Novagen) and overexpressed in ZYM-5052 autoinduction medium (Studier, 2005). Pellets were resuspended in 50 mM Tris-HCl pH 8.0, 0.5M NaCl, 10 mM imidazole, 3mM βME, and protease inhibitors (Sigma), and lysed by sonication. The clarified supernatant was purified using Ni-NTA affinity chromatography (Qiagen). TEV protease was used to cleave the histidine tag and was removed by a second passage through Ni-NTA resin. The complexes and VHS domains were further purified on a Superdex 200 column (GE healthcare).
Size exclusion chromatography with multi-angle light scattering (SEC-MALS)
SEC-MALS experiments were performed using an Agilent 1200 HPLC system (Agilent Technologies), coupled to a Wyatt DAWN HELEOS-II multi-angle light scattering instrument and a Wyatt Optilab rEX differential refractometer (Wyatt). For chromatographic separation, a TSK-GEL GMPWXL size exclusion column (Tosoh) with a 20 μl sample loop was used at a flow rate of 0.5 ml/min in the same running buffer, 10mM HEPES pH 7.0, 150mM NaCl, 1mM TCEP. The outputs were analyzed by the ASTRA V software (Wyatt). QELS signals, combined with the protein concentration determined by refractive index, were used to calculate the molecular mass of the complex. QELS data was collected by HELEOS-II simultaneously to measure the hydrodynamic radius of the full-length and truncated ESCRT-0 complex. The solvent viscosity was calculated by the software SEDNTERP 1.09 (Hayes, D.B., Laue, T. & Philo, J.; http://www.jphilo.mailway.com/).
Analytical ultracentrifugation
Sedimentation experiments were carried out on a Beckman Optima XL-A or Beckman Coulter Proteome Lab XL-I. Sedimentation velocity experiments on the ΔCT construct were conducted at 4.0°C in 50mM Tris.HCl pH 7.4, 150mM NaCl 3mM 2-mercaptoethanol at 0.35, 0.70 and 1.05 A280 and 55 or 60 krpm. Sedimentation velocity experiments on ESCRT-0 were carried out at 20.0°C in 10mM HEPES pH 7.0, 150 and 500mM NaCl, 1mM TCEP at 0.25, 0.50 and 0.95 A280 at 50 krpm. 350 - 400 μL of the sample was loaded into a double sector cell and scans were acquired as single 280 nm absorbance measurements at 3 or 7 minute intervals. Data were analyzed in SEDFIT 11.71 in terms of a continuous c(s) distribution (Schuck, 2003) encompassing a range of 0.05 − 8.0 S with a resolution of 100 and a confidence level (F-ratio) of 0.68. Excellent fits were obtained with r.m.s.d. values of 0.033 − 0.0059 absorbance units. The solvent densities and viscosities, as well as the solute partial specific volumes, were calculated in SEDNTERP 1.09. Corrected sedimentation coefficients s20,w were used to determine hydrodynamic radii. Sedimentation equilibrium experiments were conducted at 4.0°C using six channel centerpiece cells. 130 μL of each of the ESCRT-0 (0.28 A280) and ΔCT (0.34 A280) in 10mM HEPES pH 7.0, 150mM NaCl, 1mM TCEP and 50mM Tris.HCl pH 7.4, 150mM NaCl, 3mM 2-mercaptoethanol, respectively, were analyzed. Data were acquired at various rotor speeds as an average of four 280 nm absorbance measurements with a radial spacing of 0.001 cm. Equilibrium was achieved within 54 hours and data were analyzed in SEDPHAT 4.3 (Lebowitz et al., 2002) in terms of a single ideal species with excellent data fits.
Dynamic light scattering
The translational diffusion coefficient D was measured from the autocorrelation analysis of the quasielastically scattered light. The 514.5 nm emission of an argon ion laser (Lexel, Model 95) was used in the TEMoo mode and adjusted to an output power of 20 mW. Autocorrelation functions were collected over a five minute period at 90° and 18°C using a Brookhaven Instruments Corporation BI9000AT autocorrelator with sampling times of 1.4 μs to 5 ms. 200 μL of the ESCRT-0 (1.56 A280) or ΔCT (1.58 A280) samples in 10mM HEPES 7.0, 500mM NaCl, 1mM TCEP were analyzed in fluorescence micro-cuvettes. Data indicated the presence of a single species and the second cumulant of the normalized autocorrelation functions, obtained using the measured baseline, was used to calculate the hydrodynamic radius. Experimentally measured and calculated baselines were, at most, within 0.06% of each other.
Protein crystallization
Crystal I was obtained from core construct a (Hrs(398-557)-STAM(282-387)) at 15mg/ml equilibrated against 12 % dioxane, 0.1 M sodium acetate/sodium citrate (80/20 ratio, v/v), pH 4.8 in hanging drops at a 1:1 ratio of protein: precipitant. Crystals were cryoprotected in reservoir solution supplemented with 5% glycerol for 5 min, then transferred into the solution with 25% glycerol, and frozen in liquid N2. A heavy atom derivative was prepared by soaking form I crystals in 1 mM ethyl-mercuric phosphate (EMP) for 4 hr. Crystal II was obtained from core construct b (Hrs(398-557)/STAM(300-387)) at 13 mg/ml equilibrated against 14% MPD, 100 mM CaCl2, 0.1M sodium acetate, pH 5.0. Crystals were improved by microseeding into similar conditions with 12-14% MPD or 80-120 mM CaCl2 and cryoprotected in reservoir solution modified to 22% MPD, and then frozen in liquid nitrogen.
Crystallographic data collection and structure determination
Native and EMP derivative data from crystals grown in condition I were collected with a Rigaku rotating anode home source and a R-AxisIV++ detector, and processed with XDS (Kabsch, 1993). One EMP site was found using SHELXD (Schneider and Sheldrick, 2002) and SIRAS phases were determined using SHARP (Bricogne et al., 2003). High resolution native data were collected from crystal II at 2.3 Å at the SER-CAT beamline ID-22 at the Advanced Photon Source. The experimental phases from Crystal I were transferred to the Crystal II dataset, and extended using RESOLVE (Terwilliger, 2003) to 2.3 Å resolution. The resulting electron density map allowed unambiguous tracing of the peptide backbone. An initial model was built with ARP/wARP (Langer et al., 2008) and completed by cycles of model building with COOT (Emsley and Cowtan, 2004) and TLS refinement with REFMAC (Murshudov et al., 1999; Winn et al., 2001). Water molecules were added manually. During model building, a strong feature became apparent in difference maps at the 3 σ level. It was located close to the middle part of helix α2 of STAM, and clearly indicated the presence of an additional α-helix in the crystal. Parts of side chains up to Cβ were visible in difference maps, fixing the directionality of the helix. To identify the helical fragment, native crystals from condition II were dissolved and analyzed by SDS-PAGE and mass spectrometry, showing that no other protein was in the crystal, and that HRS(398-557) and STAM(300-387) were still present with approximate 1:1 stoichiometry (data not shown). Therefore, it is most likely that the helix corresponds to a poorly ordered second copy of the core complex. The presence of a second copy of the core complex into the asymmetric unit would lower the solvent content to 50.4 % and the VM value to 2.48 A3/Da, both well within the normal range. The final core complex model, including portions of the second copy of the core complex, was refined to R and Rfree values of 24.2 and 26 %, respectively, with good stereochemistry and no Ramachandran outliers. The structural figures were generated in PyMOL (DeLano).
Surface Plasmon Resonance (SPR)
The binding of ubiquitin to his-tagged STAM and Hrs VHS domains was measured using Biacore T100 instrument (Biacore). All SPR experiments were carried out in the same buffer containing 10mM HEPES pH 7.0 and 150mM NaCl at a flow rate of 20 μl/min. Briefly, anti-His antibody (R&D research) was immobilized on CM5 sensor chips using amine coupling, and then used to capture His-tagged proteins at surface densities of ~2000 response units (RU). Various concentrations of bovine ubiquitin (Sigma) were subsequently injected over each surface for 2 min. Between injections, the chip was regenerated using 10mM glycine, pH 1.5. The dissociation constant, Kd, was determined using the steady-state affinity model with BIA evaluation software 3.2 (Biacore).
Replica exchange simulations
An equilibrium ensemble of complex structures was obtained by performing replica exchange MC simulations of the full-length ESCRT-0 and ΔCT construct using the coarse-grained energy functions described in (Kim and Hummer, 2008; Prag et al., 2007). Starting models were derived from the crystal structures of the Hrs VHS-FYVE construct (Mao et al., 2000), the Hrs DUIM (Hirano et al., 2006), the Hrs-STAM core described above, the STAM2 VHS (pdb 1X5B) and SH3 domains (pdb 1X2Q), and a model of the STAM UIM domain based on the Hrs DUIM structure. The large C-terminal random coils and the long linkers were modeled as Gaussian chains with excluded volume. For each system, a total of 104 structures were saved for analysis from runs with 107 MC passes. To test for convergence, three independent runs were performed on each system, producing nearly identical results.
To calculate RH values from the simulated structures, we used a scaled polymer-theory expression (Yamakawa, 1971), where rij is the distance between the Cα atoms of residues i and j, and N is the number of residues. The scale factor γ = 1.5 was obtained from a fit against RH calculated from HYDROPRO (Garcia de la Torre et al., 2000) for various proteins and complexes (9 proteins, 1 nm < RH < 6 nm, Pearson’s r=0.99, maximum deviation 0.24 nm; see Fig. 8). To obtain an equilibrium ensemble of complex structures consistent with the experimental RH values, we performed restrained simulations on the full-length ESCRT-0 and ΔCT construct. Specifically, a harmonic restraint term κ(RH − R0)2 is added to the potential energy function, where RH is the instantaneous hydrodynamic radius of a given conformation, in order to shift the mean RH values. We found that κ = 1 kBT /nm2 and R0 = 9.7 nm for the full-length ESCRT-0 complex, and κ = 1 kBT /nm2 and R0 = 8.3 nm for the ΔCT construct, provided mean RH values consistent with experiments while approximately retaining the variances of unrestrained simulations.
Figure 8. Calculation of hydrodynamic radii.
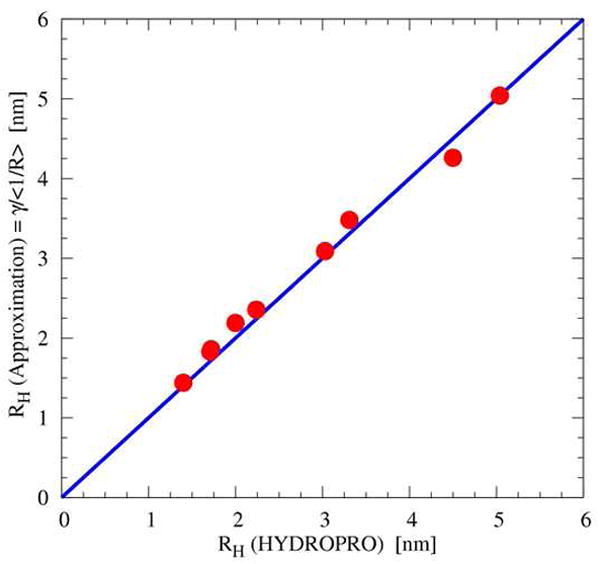
For 9 different proteins in the range of 1 nm < RH < 6 nm, the hydrodynamic radii from polymer theory scaled by γ =1.5 are plotted against radii calculated from HYDROPRO (Garcia de la Torre et al., 2000).
Coordinates
Crystallographic coordinates have been deposited in the Protein Data Bank with ID code 3F1I.
Supplementary Material
Acknowledgments
We thank C. Biertümpfel for assistance with light scattering measurements and the staff of SER-CAT for user support at the APS. Use of the APS was supported by the U. S. DOE, Basic Energy Sciences, Office of Science, under Contract No.W-31-109-Eng-38. This research was supported by NIH intramural support, NIDDK (J.H.H. and G.H.) and IATAP (J.H.H.). D.P.K. is supported by the DFG-NIH program. The NIH Biowulf cluster was used for simulations.
Footnotes
Publisher's Disclaimer: This is a PDF file of an unedited manuscript that has been accepted for publication. As a service to our customers we are providing this early version of the manuscript. The manuscript will undergo copyediting, typesetting, and review of the resulting proof before it is published in its final citable form. Please note that during the production process errors may be discovered which could affect the content, and all legal disclaimers that apply to the journal pertain.
References
- Asao H, Sasaki Y, Arita T, Tanaka N, Endo K, Kasai H, Takeshita T, Endo Y, Fujita T, Sugamura K. Hrs is associated with STAM, a signal-transducing adaptor molecule - Its suppressive effect on cytokine-induced cell growth. J Biol Chem. 1997;272:32785–32791. doi: 10.1074/jbc.272.52.32785. [DOI] [PubMed] [Google Scholar]
- Bache KG, Brech A, Mehlum A, Stenmark H. Hrs regulates multivesicular body formation via ESCRT recruitment to endosomes. J Cell Biol. 2003a;162:435–442. doi: 10.1083/jcb.200302131. [DOI] [PMC free article] [PubMed] [Google Scholar]
- Bache KG, Raiborg C, Mehlum A, Stenmark H. STAM and Hrs are subunits of a multivalent ubiquitin-binding complex on early endosomes. J Biol Chem. 2003b;278:12513–12521. doi: 10.1074/jbc.M210843200. [DOI] [PubMed] [Google Scholar]
- Bilodeau PS, Urbanowski JL, Winistorfer SC, Piper RC. The Vps27p-Hse1p complex binds ubiquitin and mediates endosomal protein sorting. Nat Cell Biol. 2002;4:534–539. doi: 10.1038/ncb815. [DOI] [PubMed] [Google Scholar]
- Bilodeau PS, Winistorfer SC, Kearney WR, Robertson AD, Piper RC. Vps27-Hse1 and ESCRT-I complexes cooperate to increase efficiency of sorting ubiquitinated proteins at the endosome. J Cell Biol. 2003;163:237–243. doi: 10.1083/jcb.200305007. [DOI] [PMC free article] [PubMed] [Google Scholar]
- Bricogne G, Vonrhein C, Flensburg C, Schiltz M, Paciorek W. Generation, representation and flow of phase information in structure determination: recent developments in and around SHARP 2.0. Acta Crystallogr Sect D. 2003;59:2023–2030. doi: 10.1107/s0907444903017694. [DOI] [PubMed] [Google Scholar]
- DeLano WL. The PyMOL Molecular Graphics System. DeLano Scientific; 2002. [Google Scholar]
- Emsley P, Cowtan K. Coot: model-building tools for molecular graphics. Acta Crystallogr Sect D. 2004;60:2126–2132. doi: 10.1107/S0907444904019158. [DOI] [PubMed] [Google Scholar]
- Endo K, Takeshita T, Kasai H, Sasaki Y, Tanaka N, Asao H, Kikuchi K, Yamada M, Chen M, O’Shea JJ, Sugamura K. STAM2, a new member of the STAM family, binding to the Janus kinases. FEBS Lett. 2000;477:55–61. doi: 10.1016/s0014-5793(00)01760-9. [DOI] [PubMed] [Google Scholar]
- Garcia de la Torre J, Huertas ML, Carrasco B. Calculation of hydrodynamic properties of globular proteins from their atomic-level structure. Biophys J. 2000;78:719–730. doi: 10.1016/S0006-3495(00)76630-6. [DOI] [PMC free article] [PubMed] [Google Scholar]
- Hicke L, Schubert HL, Hill CP. Ubiquitin-binding domains. Nat Rev Mol Cell Biol. 2005;6:610–621. doi: 10.1038/nrm1701. [DOI] [PubMed] [Google Scholar]
- Hirano S, Kawasaki M, Ura H, Kato R, Raiborg C, Stenmark H, Wakatsuki S. Double-sided ubiquitin binding of Hrs-UIM in endosomal protein sorting. Nat Struct Mol Biol. 2006;13:272–277. doi: 10.1038/nsmb1051. [DOI] [PubMed] [Google Scholar]
- Hoeller D, Crosetto N, Blagoev B, Raiborg C, Tikkanen R, Wagner S, Kowanetz K, Breitling R, Mann M, Stenmark H, Dikic I. Regulation of ubiquitin-binding proteins by monoubiquitination. Nat Cell Biol. 2006;8:163–U145. doi: 10.1038/ncb1354. [DOI] [PubMed] [Google Scholar]
- Hurley JH. ESCRT Complexes and the Biogenesis of Multivesicular Bodies. Curr Opin Cell Biol. 2008;20:4–11. doi: 10.1016/j.ceb.2007.12.002. [DOI] [PMC free article] [PubMed] [Google Scholar]
- Hurley JH, Lee S, Prag G. Ubiquitin binding domains. Biochem J. 2006;399:361–372. doi: 10.1042/BJ20061138. [DOI] [PMC free article] [PubMed] [Google Scholar]
- Im YJ, Hurley JH. Integrated structural model and membrane targeting mechanism of the human ESCRT-II complex. Dev Cell. 2008;14:902–913. doi: 10.1016/j.devcel.2008.04.004. [DOI] [PMC free article] [PubMed] [Google Scholar]
- Kabsch W. Automatic Processing of Rotation Diffraction Data from Crystals of Initially Unknown Symmetry and Cell Constants. J Appl Crystallogr. 1993;26:795–800. [Google Scholar]
- Kanazawa C, Morita E, Yamada M, Ishii N, Miura S, Asao H, Yoshimori T, Sugamura K. Effects of deficiencies of STAMs and Hrs, mammalian class E Vps proteins, on receptor downregulation. Biochem Biophys Res Comm. 2003;309:848–856. doi: 10.1016/j.bbrc.2003.08.078. [DOI] [PubMed] [Google Scholar]
- Katzmann DJ, Stefan CJ, Babst M, Emr SD. Vps27 recruits ESCRT machinery to endosomes during MVB sorting. J Cell Biol. 2003;162:413–423. doi: 10.1083/jcb.200302136. [DOI] [PMC free article] [PubMed] [Google Scholar]
- Kim YC, Hummer G. Coarse-grained models for simulations of multiprotein complexes: application to ubiquitin binding. J Mol Biol. 2008;375:1416–1433. doi: 10.1016/j.jmb.2007.11.063. [DOI] [PMC free article] [PubMed] [Google Scholar]
- Kirkin V, Dikic I. Role of ubiquitin- and Ubl-binding proteins in cell signaling. Curr Opin Cell Biol. 2007;19:199–205. doi: 10.1016/j.ceb.2007.02.002. [DOI] [PubMed] [Google Scholar]
- Kostelansky MS, Schluter C, Tam YYC, Lee S, Ghirlando R, Beach B, Conibear E, Hurley JH. Molecular architecture and functional model of the complete yeast ESCRT-I heterotetramer. Cell. 2007;129:485–498. doi: 10.1016/j.cell.2007.03.016. [DOI] [PMC free article] [PubMed] [Google Scholar]
- Langer G, Cohen SX, Lamzin VS, Perrakis A. Automated macromolecular model building for X-ray crystallography using ARP/wARP version 7. Nature Protocols. 2008;3:1171–1179. doi: 10.1038/nprot.2008.91. [DOI] [PMC free article] [PubMed] [Google Scholar]
- Lebowitz J, Lewis MS, Schuck P. Modern analytical ultracentrifugation in Prot. Sci.: A tutorial review. Prot Sci. 2002;11:2067–2079. doi: 10.1110/ps.0207702. [DOI] [PMC free article] [PubMed] [Google Scholar]
- Leung KF, Dacks JB, Field MC. Evolution of the multivesicular body ESCRT machinery; retention across the eukaryotic lineage. Traffic. 2008;9:1698–1716. doi: 10.1111/j.1600-0854.2008.00797.x. [DOI] [PubMed] [Google Scholar]
- Lloyd TE, Atkinson R, Wu MN, Zhou Y, Pennetta G, Bellen HJ. Hrs regulates endosome membrane invagination and tyrosine kinase receptor signaling in Drosophila. Cell. 2002;108:261–269. doi: 10.1016/s0092-8674(02)00611-6. [DOI] [PubMed] [Google Scholar]
- Lu Q, Hope LWQ, Brasch M, Reinhard C, Cohen SN. TSG101 interaction with HRS mediates endosomal trafficking and receptor down-regulation. Proc Natl Acad Sci USA. 2003;100:7626–7631. doi: 10.1073/pnas.0932599100. [DOI] [PMC free article] [PubMed] [Google Scholar]
- Mao YX, Nickitenko A, Duan XQ, Lloyd TE, Wu MN, Bellen H, Quiocho FA. Crystal structure of the VHS and FYVE tandem domains of Hrs, a protein involved in membrane trafficking and signal transduction. Cell. 2000;100:447–456. doi: 10.1016/s0092-8674(00)80680-7. [DOI] [PubMed] [Google Scholar]
- McCullough J, Row PE, Lorenzo O, Doherty M, Beynon R, Clague MJ, Urbe S. Activation of the endosome-associated ubiquitin isopeptidase AMSH by STAM, a component of the multivesicular body-sorting machinery. Current Biology. 2006;16:160–165. doi: 10.1016/j.cub.2005.11.073. [DOI] [PubMed] [Google Scholar]
- Misra S, Miller GJ, Hurley JH. Recognizing phosphatidylinositol 3-phosphate. Cell. 2001;107:559–562. doi: 10.1016/s0092-8674(01)00594-3. [DOI] [PubMed] [Google Scholar]
- Mizuno E, Kawahata K, Kato M, Kitamura N, Komada M. STAM proteins bind ubiquitinated proteins on the early endosome via the VHS domain and ubiquitin-interacting motif. Molecular Biology of the Cell. 2003;14:3675–3689. doi: 10.1091/mbc.E02-12-0823. [DOI] [PMC free article] [PubMed] [Google Scholar]
- Mizuno E, Kawahata K, Okamoto A, Kitamura N, Komada M. Association with Hrs is required for the early endosomal localization, stability, and function of STAM. Journal of Biochemistry. 2004;135:385–396. doi: 10.1093/jb/mvh046. [DOI] [PubMed] [Google Scholar]
- Murshudov GN, Vagin AA, Lebedev A, Wilson KS, Dodson EJ. Efficient anisotropic refinement of macromolecular structures using FFT. Acta Crystallogr Sect D. 1999;55:247–255. doi: 10.1107/S090744499801405X. [DOI] [PubMed] [Google Scholar]
- Nickerson DP, Russell DW, Odorizzi G. A concentric circle model of multivesicular body cargo sorting. EMBO Rep. 2007;8:644–650. doi: 10.1038/sj.embor.7401004. [DOI] [PMC free article] [PubMed] [Google Scholar]
- Piper RC, Luzio JP. Ubiquitin-dependent sorting of integral membrane proteins for degradation in lysosomes. Curr Opin Cell Biol. 2007;19:459–465. doi: 10.1016/j.ceb.2007.07.002. [DOI] [PMC free article] [PubMed] [Google Scholar]
- Pornillos O, Higginson DS, Stray KM, Fisher RD, Garrus JE, Payne M, He GP, Wang HE, Morham SG, Sundquist WI. HIV Gag mimics the Tsg101-recruiting activity of the human Hrs protein. J Cell Biol. 2003;162:425–434. doi: 10.1083/jcb.200302138. [DOI] [PMC free article] [PubMed] [Google Scholar]
- Prag G, Watson H, Kim YC, Beach BM, Ghirlando R, Hummer G, Bonifacino JS, Hurley JH. The Vps27/Hse1 complex is a GAT domain-based scaffold for ubiquitin-dependent sorting. Dev Cell. 2007;12:973–986. doi: 10.1016/j.devcel.2007.04.013. [DOI] [PMC free article] [PubMed] [Google Scholar]
- Pullan L, Mullapudi S, Huang Z, Baldwin PR, Chin C, Sun W, Tsujimoto S, Kolodziej SJ, Stoops JK, Lee JC, et al. The endosome-associated protein Hrs is hexameric and controls cargo sorting as a “master molecule”. Structure. 2006;14:661–671. doi: 10.1016/j.str.2006.01.012. [DOI] [PubMed] [Google Scholar]
- Raiborg C, Bache KG, Gillooly DJ, Madshus IH, Stang E, Stenmark H. Hrs sorts ubiquitinated proteins into clathrin-coated microdomains of early endosomes. Nat Cell Biol. 2002;4:394–398. doi: 10.1038/ncb791. [DOI] [PubMed] [Google Scholar]
- Raiborg C, Bremnes B, Mehlum A, Gillooly DJ, D’Arrigo A, Stang E, Stenmark H. FYVE and coiled-coil domains determine the specific localisation of Hrs to early endosomes. Journal of Cell Science. 2001;114:2255–2263. doi: 10.1242/jcs.114.12.2255. [DOI] [PubMed] [Google Scholar]
- Ren J, Kee Y, Huibergtse JM, Piper RC. Hse1, a Component of the Yeast Hrs-STAM Ubiquitin Sorting Complex, Associates with Ubiquitin Peptidases and a Ligase to Control Sorting Efficiency into Multivesicular Bodies. Mol Biol Cell. 2007;18:324–335. doi: 10.1091/mbc.E06-06-0557. [DOI] [PMC free article] [PubMed] [Google Scholar]
- Row PE, Prior IA, McCullough J, Clague MJ, Urbe S. The ubiquitin isopeptidase UBPY regulates endosomal ubiquitin dynamics and is essential for receptor down-regulation. J Biol Chem. 2006;281:12618–12624. doi: 10.1074/jbc.M512615200. [DOI] [PubMed] [Google Scholar]
- Roxrud I, Raiborg C, Pedersen NM, Stang E, Stenmark H. An endosomally localized isoform of Eps15 interacts with Hrs to mediate degradation of epidermal growth factor receptor. J Cell Biol. 2008;180:1205–1218. doi: 10.1083/jcb.200708115. [DOI] [PMC free article] [PubMed] [Google Scholar]
- Schneider TR, Sheldrick GM. Substructure solution with SHELXD. Acta Crystallogr Sect D. 2002;58:1772–1779. doi: 10.1107/s0907444902011678. [DOI] [PubMed] [Google Scholar]
- Schuck P. On the analysis of protein self-association by sedimentation velocity analytical ultracentrifugation. Anal Biochem. 2003;320:104–124. doi: 10.1016/s0003-2697(03)00289-6. [DOI] [PubMed] [Google Scholar]
- Sheffield P, Garrard S, Derewenda Z. Overcoming expression and purification problems of RhoGDI using a family of “parallel” expression vectors. Prot Express Purific. 1999;15:34–39. doi: 10.1006/prep.1998.1003. [DOI] [PubMed] [Google Scholar]
- Shih SC, Katzmann DJ, Schnell JD, Sutanto M, Emr SD, Hicke L. Epsins and Vps27p/Hrs contain ubiquitin-binding domains that function in receptor endocytosis. Nat Cell Biol. 2002;4:389–393. doi: 10.1038/ncb790. [DOI] [PubMed] [Google Scholar]
- Slagsvold T, Pattni K, Malerod L, Stenmark H. Endosomal and non-endosomal functions of ESCRT proteins. Trends Cell Biol. 2006;16:317–326. doi: 10.1016/j.tcb.2006.04.004. [DOI] [PubMed] [Google Scholar]
- Stahelin RV, Long F, Diraviyam K, Bruzik KS, Murray D, Cho W. Phosphatidylinositol 3-phosphate induces the membrane penetration of the FYVE domains of Vps27p and Hrs. J Biol Chem. 2002;277:26379–26388. doi: 10.1074/jbc.M201106200. [DOI] [PubMed] [Google Scholar]
- Studier FW. Protein production by auto-induction in high-density shaking cultures. Prot Express Purific. 2005;41:207–234. doi: 10.1016/j.pep.2005.01.016. [DOI] [PubMed] [Google Scholar]
- Tan S. A Modular Polycistronic Expression System for Overexpressing Protein Complexes in Escherichia coli. Prot Express Purific. 2001;21:224–234. doi: 10.1006/prep.2000.1363. [DOI] [PubMed] [Google Scholar]
- Terwilliger TC. Automated main-chain model building by template matching and iterative fragment extension. Acta Crystallogr Sect D. 2003;59:38–44. doi: 10.1107/S0907444902018036. [DOI] [PMC free article] [PubMed] [Google Scholar]
- Williams RL, Urbe S. The emerging shape of the ESCRT machinery. Nat Rev Mol Cell Biol. 2007;8:355–368. doi: 10.1038/nrm2162. [DOI] [PubMed] [Google Scholar]
- Winn MD, Isupov MN, Murshudov GN. Use of TLS parameters to model anisotropic displacements in macromolecular refinement. Acta Crystallogr Sect D. 2001;57:122–133. doi: 10.1107/s0907444900014736. [DOI] [PubMed] [Google Scholar]
- Yamakawa H. Modern Theory of Polymer Solutions. New York: Harper & Row; 1971. [Google Scholar]
Associated Data
This section collects any data citations, data availability statements, or supplementary materials included in this article.