Abstract
The goal of this study was to measure the effects of global spectral manipulations on vowel identification by progressively high-pass filtering vowel stimuli in the spectral modulation domain. Twelve American-English vowels, naturally spoken by a female talker, were subjected to varied degrees of high-pass filtering in the spectral modulation domain, with cutoff frequencies of 0.0, 0.5, 1.0, 1.5, and 2.0 cycles∕octave. Identification performance for vowels presented at 70 dB sound pressure level with and without spectral modulation filtering was measured for five normal-hearing listeners. Results indicated that vowel identification performance was progressively degraded as the spectral modulation cutoff frequency increased. Degradation of vowel identification was greater for back vowels than for front or central vowels. Detailed acoustic analyses indicated that spectral modulation filtering resulted in a more crowded vowel space (F1×F2), reduced spectral contrast, and reduced spectral tilt relative to the original unfiltered vowels. Changes in the global spectral features produced by spectral modulation filtering were associated with substantial reduction in vowel identification. The results indicated that the spectral cues critical for vowel identification were represented by spectral modulation frequencies below 2 cycles∕octave. These results are considered in terms of the interactions among spectral shape perception, spectral smearing, and speech perception.
INTRODUCTION
Many acoustic features influence vowel identification, including absolute and relative formant frequency, formant transition, overall duration, fundamental frequency, spectral contrast, and spectral tilt. Some investigators have suggested that vowel formants exclusively provided the essential acoustic information for vowel identity (e.g., Hillenbrand et al., 1995; Hillenbrand and Nearey, 1999), while other investigators have emphasized the importance of overall spectral shape on vowel identification (e.g., Bladon and Lindblom, 1981; Bladon, 1982; Zahorian and Jagharghi, 1993). The purpose of the present study is to investigate the influence of changes in global spectral shape on speech perception by systematically manipulating the spectral modulation content of vowel stimuli and evaluating the impact of such manipulations on vowel identification. Specifically, a goal was to determine if degradation of the vowel spectrum produced by parametric changes in the spectral modulation domain yields systematic changes in vowel identification. This investigation is the first in a series of studies designed to evaluate and optimize novel algorithms for manipulating speech in the spectral modulation domain.
Formant frequencies, especially F1 and F2, have been demonstrated to be primary acoustic cues for vowel perception (Miller, 1989; Nearey, 1989; Syndal and Gopal, 1986), although there is a high degree of variability for formant frequencies within each vowel category produced across talkers and phonetic contexts (Peterson and Barney, 1952; Hillenbrand et al., 1995). Both the absolute formant frequency and the relative frequency of formant peaks, such as the distance between F2 and F1 and distance between F3 and F2, provided reliable cues for vowel perception, especially for steady-state vowels. The relative frequencies of formant peaks, combined with their relative amplitudes, largely determine the gross spectral properties of the vowel. Using an automatic vowel classification algorithm for vowels embedded in a consonant-vowel-consonant (CVC) context, Zahorian and Jagharghi (1993) directly compared the relative importance of absolute formant frequency and global spectral shape in vowel classification. They reported that vowel classification based on global spectral features was superior to classification based on formants, independent of the availability of F0 information. Furthermore, corresponding perceptual measures of vowel identification indicated a stronger correlation between perceptual confusions and automatic classification based on the global spectral shape than classification based on formants alone. Similarly, Bladon and Lindblom (1981) evaluated an auditory model of vowel perception based on the assumption that vowel identification was dependent on a spectral representation of loudness density (phons∕Bark) versus cochlear place (Bark). Each stimulus representation was treated as a single spectral shape and the auditory perceptual distance for vowel pairs was measured. The model predictions closely matched the perceptual judgments of the quality difference between vowel pairs, consistent with the hypothesis that overall spectral shape characterized the qualitative and perceptual distances associated with different vowel spectra.
Global spectral shape involves the absolute formant frequency and the relative separation among vowel formants as well as the relative amplitudes of the spectral peaks and their associated valleys (i.e., spectral contrast). Several studies have investigated the effect of spectral contrast on vowel perception (Leek et al., 1987; Alcantara and Moore, 1995). Using vowel-like harmonic complex in which the intensity level of harmonics corresponding to formant frequencies was incremented adaptively, Leek et al. (1987) measured the minimum peak-to-valley contrast sufficient for vowel identification. Their normal-hearing listeners required about 3 dB peak-to-valley contrasts to achieve vowel identification accuracy above 90%. Similarly, Alcantara and Moore (1995) reported that the identification of vowel-like harmonic complexes by normal-hearing listeners was nearly 80% correct for peak-to-valley contrasts of 4 dB corresponding to F1–F3 when vowel sounds were presented at 65 dB sound pressure level (SPL).
Spectral tilt, or the relative amplitude of high- to low-frequency components, is another important acoustic characteristic of global spectral shape. Changes in spectral tilt lead to significant changes in vowel quality. Ito et al. (2001) measured the identification of isolated, synthetic, steady-state Japanese vowels in which the F2 peak was removed while the amplitude of the remaining formant peaks was preserved. Despite changes in vowel quality, complete removal of the F2 peak did not alter vowel identification, suggesting that a spectral peak corresponding to F2 was not required for the accurate identification of Japanese vowels. To separate the effects of global spectral tilt and formant frequency, Kiefte and Kluender (2005) manipulated those parameters independently using American English vowels. In addition to producing a much more crowded vowel space, their results showed that both local (formant frequency) and global (spectral tilt) acoustic cues had strong perceptual effects and that effect of changing spectral tilt was mitigated as the temporal pattern of formant frequencies was retained. They concluded that effects of spectral tilt on vowel identification might be very limited, given that naturally spoken English vowels were generally dynamic.
Rather than direct manipulation of acoustic features (e.g., formant frequency and formant amplitude), another approach to the study of spectral features involves modification of the global spectral shape of speech stimuli. Several investigations have manipulated the global spectrum via spectral envelope smearing in an effort to either simulate reduced spectral resolution associated with hearing impairment or to determine the relative importance of various acoustic features to speech perception. In previous studies, spectral smearing has been accomplished by processing speech stimuli through a series of bandpass filters in the audio-frequency domain and systematically varying the filter width and∕or slope (e.g., van Veen and Houtgast, 1985; ter Keurs et al., 1992; 1993; Baer and Moore, 1993; 1994; Moore et al., 1997), by low-pass or high-pass filtering in the temporal modulation domain (e.g., Drullman et al., 1994a, 1994b, 1996), or by varying the number of audio-frequency channels in the context of cochlear implant simulations (e.g., Turner et al., 1999; Fu and Nogaki, 2005; Liu and Fu, 2007). Using each of these techniques, speech perception in quiet or in noise can be degraded as a result of spectral smearing. Interestingly, Drullman et al. (1996) demonstrated that both low-pass and high-pass filtering in the temporal modulation domain were analogous to a uniform reduction in the spectral modulation domain, at least over the spectral modulation range below 2 cycles∕octave. van Veen and Houtgast (1985) argued that this spectral modulation frequency range was the most important for speech perception and Qian and Eddins (2008) showed that the most important spatial information carried by head-related transfer functions corresponded to spectral modulation frequencies below 2 cycles∕octave.
The global spectral envelope can be represented by an array of spectral modulation frequency components via Fourier transformation of the magnitude spectrum (i.e., second-order Fourier transform). A vowel spectrum contains many spectral modulation components, while a series of peaks and valleys that vary sinusoidally across audio frequency is represented by a single component in the modulation spectrum. Amplification or attenuation of spectral modulation frequency components results in changes in the global spectral shape, and may give rise to corresponding perceptual changes. The work of Drullman et al. (1994a, 1994b, 1996) and van Veen and Houtgast (1985) illustrates the importance of spectral modulation content to speech intelligibility; however, the relative importance of different regions in the spectral modulation domain below 2 cycles∕octave has not been established. Clearly spectral smearing results in alterations in the spectral modulation domain; however, the acoustic and perceptual consequences of the global changes resulting from direct manipulations in the spectral modulation domain on the local spectral features of speech stimuli, such as formant frequency, spectral contrast, and spectral tilt, have not been quantified.
The present study was designed to examine acoustic and perceptual impact of filtering low spectral modulation frequency on vowel sounds. A more complete understanding of the relationship between manipulations of the spectral modulation domain and speech perception will guide future studies involving simulations of various types of hearing impairment as well as studies of the efficacy of speech enhancement algorithms based on modifications in the spectral modulation domain. Accordingly, 12 American English vowels were synthesized and the spectral contrast, spectral tilt, and spectral details of these stimuli were manipulated simultaneously by progressively adjusting the cutoff of a high-pass filter applied in the spectral modulation domain. Identification of these vowel stimuli was then measured as a function of filter cutoff frequency to evaluate effects of attenuating low spectral modulation frequency components on vowel perception. To gauge the spectral shape perception abilities of each of the listeners included in this study using nonspeech stimuli, spectral modulation detection thresholds were measured over a wide range of spectral modulation frequencies and the resulting spectral modulation transfer functions were compared to laboratory norms and published data using similar measures of spectral shape perception.
METHOD
Listeners
Five adult native speakers of American English between the ages of 23 and 40 years served as listeners and were paid for their participation in this study. All listeners had normal-hearing sensitivity corresponding to pure-tone thresholds ⩽15 dB Hearing Level (HL; ANSI, 2004) at octave intervals between 250 and 8000 Hz.
Stimuli
All stimuli were generated using a digital array processor (TDT AP2) and a 16 bit D∕A converter with a sampling period of either 81.92 μs (12 207.0125 Hz; vowel identification) or 24.4 μs (40 983 Hz; spectral modulation detection). Following D∕A conversion, stimuli were low pass filtered (5000 Hz for vowels or 18 000 Hz for spectral modulation), attenuated (TDT PA4), and routed via headphone buffer (TDT HB6) to an earphone (Etymotic ER-2) inserted in the left ear of each listener. Stimulus generation and data collection were controlled by the SYKOFIZX® software application (TDT). All testing was conducted in a double-walled sound attenuating chamber (IAC).
Spectral modulation detection stimuli
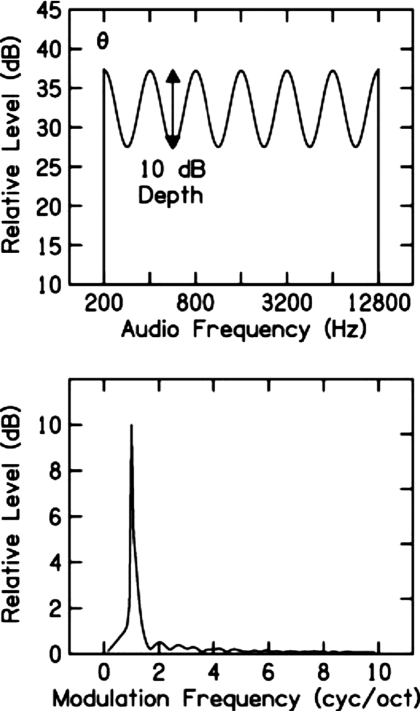
Spectral envelope perception was evaluated by measuring spectral modulation detection thresholds (peak-to-valley contrast in decibels) as a function of spectral modulation frequency (0.25–8.0 cycles∕octave) superimposed on a broadband-noise carrier (200–12 800 Hz) following the technique described by Eddins and Bero (2007). The complex spectrum of the desired signal was computed as follows. Two 8192-point buffers, X (real part of the spectrum) and Y (imaginary part of the spectrum), were filled with the same sinusoid computed on a logarithmic frequency scale with a starting phase randomly selected from a uniform distribution between 0 and 2π rad on each presentation. Following scaling of the sinusoid to the appropriate modulation depth, the X and Y buffers were multiplied by independent 8192-point samples from a Gaussian distribution. Then the X and Y buffers were mutiplied by an 8192-point buffer filled with values corresponding to the magnitude response of a second-order Butterworth filter with a passband from 200 to 12 800 Hz. An inverse fast Fourier transform (FFT) was then performed on the complex spectrum (X,Y) to produce the desired 400-ms spectrally-shaped noise waveform. Finally, the waveforms were shaped with a 10-ms cos2 window and scaled to the desired presentation level. This resulted in independent noise stimuli with the appropriate spectral shape on each observation interval. The spectrum level of the flat-spectrum standard stimuli was 35 dB SPL. The overall level of the spectrally modulated stimuli was adjusted to be equal to that of the flat-spectrum standard. As a result, the levels of the peaks in the modulated spectrum exceeded 35 dB SPL slightly, in a manner dependent on the required spectral modulation depth. The top panel of Fig. 1 illustrates the magnitude spectrum of a spectrally modulated noise as described above. In this example, the sinusoidal spectral modulation has a frequency of 1 cycle∕octave and consists of six cycles spanning the six octaves from 200 to 12 800 Hz. In this example, the modulation depth (i.e., peak-to-valley difference in decibels) is 10 dB and the modulation phase (θ) is π rad with respect to the low-frequency edge of the noise carrier. In the lower panel, the second-order FFT illustrates spectral modulation depth as a function of spectral modulation frequency. In this example, there is a peak at 1 cycle∕octave.
Figure 1.
Schematic representation of sinusoidal spectral modulation superimposed on a broadband-noise carrier from 200 to 12 800 Hz. In this example, the upper panel shows six modulation cycles over a span of six octaves, representing a spectral modulation frequency of 1 cycle∕octave. The spectral modulation depth (peak-to-valley difference in decibels) is 10 dB and the modulation phase (θ) is π rad relative to the low-frequency edge of the noise carrier. The lower panel shows the corresponding modulation magnitude spectrum computed by taking a FFT of the magnitude spectrum shown in the upper panel.
Vowel identification stimuli
Vowel identification was measured for 12 American English vowels ∕i, ɪ, e, ε, æ, ʌ, , ɑ, ɔ, o, u, U∕. Vowels were spoken by an adult, middle-aged female talker in the syllable context ∕bVd∕ and were recorded and stored as digital sound files. Vowels were isolated by deleting the formant transition at the beginning and end of the syllable such that only the relatively steady-state vowel nucleus remained. These stimuli served as standard vowels. Vowel analysis and resynthesis were performed in MATLAB® as follows. First, the linear predictive coding (LPC) spectrum was computed from a 50 ms window of the central nucleus of the standard vowel using 16 LPC coefficients with a modified version of the Colea MATLAB® code (Loizou, 2000). Following conversion to a log2 frequency scale, the LPC spectrum was transformed to the spectral modulation domain via FFT. The resulting magnitude spectrum was high-pass filtered with cutoff frequencies of 0.0 (no filtering), 0.5, 1.0, 1.5, and 2.0 cycles∕octave using a first-order digital Butterworth filter. Vowel spectra, with and without spectral modulation filtering, were reconstructed via inverse FFT of the modified magnitude spectrum and the preserved phase spectrum. This reconstructed spectrum was then duplicated to create a three-dimensional spectrogram with a total duration of 167 ms (the average duration of the 12 vowels spoken by the female talker). The final vowel waveforms were produced by resynthesis using a modified version of STRAIGHT (Kawahara et al., 1999), in which the spectrogram of the standard vowel was replaced by the new spectrogram with the manipulation in the spectral modulation described above. The fundamental frequency of all vowel stimuli was normalized to 160 Hz (the average F0 of the 12 vowels for the female talker). This F0 was constant over the vowel duration.
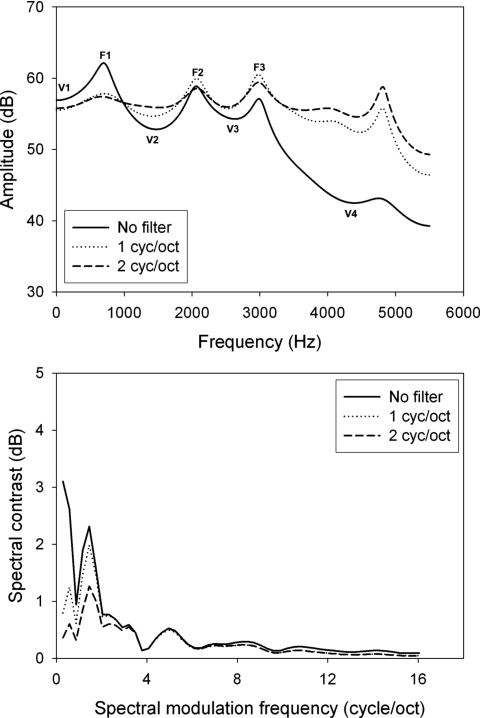
All vowels were scaled to have equal root-mean-squared amplitudes. Each standard vowel had five derivatives (high-pass cutoffs of 0.0, 0.5, 1.0, 1.5, and 2.0 cycles∕octave), yielding a total of 60 vowels (12 vowel categories×5 filter conditions). The sound pressure level of the vowels was set to 70 dB SPL. Figure 2 shows examples of unfiltered and high-pass filtered (1.0 and 2.0 cycles∕octave) ∕æ∕-vowel stimuli with the LPC spectrum shown in the upper panel and the magnitude spectrum in the spectral modulation domain shown in the lower panel. It is clear from the lower panel that the amplitudes of the low spectral modulation frequencies (<3 cycles∕octave) are substantially higher than the amplitudes of the high spectral modulation frequencies. This is consistent with the report by van Veen and Houtgast (1985) that spectral smearing that approximated low-pass filtering in the spectral modulation domain above about 2 cycles∕octave had little influence on vowel spectra or vowel perception.
Figure 2.
LPC spectra (top) and spectral modulation spectra (bottom) for the unfiltered ∕æ∕ vowel (solid) and ∕æ∕ vowels filtered at 1 (dotted) and 2 cycles∕octave (dashed).
Procedures
Spectral modulation detection
For the spectral modulation detection task, a three-interval, single-cue, two-alternative, forced-choice procedure was used to measure spectral modulation detection thresholds. On each trial, the three observation intervals were separated by 400-ms silent intervals. The standard stimulus was presented in first interval as an anchor or reminder. A second standard stimulus and the signal stimulus were randomly assigned to the two remaining presentation intervals. The threshold was estimated using an adaptive psychophysical procedure in which the spectral modulation depth was reduced after three consecutive correct responses and increased after a single incorrect response. The step size was initially 2 dB and was reduced to 0.4 dB after three reversals in the adaptive track, estimating 79.4% correct detection (Levitt, 1971). Spectral modulation detection thresholds were based on the average of three successive 60-trial runs.
Vowel identification
Vowel identification was measured in one unfiltered condition and four high-pass filtered conditions as described above. For a given condition, vowel identification performance was estimated on the basis of three 120-trial blocks with each of the 12 vowels presented ten times in a random order within a block. As a result, vowel identification performance in each condition was based on 360 trials consisting of 30 repetitions of each of the 12 vowel stimuli. Thus, percent correct vowel identification was based on 30 repetitions of each vowel stimulus for each listener. Short breaks were provided between blocks and all of the conditions were completed in four sessions with each session lasting from 1 to 1.5 h. Listeners were seated in front of a computer monitor that displayed the 12 response alternatives as a text box labeled with the English word corresponding to each vowel in a ∕hvd∕ context (e.g., had, head, hayed, heed, hid, hod, hoard, hoed, hood, who’d, hud, and heard). Listeners responded by using a computer mouse to click on the button corresponding to their response choice. After each vowel presentation, the listener was allowed 10 s to respond. Prior to data collection, listeners were familiarized with the task over the course of a half-hour practice session using standard stimuli. During familiarization, feedback was provided to indicate the correct response on each trial. No feedback was provided during formal testing.
RESULTS
Spectral modulation detection
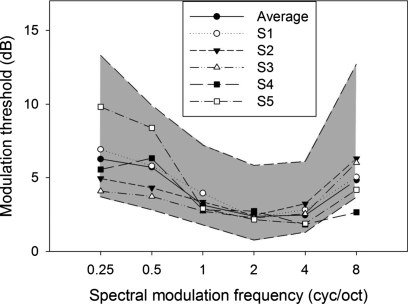
Spectral shape perception was evaluated by means of a spectral modulation detection task. Figure 3 shows spectral modulation detection threshold (peak-to-valley difference in decibels) as a function of spectral modulation frequency (cycles∕octave) for each of the five listeners as well as the average spectral modulation transfer function (SMTF). In general, thresholds were lowest for the middle modulation frequencies and increased at very low and very high modulation frequencies. This pattern of results is consistent with the results of Eddins and Bero (2007). The shaded region displays the 95% confidence interval based on a group of 50 young, normal-hearing listeners who were inexperienced in psychoacoustic listening tasks and were unpracticed in the spectral modulation detection task (unpublished data). Most of the thresholds for the listeners of the current study fall within this range and thus may be characterized as having “typical” spectral envelope perception.
Figure 3.
Individual and average SMTFs for the five listeners in this study within the 95% confidence interval based on a group of 50 young, normal-hearing listeners (shaded region from unpublished data).
Vowel identification
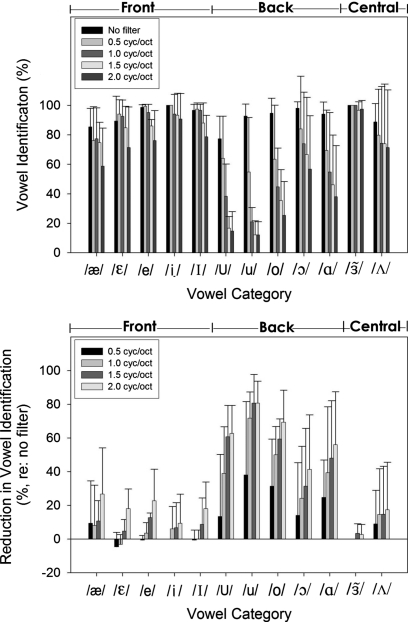
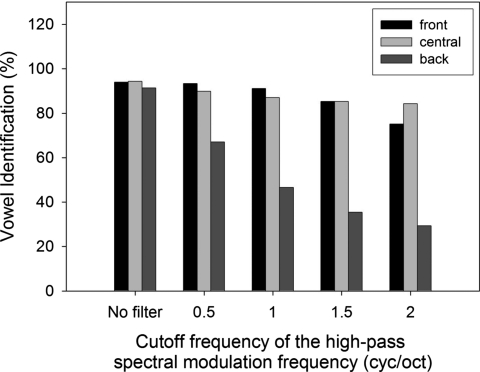
Figure 4 shows the identification scores associated with each vowel category along the x axis for the vowels with and without high-pass filtering in the spectral modulation frequency domain (the upper panel) and the reduction in vowel identification due to the spectral modulation filtering (the lower panel), as indicated by the bars. For all the 12 vowels, identification scores decreased as the cutoff frequency of the high-pass spectral modulation filter increased up to 2 cycles∕octave. Identification performance averaged across all vowel categories dropped dramatically as the high-pass filter cutoff increased from 0 cycle∕octave (leftmost black bars: 92.9%) to 2 cycles∕octave (rightmost shaded bars: 57.6%). The extent to which the identification performance decreased as a result of spectral modulation filtering was vowel specific (see the lower panel of Fig. 4). Attenuating low spectral modulation frequencies resulted in greater reductions in identification performance for the five back vowels (∕ɑ, ɔ, o, u, U∕) than the five front vowels (∕i, ɪ, e, ε, æ∕) or the two central vowels (∕ʌ, ∕). As summarized in Fig. 5, identification scores were quite similar for the front, back, and central vowels without filtering, while identification scores were markedly lower for the back vowels than the front or central vowels for the filtered conditions. Specifically, the three back vowels ∕o∕, ∕U∕, and ∕u∕ showed substantial degradation in identification with spectral modulation filtering while the vowels ∕∕ and ∕i∕ showed little effect of spectral modulation filtering.
Figure 4.
Identification score of the vowels with and without spectral modulation filtering for all the 12 vowels (the upper panel) and reduction in identification score (regarding the unfiltered condition) of the four filtered conditions for the 12 vowel categories (the lower panel). The error bar stands for the standard deviation across the five listeners for each condition.
Figure 5.
Identification score as a function of the cutoff frequency of high-pass spectral modulation filter for three vowel groups: front, central, and back.
A nonparametric repeated measure analysis (Friedman’s test) revealed that identification performance was significantly different across spectral modulation filtering conditions (chi square=113.465, p<0.001). Tukey multiple comparison tests indicated that vowel identification for the unfiltered vowels was significantly higher than any of the four filtered vowel conditions (all p<0.01). Separate nonparametric (Friedman’s test) analyses were computed for front, central, and back vowels, indicating a significant effect of spectral modulation filtering on vowel identification for the five front vowels (chi square=44.701, p<0.01) and the five back vowels (chi square=72.958, p<0.01) but not for the two central vowels (chi square=5.419, p=0.221). In addition, Tukey multiple comparison tests indicated that for the front vowels, the unfiltered vowels were significantly more identifiable than vowels with filter cutoff frequencies of 1.5 and 2.0 cycles∕octave (p<0.05) but not vowels filtered at 0.5 and 1.0 cycle∕octave (p>0.05). For the back vowels, all four filtered cutoff frequencies led to significantly lower identification scores than the unfiltered vowels (all p<0.05).
Confusion matrices for the unfiltered, 1 cycle∕octave, and 2 cycles∕octave filter conditions are provided in Table 1. Listeners showed few errors for the unfiltered vowels (upper section) while error rates increased and confusion was distributed more broadly across vowels as the high-pass cutoff frequency increased (middle and lower sections). In general, vowels were confused with their adjacent counterparts in the vowel space (see Fig. 6) and errors increased with filter cutoff frequency. For example, when the target vowel ∕æ∕ was presented, listeners responded ∕ε∕ incorrectly on 14% of the trials for the unfiltered condition. This error rate increased to 23% for the 1 cycle∕octave condition and 32% for the 2 cycles∕octave condition. As shown in Table 2, more vowels were added to the confusion list for each vowel as the filter cutoff frequency increased. In addition, the vowel most frequently confused with the target vowel in the unfiltered condition remained as the most frequently confused vowel for the filtered conditions. For example, identification of the intended vowel ∕U∕ was primarily confused with ∕o∕ in the unfiltered condition and was confused mainly with four vowels ∕e, i, o, ʌ∕ for the 2 cycles∕octave condition although the vowel ∕o∕ remained the most frequently confused vowel. Moreover, it should be noted that the confusion matrices showed asymmetry between front and back vowels. For the filtered conditions (e.g., 2 cycles∕octave), back vowels were frequently confused with front vowels (35.4%) while front vowels were rarely confused with back vowels (4.1%).
Table 1.
Confusion matrices for unfiltered vowels (top) and filtered vowels at 1 cycle∕octave (middle) and 2 cycles∕octave (bottom).
| Vowel | æ | ε | e | i | ɪ | U | u | o | ɔ | a | ə | Λ |
|---|---|---|---|---|---|---|---|---|---|---|---|---|
| æ | 85.3% | 14.0% | 0.7% | |||||||||
| ε | 8.0% | 89.3% | 0.7% | 0.7% | 1.3% | |||||||
| e | 0.7% | 98.6% | 0.7% | |||||||||
| i | 100.0% | |||||||||||
| ɪ | 2.7% | 0.7% | 96.6% | |||||||||
| U | 77.3% | 4.7% | 18.0% | |||||||||
| u | 7.3% | 92.7% | ||||||||||
| o | 4.7% | 94.6% | 0.7% | |||||||||
| ɔ | 98.0% | 2.0% | ||||||||||
| a | 2.0% | 94.0% | 4.0% | |||||||||
| ə | 100.0% | |||||||||||
| Λ | 11.3% | 88.7% | ||||||||||
| æ | 77.3% | 22.7% | ||||||||||
| ε | 6.3% | 92.5% | 0.7% | 0.5% | ||||||||
| e | 0.5% | 2.0% | 95.2% | 1.0% | 1.3% | |||||||
| i | 1.3% | 1.3% | 94.0% | 0.7% | 2.7% | |||||||
| ɪ | 2.0% | 1.3% | 96.7% | |||||||||
| U | 12.5% | 1.8% | 0.5% | 38.3% | 5.2% | 35.7% | 0.7% | 0.7% | 4.6% | |||
| u | 12.2% | 5.2% | 1.0% | 31.5% | 20.8% | 22.7% | 0.7% | 2.7% | 3.2% | |||
| o | 0.7% | 36.9% | 3.0% | 10.8% | 1.3% | 44.7% | 1.3% | 1.3% | ||||
| ɔ | 6.5% | 1.5% | 4.7% | 0.7% | 2.0% | 73.8% | 4.5% | 6.3% | ||||
| a | 10.0% | 0.5% | 1.0% | 0.7% | 2.7% | 54.7% | 30.4% | |||||
| ə | 100.0% | |||||||||||
| Λ | 9.5% | 1.5% | 0.5% | 14.3% | 74.2% | |||||||
| æ | 58.7% | 32.0% | 0.7% | 0.7% | 3.3% | 3.3% | 1.3% | |||||
| ε | 11.3% | 71.3% | 0.7% | 1.3% | 0.7% | 2.7% | 12.0% | |||||
| e | 0.7% | 1.3% | 76.0% | 13.3% | 2.7% | 4.0% | 2.0% | |||||
| i | 0.7% | 2.0% | 90.7% | 1.3% | 0.7% | 2.0% | 2.6% | |||||
| ɪ | 0.7% | 16.6% | 4.0% | 78.7% | ||||||||
| U | 0.7% | 24.0 | 9.3% | 1.3% | 14.7% | 4.0% | 32.0% | 2.6% | 4.0% | 0.7% | 6.7% | |
| u | 1.3% | 0.7% | 24.7% | 12.0% | 3.3% | 17.3% | 12.0% | 22.0% | 0.7% | 3.3% | 2.7% | |
| o | 0.7% | 52.0% | 3.3% | 7.3% | 4.7% | 0.7% | 25.3% | 2.7% | 2.0% | 1.3% | ||
| ɔ | 8.0% | 2.0% | 4.0% | 4.7% | 5.3% | 56.7% | 9.3% | 10.0% | ||||
| a | 12.0% | 1.3% | 2.0% | 2.6% | 0.7% | 4.7% | 38.0% | 38.7% | ||||
| ə | 2.0% | 0.7% | 97.3% | |||||||||
| Λ | 15.3% | 0.7% | 1.3% | 0.7% | 10.7% | 71.3% |
Figure 6.
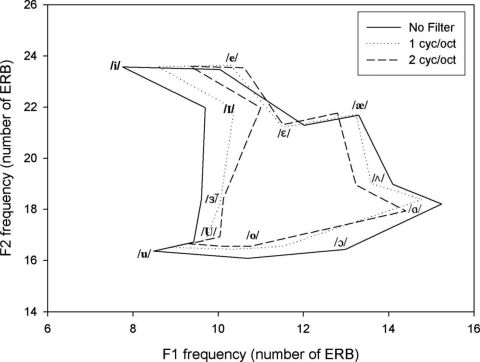
Steady-state F1 and F2 frequencies in ERB scale for unfiltered vowels and vowels filtered at 1 and 2 cycles∕octave.
Table 2.
Major confusion vowels (confusion percentage >5%) for unfiltered and filtered vowels. For multiple confusion vowels, the vowels that gave the highest confusion percentage were bold.
| Vowel | No filter | 0.5 | 1 | 1.5 | 2 |
|---|---|---|---|---|---|
| æ | ε | ε | ε | ε | ε |
| ε | æ | æ | æ | æ, ʌ | |
| e | ɪ | ɪ | |||
| i | |||||
| ɪ | ε | ||||
| U | o | u, o | e, u, o | e, u, o, ʌ | e, i, o, ʌ |
| u | U, o | e, i, U, o | e, U, o | e, i, U, o | |
| o | e, U | e, U | e, U | e | |
| ɔ | ʌ | æ, ʌ | æ, ɑ, ʌ | æ, ɑ, ʌ | |
| ɑ | æ, ʌ | æ, ʌ | æ, ʌ | æ, ʌ | |
| Λ | ɑ | æ, ɑ | æ, ɑ | æ, ɑ | æ, ɑ |
Correlation between SMTF, and vowel identification and its reduction
The error bars in Fig. 4 illustrate the variability across listeners in vowel identification and the associated reduction due to the spectral modulation filtering. Likewise, Fig. 3 reveals considerable variability in spectral modulation detection, particularly for low modulation frequencies. To examine the potential relationship between spectral modulation detection and vowel identification, correlation analyses were conducted between spectral modulation thresholds and vowel identification for the 12 individual vowel categories, the three vowel groups (front, back, and central), and for performance across all vowel groups. When collapsed across vowel category or vowel group, no significant correlations were obtained between spectral modulation thresholds and vowel identification (all p>0.05). Although these data do not indicate any relationship between spectral modulation detection and vowel identification associated with spectral modulation filtering, it is possible that the number of listeners in the present study was too small to reveal any underlying relationships.
Acoustic analyses
The progressive reduction in vowel identification scores with increasing high-pass spectral modulation cutoff frequency may result in simple changes in the acoustic signal (e.g., spectral contrast, tilt, and formant frequency shifts) or a series of acoustic changes that may or may not be vowel category dependent. This section will focus on the acoustic effects of spectral modulation filtering and the corresponding perceptual impact of those acoustic changes. The LPC spectra of all of the unfiltered and filtered vowels were obtained with the modified Colea MATLAB® code (Loizou, 2000) using 16 LPC coefficients over a 50 ms window of the vowel central nucleus. Formant frequency and amplitude, amplitude of the valleys adjacent to the first three formants (F1–F3), and spectral tilt were measured for all vowel spectra.
Formant frequency
Formant frequencies F1 and F2 for the unfiltered and filtered vowels were measured from the LPC vowel spectra. Because frequency is represented on a nonlinear scale by the auditory system, formant frequencies F1 and F2 were converted to an equivalent rectangular bandwidth (ERB) scale (Moore and Glasberg, 1987). A one-factor (filter) analysis of variance (ANOVA) with formant frequency (in ERB units) as the dependent variable indicated no significant change in formant frequency across filter conditions for either F1 (F4,44=0.361, p=0.835) or F2 (F4,44=1.671, p=0.174). As shown in Fig. 6, however, a nonsignificant difference in F1 may be due to the fact that F1 increased for vowels with low F1 frequency and decreased for vowels with high F1 frequency as the filter cutoff increased.1 In this case, the positive and negative changes canceled each other. The overall absolute change in formant frequency was 9.4% for F1 and was 1.4% for F2 for the 2 cycles∕octave filter condition. A one-factor (filter) ANOVA based on the absolute percent change in formant frequency indicated significant change in formant frequency with spectral modulation filtering for both F1 (F4,44=24.071, p<0.05) and F2 (F4,44=6.202, p<0.05). Post hoc (Tukey) tests showed that all four filter conditions resulted in significant changes in formant frequency (all p values <0.05). The F1×F2 vowel space also was reduced as the high-pass filter cutoff frequency increased from 1 to 2 cycles∕octave (i.e., differences among F1 frequencies were reduced; see Fig. 6). Specifically, the back vowels were much closer in the vowel space for the 2 cycles∕octave filter condition than for the unfiltered condition. Thus, it is possible that reduced vowel identification for back vowels could partially, if not all, result from increased crowding in the vowel space produced by high-pass filtering in the spectral modulation domain.
Spectral contrast for formants
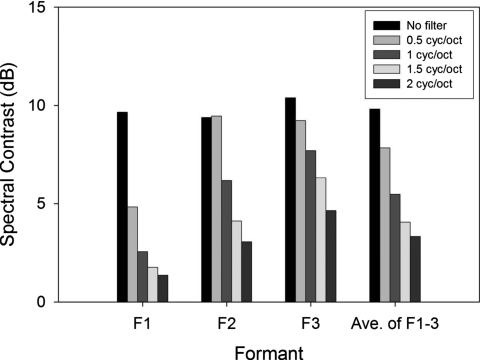
As shown in Fig. 1, spectral (peak-to-valley) contrast, especially for F1 and F2, was progressively reduced as the attenuation of spectral modulation frequencies increased from low to high. The spectral contrast of vowel formants based on LPC spectra was computed as follows. The amplitudes corresponding to the valley below F1, between F1 and F2, between F2 and F3, and between F3 and F4 were defined as V1, V2, V3, and V4, respectively (see Fig. 2). The amplitudes corresponding to the spectral peaks were defined as F1–F3. Because each formant has two adjacent valleys, one below and one above the peak, the spectral contrast for F1–F3 was computed as the average of the two peak-to-valley contrasts (e.g., the average of F2-V2 and F2-V3 for F2), for all the unfiltered and filtered vowels. The overall spectral contrast for F1–F3 for the unfiltered and filtered conditions is shown in Fig. 7. Spectral contrast was substantially reduced for F1–F3. Specifically, as the filter cutoff frequency increased from 0.0 to 2.0 cycles∕octave, the spectral contrast decreased from 9.7 to 1.4 dB for F1, from 9.4 to 3.0 dB for F2, and from 10.4 to 4.6 dB for F3. A one-way ANOVA indicated that spectral modulation filtering significantly reduced spectral contrast for all three formants (F1, F4,44=37.782, p<0.05; F2, F4,44=10.339, p<0.05; F3, F4,44=11.631, p<0.05). Tukey post hoc tests revealed a significant difference in spectral contrast for F1 between the unfiltered vowels and all four filtered vowels (all p values <0.05), while the decrease in spectral contrasts for F2 and F3 was significant only for the 1.0, 1.5, and 2.0 cycles∕octave filter conditions (p<0.05). Given that normal-hearing listeners needed a minimum of 3 dB F1 and F2 spectral contrasts to identify synthetic vowels with 90% accuracy (Leek et al., 1987), the reduction in F1 and F2 spectral contrasts is consistent with the decrease in vowel identification with increasing spectral modulation filtering.
Figure 7.
Average spectral (peak-to-valley) contrasts in decibels over the 12 vowels for F1, F2, and F3, respectively, and for average of F1, F2, and F3 at the five cutoff frequencies of high-pass spectral modulation filter.
Spectral tilt
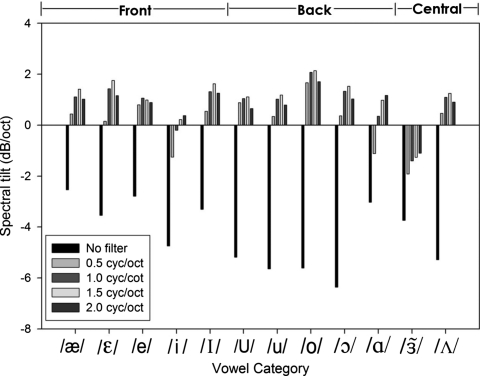
Figure 2 also shows a reduction in spectral tilt with increasing the spectral modulation filter cutoff frequency. Spectral tilt was computed for unfiltered and filtered vowels by calculating the dB∕octave difference between F1 and F3 peak amplitudes following Kiefte and Kluender (2005). As shown in Fig. 8, spectral tilt was negative for the unfiltered vowels and approached or exceeded zero as the filter cutoff frequency increased to 2 cycles∕octave. A one-way (filter) ANOVA indicated a significant effect of high-pass spectral modulation filter cutoff on spectral tilt (F4,44=49.773, p<0.05). A Tukey post hoc test revealed that the spectral tilt for unfiltered vowels was significantly more negative than for vowels filtered at 0.5, 1.0, 1.5, and 2.0 cycles∕octave (all p values <0.05).
Figure 8.
Spectral tilt of the vowels at the five cutoff frequencies of high-pass spectral modulation filter for all the 12 vowels.
Correlation between acoustic features and vowel identification
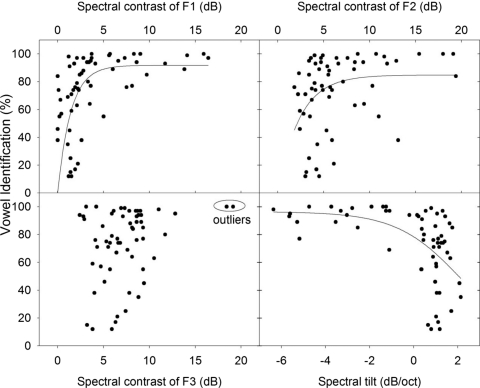
Correlational analyses were conducted to assess the potential relationships among vowel identification scores and various local acoustic features modified as a result of filtering in the spectral modulation domain including local F1–F3 spectral contrasts as well as spectral tilt. There were modest but significant correlations between vowel identification and each acoustic feature (see Fig. 9, all ∣r∣<0.5; all p<0.05) except the spectral contrast of F3 when the two obvious outlying points (see oval in the lower left panel of Fig. 9) were removed (p=0.135). Given that vowel identification scores ranged from 0% to 100%, nonlinear exponential regression, rather than linear regression, was then undertaken to reveal the detailed relationship between vowel identification and acoustic features. Nonlinear regressions, based on the 12 vowel categories and 5 filter conditions (i.e., unfiltered and four high-pass filtered conditions), were computed with vowel identification scores, averaged over five listeners, as the dependent variable and four acoustic features, including the spectral contrast associated with F1–F3 as well as spectral tilt, as independent variables. The two outlying data points associated with F3 contrast again were removed for the regression analysis. As shown in Fig. 9, regressions based on an exponential fit were significant for the spectral contrast associated with F1 and F2 and the spectral tilt variables (all p<0.05), but not for the spectral contrast associated with F3. These results indicate that the degradation in vowel identification for this female talker was associated with reductions in F1 and F2 contrasts and increases in spectral tilt that resulted from filtering in the spectral modulation domain.
Figure 9.
Scatter plots and nonlinear exponential regression functions showing the relationship between vowel identification averaged over five listeners and four acoustic features computed from the vowel stimuli including F1 contrast (upper left), F2 contrast (upper right), F3 contrast (lower left), and spectral tilt (lower right). The exponential fit for F3 is not shown due to the lack of a significant regression.
DISCUSSION
The present study investigated the acoustic and perceptual impact of attenuating the low spectral modulation components of vowels by progressively increasing the high-pass cutoff frequency of a simple Butterworth high-pass filter applied in the spectral modulation frequency domain. The results showed that the presence of spectral-modulation frequencies below 2 cycles∕octave was important in preserving the basic spectral features of vowels that are required for identification (i.e., spectral contrast and spectral tilt). Attenuating spectral modulation frequencies up to 2 cycles∕octave resulted in a dramatic and progressive reduction in vowel identification performance, especially for back vowels. In addition to reducing F1 and F2 spectral contrasts and increasing spectral tilt, the effect of these spectral changes produced a more crowded vowel space.
American English is one of the world’s languages with a relatively crowded vowel space, typically characterized by considerable spectral overlap in the two-dimensional F1×F2 vowel formant space (Peterson and Barney, 1952; Hillenbrand et al., 1995). Studies of clear speech indicate that the broader F1×F2 vowel space of clear speech leads to significant improvement in the identification of isolated vowels by normal-hearing and hearing-impaired listeners (Ferguson and Kewley-Port, 2002). As shown in Fig. 6, the manipulation of spectral modulation filter cutoff frequency in this study produced a more crowded vowel space, consistent with greater confusion among vowels, especially back vowels. Indeed, the four back vowels, ∕ɔ, o, u, U∕, were more closely spaced in the F1×F2 vowel space for the 2 cycles∕octave than the unfiltered condition, consistent with the perceptual confusions among these back vowels reported in Tables 1, 2.
Another important acoustic feature that was substantially affected by spectral modulation filtering was the spectral contrast associated with the vowel formants. As shown in Fig. 7, increases in the high-pass cutoff frequency resulted in a decrease in the spectral contrast that varied across F1–F3. Averaging across the three formants, the spectral contrast ranged from 9.8 (no filtering) to 3.3 dB (2 cycles∕octave filter). Several previous studies directly manipulated the spectral contrast corresponding to formant frequencies and reported vowel identification performance ranging from 75% to 82% correct for contrast values of between 1 and 3 dB (Summerfield et al., 1987; Leek et al., 1987; Alcantara and Moore, 1995). By comparison, average vowel identification (across 12 vowels) for the 0.5 cycle∕octave filter condition reported here was 78.5% correct and corresponded to an average formant spectral contrast of 7.8 dB. Clearly, the spectral contrast required to produce ∼78% correct was much higher in the present study relative to the previous studies cited. There are several methodological and acoustic differences between the present and previous studies that may contribute to differences in the contrast associated with approximately 78% correct performance, perhaps the most important of which are the number of vowel categories (12 versus 4, 5, or 6), the stimulus type (resynthesized natural speech versus uniform harmonic complexes with formantlike peaks), and the fact that changes in addition to spectral contrast were present in the current study. Specifically, the spectral envelopes of the 12 vowels in the present study were highly irregular, whereas the spectral envelopes in the previous studies were flat with the exception of equal-amplitude increments in the two harmonics closest to the F1–F3 frequencies. This distinction in some respects is similar to the detection of spectral features in low versus high uncertainty conditions (e.g., Neff and Green, 1987), where several spectral features contributed to the uncertainty in the present task.
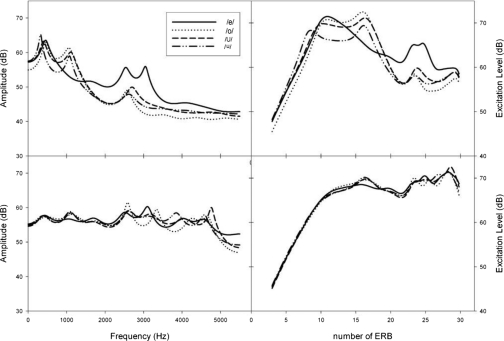
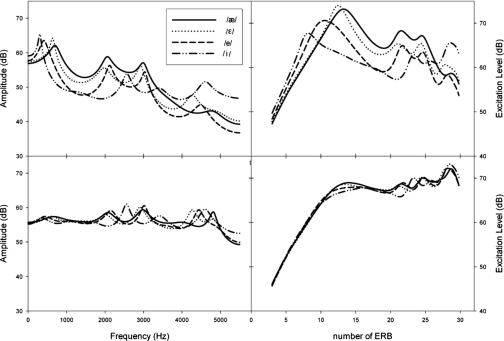
Figure 10 shows the LPC spectra (left) and excitation patterns (right) of four vowels, ∕e, ɑ, o, u∕, without filtering and high pass filtered at 2 cycles∕octave. Excitation patterns for the four vowels were calculated following Moore and Glasberg’s procedure (1987). Formant peaks F1 and F2 are well represented in the excitation patterns for unfiltered vowels (upper right panel) but are poorly represented in the excitation patterns for filtered vowels (lower right panel), with F1 and F2 merging into one spectral prominence. Thus, compared to the internal representation of the unfiltered vowels, high-pass filtering at 2.0 cycles∕octave resulted in very similar excitation patterns for the four vowels. This is consistent with the fact that the four vowels were highly confused with each other in the 2.0 cycles∕octave condition, even though the vowel ∕e∕ was relatively distant from the other three vowels in the F1×F2 vowel space (see Fig. 5). These analyses also highlight the fact that analyses of the internal representation of various stimuli may provide much more information than analyses of the acoustic features themselves. For the three back vowels ∕ɑ, o, u∕ filtered at 2.0 cycles∕octave, the acoustic analyses above demonstrated that the small spectral contrasts and closely spaced F1 and F2 peaks are not preserved by the peripheral transformations of the auditory system emulated in the excitation pattern computations. Rather, those peaks are merged into single spectral prominences that differ little among the vowels. Similar comparisons of the LPC spectra (left) and excitation patterns (right) for the four front vowels, ∕æ, ε, i, ɪ∕, without filtering and high pass filtered at 2 cycles∕octave are shown in Fig. 11. The excitation patterns of the filtered vowels ∕æ∕ and ∕ε∕ are quite similar to each other, consistent with the perceptual measures indicating that these two vowels were highly confused with each other (see Table 1, lower section). Unlike the back vowels that showed merged F1 and F2 peaks in the excitation patterns (see Fig. 10), both F1 and F2 peaks for the four front vowels were fairly well preserved in the excitation patterns for the 2 cycles∕octave condition even though the spectral contrasts were substantially reduced (lower right panel of Fig. 11). This is consistent with the perceptual measures indicating relatively high intelligibility (>75% on average) for the front vowels even in the 2 cycles∕octave condition.
Figure 10.
LPC spectra (left) and excitation patterns (right) for the unfiltered vowels (top), ∕e, ɑ, o, u∕, and the same four vowels filtered at 2 cycles∕octave (bottom).
Figure 11.
LPC spectra (left) and excitation patterns (right) for the unfiltered front vowels (top), ∕i, e, ε, æ∕, and the same four vowels filtered at 2 cycles∕octave (bottom).
The decreased vowel identification associated with the reduction in spectral contrast reported here is consistent with previous studies of spectral smearing (ter Keurs et al., 1992, 1993; Drullman et al., 1996), although the techniques that led to reduced spectral contrast were quite different in these studies. In the experiments reported by ter Keurs et al. (1992, 1993), the spectral envelope was convolved with a Gaussian-shaped filter of fixed relative bandwidth, whereas the study of Drullman et al. (1996) produced spectral smearing by either low-pass or high-pass filtering the temporal envelope. The fact that the different acoustic manipulations of all these studies resulted in a reduction in spectral contrast and an associated decrease in vowel identification indicates that spectral contrast, especially for F1 and F2, is a critical factor in vowel perception.
Spectral tilt is another acoustic feature that was significantly altered by spectral modulation filtering. As described in the Introduction, spectral tilt significantly affects vowel quality (Ito et al., 2001; Kiefte and Kluender, 2005), especially when the time-varying acoustic features of the vowels are not preserved (e.g., Kiefte and Kluender, 2005). Because the formant and fundamental frequencies of the vowels were time invariant in this study, the increased spectral tilt for the filtered vowels relative to the unfiltered vowels may have contributed to the decrease in vowel identification with increasing filter cutoff frequency. This is consistent with the relationship between vowel identification and spectra tilt, as shown in Fig. 9. For each of the three vowel groups: front, central, and back vowels, vowel identification was significantly correlated with spectral tilt (r=−0.422 for front, −0.797 for central, and −0.703 for back, p<0.05), indicating the importance of spectral tilt in vowel perception. In addition, as explained above, spectral tilt differed by about 100% between the original front and back vowels, but differed by only 10% between the front and back vowels for the 2 cycles∕octave filter condition. Such changes in spectral tilt were associated with the finding that back vowels were confused with front vowels much more frequently (35.4%) for the two cutoff filter condition than for the unfiltered condition (0%; see Tables 1, 2), consistent with the interpretation that spectral tilt is a contributing factor in the discrimination of front versus back vowels. These results were consistent with Kiefte and Kluender (2005) who reported that the identification of synthetic vowels with greater (i.e., more negative) spectral tilt was biased toward back vowels relative to front vowels. For example, using synthetic vowels with F1 and F2 frequencies characteristic of a typical ∕u∕ vowel, they systematically varied the spectral tilt from that of a typical ∕u∕ vowel to that of a typical ∕I∕ vowel (i.e., from a steep negative slope to a shallower slope). Identification score of the ∕u∕ vowel was approximately 10% greater for the typical ∕u∕ spectral tilt than for the typical ∕I∕ spectral tilt (see their Fig. 4), illustrating the use of spectral tilt as a cue for vowel identity.
In summary, the global spectral shape of English vowels was modified by high-pass filtering in the spectral modulation domain. Acoustic analyses comparing unfiltered and filtered vowels revealed consistent reductions in spectral contrast, increased spectral tilt, and a slightly smaller F1×F2 vowel space. These changes in the global spectral shape were associated with perceptual changes marked by dramatic reductions in vowel identification performance, indicating that global spectral features are critical for vowel identification (Zahorian and Jagharghi, 1993; Blandon and Lindblom, 1981). Furthermore, these results demonstrate that systematic changes in the spectral modulation domain lead to systematic changes in both vowel identification and a set of local acoustic parameters that are individually related to vowel identification. Conversely, these results indicate that spectral modulation frequencies below 2 cycles∕octave are important for preserving the spectral features of vowels that contribute to accuracy in vowel identification. The extent to which listeners with poor vowel identification performance (e.g., hearing-impaired listeners) exhibit reductions in both spectral shape perception and corresponding changes in similar local spectral features is unknown but currently under study. The demonstration of a systematic relationship between parametric manipulations in the spectral modulation domain below 2.0 cycles∕octave and vowel identification performance leads to the interesting possibility that gain within the same range of spectral modulation frequencies might improve vowel perception, particularly in the presence of competing sounds or for listeners who have reduced frequency selectivity and∕or spectral shape perception.
ACKNOWLEDGMENTS
The authors are grateful to two anonymous reviewers and Dr. Mitchell Sommers for their constructive and detailed comments on the earlier version of the manuscript. Research was supported by NIH NIDCD R01 DC04403 and NIA P01 AG09524.
Portions of the data were presented at the 147th meeting of the Acoustical Society of America (J. Acoust. Soc. Am. 115, 2231).
Footnotes
Spectral modulation frequency quantifies the relative distance between spectral features such as intensity peaks (e.g., formants). Changes in the modulation depth (spectral contrast) at several spectral modulation frequencies, as a consequence of high-pass filtering in the spectral modulation domain, for example, can result in changes in the distance among spectral peaks. In terms of vowel stimuli, this can result in formant shifts.
References
- Alcantara, J., and Moore, B. (1995). “The identification of vowel-like harmonic complexes: Effects of component phase, level, and fundamental frequency,” J. Acoust. Soc. Am. 10.1121/1.412396 97, 3813–3824. [DOI] [PubMed] [Google Scholar]
- ANSI (2004). “Specification for Audiometers,” ANSI Report No. S3.6-2004, ANSI, New York.
- Baer, T., and Moore, B. C. J. (1993). “Effects of spectral smearing on the intelligibility of sentences in noise,” J. Acoust. Soc. Am. 10.1121/1.408176 94, 1229–1241. [DOI] [PubMed] [Google Scholar]
- Baer, T., and Moore, B. C. J. (1994). “Effects of spectral smearing on the intelligibility of sentences in the presence of interfering speech,” J. Acoust. Soc. Am. 10.1121/1.408640 95, 2277–2280. [DOI] [PubMed] [Google Scholar]
- Bladon, R. A. W. (1982). “Arguments against formants in the auditory representation of speech,” in The Representation of Speech in the Peripheral Auditory System, edited by Carlson R. and CrantrÖm B. (Elsevier Biomedical, Amsterdam: ), pp. 95–102. [Google Scholar]
- Blandon, R. A. W., and Lindblom, B. (1981). “Modeling the judgment of vowel quality differences,” J. Acoust. Soc. Am. 10.1121/1.385824 69, 1414–1422. [DOI] [PubMed] [Google Scholar]
- Drullman, R., Festen, J. M., and Plomp, R. (1994a). “Effect of temporal envelope smearing on speech perception,” J. Acoust. Soc. Am. 10.1121/1.408467 95, 1053–1064. [DOI] [PubMed] [Google Scholar]
- Drullman, R., Festen, J. M., and Plomp, R. (1994b). “Effect of reducing slow temporal modulations on speech perception,” J. Acoust. Soc. Am. 10.1121/1.409836 95, 2670–2680. [DOI] [PubMed] [Google Scholar]
- Drullman, R., Festen, J. M., and Houtgast, T. (1996). “Effect of temporal modulation reduction on spectral contrasts in speech,” J. Acoust. Soc. Am. 10.1121/1.415423 99, 2358–2364. [DOI] [PubMed] [Google Scholar]
- Eddins, D. A., and Bero, E. M. (2007). “Spectral modulation detection as a function of modulation frequency, carrier bandwidth, and carrier frequency region,” J. Acoust. Soc. Am. 10.1121/1.2382347 121, 363–372. [DOI] [PubMed] [Google Scholar]
- Ferguson, S. H., and Kewley-Port, D. (2002). “Vowel intelligibility in clear and conversational for normal-hearing and hearing-impaired listeners,” J. Acoust. Soc. Am. 10.1121/1.1482078 112, 259–271. [DOI] [PubMed] [Google Scholar]
- Fu, Q., and Nogaki, G. (2005). “Noise susceptibility of cochlear implant users: the role of spectral resolution and smearing,” J. Assoc. Res. Otolaryngol. 6, 19–27. [DOI] [PMC free article] [PubMed] [Google Scholar]
- Hillenbrand, J., Getty, L. J., Clark, M. J., and Weeler, K. (1995). “Acoustic characteristics of American English vowels,” J. Acoust. Soc. Am. 10.1121/1.411872 97, 3099–3111. [DOI] [PubMed] [Google Scholar]
- Hillenbrand, J. M., and Nearey, T. (1999). “Identification of resynthesized ∕hVd∕ utterances: effects of formant contour,” J. Acoust. Soc. Am. 10.1121/1.424676 105, 3509–3523. [DOI] [PubMed] [Google Scholar]
- Ito, M., Tsuchida, J., and Yano, M. (2001). “On the effectiveness of whole spectral shape for vowel perception,” J. Acoust. Soc. Am. 10.1121/1.1384908 110, 1141–1149. [DOI] [PubMed] [Google Scholar]
- Kawahara, H., Masuda-Kastuse, I., and Cheveigne, A. (1999). “Restructuring speech representations using a pitch-adaptive time-frequency smoothing and an instantaneous-frequency-based F0 extraction: possible role of a repetitive structure in sounds,” Speech Commun. 10.1016/S0167-6393(98)00085-5 27, 187–207. [DOI] [Google Scholar]
- Kiefte, M., and Kluender, K. (2005). “The relative importance of spectra tilt in monophthongs and diphthongs,” J. Acoust. Soc. Am. 10.1121/1.1861158 117, 1395–1404. [DOI] [PubMed] [Google Scholar]
- Leek, M. R., Dorman, M. F., and Summerfield, Q. (1987). “Minimum spectral contrast for vowel identification by normal-hearing and hearing-impaired listeners,” J. Acoust. Soc. Am. 10.1121/1.395024 81, 148–154. [DOI] [PubMed] [Google Scholar]
- Levitt, H. (1971). “Transformed up-down methods in psychoacoustics,” J. Acoust. Soc. Am. 10.1121/1.1912375 49, 467–477. [DOI] [PubMed] [Google Scholar]
- Liu, C., and Fu, Q. (2007). “Estimation of vowel recognition with cochlear implant simulations,” IEEE Trans. Biomed. Eng. 10.1109/TBME.2006.883800 54, 74–81. [DOI] [PubMed] [Google Scholar]
- Loizou, P. (2000). CILEA: A Matlab software tool for speech analysis available: http://www.utdallas.edu/~loizou/speech/colea.htm (accessed 8/15/07).
- Miller, J. D. (1989). “Auditory-perceptual interpretation of the vowel,” J. Acoust. Soc. Am. 10.1121/1.397862 85, 2114–2134. [DOI] [PubMed] [Google Scholar]
- Moore, B. C. J., and Glasberg, B. R. (1987). “Formulae describing frequency selectivity as a function of frequency and level, and their use in calculating excitation patterns,” Hear. Res. 10.1016/0378-5955(87)90050-5 28, 209–225. [DOI] [PubMed] [Google Scholar]
- Moore, B. C. J., Vickers, D. A., Glasberg, B. R., and Baer, T. (1997). “Comparison of real and simulated hearing impairment subjects with unilateral and bilateral cochlear hearing loss,” Br. J. Audiol. 31, 227–245. [DOI] [PubMed] [Google Scholar]
- Nearey, T. M. (1989). “Static, dynamic, and relational properties in vowel perception,” J. Acoust. Soc. Am. 10.1121/1.397861 85, 2088–2113. [DOI] [PubMed] [Google Scholar]
- Neff, D. L., and Green, D. M. (1987). “Masking produced by spectral uncertainty with multicomponent maskers,” Percept. Psychophys. 41, 409–415. [DOI] [PubMed] [Google Scholar]
- Peterson, G. E., and Barney, H. L. (1952). “Control method used in a study of the vowels,” J. Acoust. Soc. Am. 10.1121/1.1906875 24, 175–184. [DOI] [Google Scholar]
- Qian, J., and Eddins, D. A. (2008). “The role of spectral cues in virtual sound localization revealed by spectral modulation filtering and enhancement,” J. Acoust. Soc. Am. 10.1121/1.2804698 123, 302–314. [DOI] [PubMed] [Google Scholar]
- Summerfield, A. Q., Sidwell, A., and Nelson, T. (1987). “Auditory enhancement of changes in spectral amplitude,” J. Acoust. Soc. Am. 10.1121/1.394838 81, 700–708. [DOI] [PubMed] [Google Scholar]
- Syrdal, A. K., and Gopal, H. S. (1986). “A perceptual model of vowel recognition based on the auditory representation of American English vowels,” J. Acoust. Soc. Am. 10.1121/1.393381 79, 1086–1100. [DOI] [PubMed] [Google Scholar]
- ter Keurs, M., Festen, J. M., and Plomp, R. (1992). “Effect of spectral envelope smearing on speech reception. I,” J. Acoust. Soc. Am. 10.1121/1.402950 91, 2872–2880. [DOI] [PubMed] [Google Scholar]
- ter Keurs, M., Festen, J. M., and Plomp, R. (1993). “Effect of spectral envelope smearing on speech reception. II,” J. Acoust. Soc. Am. 10.1121/1.406813 93, 1547–1552. [DOI] [PubMed] [Google Scholar]
- Turner, C. W., Chi, S. L., and Flock, S. (1999). “Limiting spectral resolution in speech for listeners with sensorineural hearing loss,” J. Speech Lang. Hear. Res. 42, 773–784. [DOI] [PubMed] [Google Scholar]
- van Veen, T. M., and Houtgast, T. (1985). “Spectral sharpness and vowel dissimilarity,” J. Acoust. Soc. Am. 10.1121/1.391880 77, 628–634. [DOI] [PubMed] [Google Scholar]
- Zahorian, S., and Jagharghi, A. (1993). “Spectral-shape feature versus formant as acoustic correlates for vowels,” J. Acoust. Soc. Am. 10.1121/1.407520 94, 1966–1982. [DOI] [PubMed] [Google Scholar]


