

Abstract
The central role of T cells in the induction of immunological tolerance against i.v. Ags has been well documented. However, the role of dendritic cells (DCs), the most potent APCs, in this process is not clear. In the present study, we addressed this issue by examining the involvement of two different DC subsets, CD11c+ CD11b+ and CD11c+ CD8+ DCs, in the induction of i.v. tolerance. We found that mice injected i.v. with an autoantigen peptide of myelin oligodendrocyte glycoprotein (MOG) developed less severe experimental autoimmune encephalomyelitis (EAE) following immunization with MOG peptide but presented with more CD11c+ CD11b+ DCs in the CNS and spleen. Upon coculturing with T cells or LPS, these DCs exhibited immunoregulatory characteristics, including increased production of IL-10 and TGF-β but reduced IL-12 and NO; they were also capable of inhibiting the proliferation of MOG-specific T cells and enhancing the generation of Th2 cells and CD4+ CD25+ Foxp3+ regulatory T cells. Furthermore, these DCs significantly suppressed ongoing EAE upon adoptive transfer. These results indicate that CD11c+ CD11b+ DCs, which are abundant in the CNS of tolerized animals, play a crucial role in i.v. tolerance and EAE and may be a candidate cell population for immunotherapy of autoimmune diseases.
Intravenous injection of soluble proteins can induce Ag-specific tolerance or deviation to helper/inflammatory T cell immunity (1). In animal models, it has been shown that i.v. tolerance effectively ameliorates experimental autoimmune diseases (2–4), experimental autoimmune encephalomyelitis (EAE),3 an animal model of multiple sclerosis, is a T cell-mediated auto-immune disease of the CNS. Autoreactive T cells directed against myelin Ags produce high levels of proinflammatory cytokines (2, 3, 5), whereas resistance to, or recovery from the disease can be mediated through Th2 and regulatory T (Treg) cell responses (3, 6, 7). Induction of i.v. tolerance with specific autoantigen can be accomplished by administration of the Ag in a variety of tolerogenic forms, including soluble protein/peptide and Ag-coupled splenocytes. Clonal deletion, anergy of Ag-specific T cells and induction of Th2/Treg cells are the main mechanisms known to be involved in the induction of i.v. tolerance (8, 9).
Dendritic cells (DCs) are professional APCs that play an important role in Th differentiation and thus are involved in the induction of both autoimmunity and tolerance (10, 11). DCs provide Th cells not only with Ag (signal 1) and costimulation (signal 2), but also with a polarizing signal (signal 3), such as IL-10 and IL-12 (11) DCs are heterogeneous in their phenotype and their localization in the spleen (12). There are two distinct subsets of DCs in murine spleen (13): ~25% of DCs are of the CD8+ CD11b− phenotype, whereas the majority of DCs in the spleen are CD8− CD11b+ DCs (~70%). CD8+ CD11b− DCs are of lymphoid lineage and mainly reside in T cell-rich periarteriolar lymphatic sheaths. In contrast, CD8− CD11b+ DCs are of myeloid lineage, and reside in spleen marginal zones (14). Myeloid and lymphoid subsets of murine DCs are able to shift cytokine responses of T cells toward Th2 and Th1 profiles, respectively (10, 15, 16).
DCs can activate T cells and trigger their differentiation into regulatory T cells following exposure to Ag. Once activated, regulatory T cells can engage in bystander suppression, whereby they suppress immune responses in an Ag-independent manner via cell-cell contact or by the secretion of inhibitory cytokines such as IL-10 and TGF-α (17). However little is known about the efficiency of DC subsets administered via i.v. routes to induce peripheral tolerance in experimental autoimmune diseases, and the mechanisms by which DC subsets induce i.v. tolerance have not yet been elucidated. Following i.v. injection, DCs mainly accumulate in the spleen where they can influence T cell mediated immune responses (12). It has been reported that the ratio of specific DC subsets changes during the induction of i.v. and oral tolerance in various autoimmune diseases, such as experimental collagen-induced arthritis and NOD mice (18, 19).
In the present study, we identify a tolerogenic DC subset in the CNS and spleen of EAE mice that plays an important role in the induction of T regulatory cells in i.v. tolerance. To elucidate the role of different DC subsets in i.v. tolerance, we characterized DCs from the CNS and spleen of C57BL/6 mice after induction of i.v. tolerance against EAE. The biological and molecular characteristics of CD11c+ CD11b+ DCs and CD11c+ CD8α+ DCs were investigated both in vitro and in vivo. Our results demonstrate that the CD11c+ CD11b+ subset has tolerogenic characteristics. The increase in the proportion of this subset closely correlates with the induction of i.v. tolerance, and effectively suppresses EAE. These results suggest that the CD11c+ CD11b+ subset could be exploited for immunotherapy of autoimmune diseases.
Materials and Methods
Mice and Ag
Female C57BL/6 mice, 8–10 wk of age, were purchased from The Jackson Laboratory. All mice were housed in Thomas Jefferson University animal care facilities. All work was performed in accordance with the Thomas Jefferson University guidelines for animal use and care. Mouse MOG35–55 peptide (MEVGWYRSPFSRVVHLYRNGK) was purchased from Invitrogen.
Induction of EAE and i.v. tolerance
Mice were injected s.c. with 200 μg of MOG35–55 in CFA containing 5 mg/ml Mycobacterium tuberculosis H37Ra (Difco) over two sites on the back. All mice received 200 ng of pertussis toxin (List Biological Laboratories) i.p. on days 0 and 2 postimmunization (p.i.). To induce i.v. tolerance, MOG35–55 (200 μg/mouse) was i.v. injected on days 3, 5, and 7 p.i., and mice that received the same volume (100 μl) of PBS i.v. in parallel served as controls. EAE was scored according to the following clinical scoring system (5): 1, limp tail or waddling gait with tail tonicity; 2, waddling gait with limp tail (ataxia); 2.5, ataxia with partial limb paralysis; 3, full paralysis of one limb; 3.5, full paralysis of one limb with partial paralysis of second limb; 4, full paralysis of 2 limbs; 4.5, moribund; and 5, death. Mice were examined daily in a blind fashion for signs of EAE.
Histopathology
On weeks 3 p.i., mice were extensively perfused with ice-cold PBS with 2 U/ml heparin (Sigma-Aldrich), and spinal cords were harvested. Sections (5 μm) were stained with H&E or Luxol fast blue (myelin stain). Slides were assessed in a blind fashion for inflammation and demyelination as documented previously (5). Briefly inflammation: 0, none; 1, a few inflammatory cells; 2, organization of perivascular infiltrates; and 3, increasing severity of perivascular cuffing with extension into the adjacent tissue. For demyelination: 0, none; 1, rare foci; 2, a few areas of demyelination; 3, large (confluent) areas of demyelination.
Isolation of mononuclear cells (MNCs), flow cytometry, and measurement of proliferative responses
MNCs from spleen of MOG-i.v. and PBS-i.v. EAE mice were isolated on day 21 p.i. Erythrocytes in the cell pellets from spleen were hemolyzed by adding NH4Cl-Tris buffer for 5 min at room temperature followed by washing. For flow cytometry, these cells were incubated with Abs to murine CD11b, CD11c, CD8α, I-A, CD40, CD80, CD86, CD4, and CD25 (all obtained from BD Pharmingen). For proliferative response, these cells were suspended in complete RPMI 1640 with 10% FCS at a density of 2.5 × 10⁶/ml. Triplicate aliquots (200 μl) of MNC suspensions were added to 96-well round-bottom microtiter plates (Nunc) and cultured in the presence or absence of MOG35–55 (10 μg/ml). After 60 h of incubation, cells were pulsed for 12 h with 1 μCi of [3H]methylthymidine (specific activity 42 Ci/mmol). Cells were harvested on fiberglass filters, and thymidine incorporation was measured using a scintillation counter. Results were expressed as cpm from culture in the presence of Ag and without Ag.
Isolation of CNS cells and flow cytometry
MNCs from the CNS of MOG35–55-immunized mice were isolated by Percoll gradient centrifugation as previously described (20) at the peak of clinical disease (day 21 p.i.). In brief, mice were sacrificed and transcardially perfused with ice-cold GKN solution with 2 U/ml heparin (Sigma-Aldrich). Spinal cords were removed into GKN/0.02% BSA (w/v), mechanically dissociated through a 100-μm cell strainer, and enzymatically digested by incubation with 250 μg/ml collagenase/dispase and 250 μg/ml DNase I (Roche) at 37°C for 20–30 min. The digested CNS preparation was washed with GKN/BSA, and the pellet was fractionated on a 70/37/30% Percoll gradient. MNCs were recovered from the 37/70 interface, washed, and resuspended in RPMI 1640 with 10% FCS. Pooled cells were washed in FACS buffer. After blocking with anti-CD16/32 Abs, cells were incubated with Abs to murine CD11b, CD11c, CD8α, I-A, CD40, CD80, CD86, CD4, and CD25 (all obtained from BD Pharmingen).
Intracellular cytokine staining
Splenocytes and CNS cells were isolated and suspended in complete RPMI 1640 with 10% FCS at a density of 2.5 × 10⁶/ml. The MNC suspensions were restimulated with PMA (50 ng/ml), ionomycin (500 ng/ml) (Sigma-Aldrich) and treated with GolgiStop (1 μg/106 cells) (BD Pharmingen) for 4 h. Cells were harvested, washed in staining buffer containing 1% FCS, 0.1% NaN3 in PBS and blocked with anti-CD16/CD32 Abs. Following another wash step, cells were stained with fluorescently labeled Abs to CD11b, CD11c, and CD8α for 30 min in the dark at 4°C. Cells were washed, fixed, and permeabilized using Fix and Perm cell permeabilization reagents (Caltag Laboratories). Cells were stained for intracellular cytokines with PE-conjugated rat anti-mouse IL-10 and IL-12 Abs. Intracellular Foxp3 (eBioscience) was determined according to the manufacturer’s instruction. All flow cytometric analyses were performed using appropriate isotype controls. All Abs except Foxp3 Ab were purchased from BD Pharmingen. Data were acquired on a FACSAria (BD Biosciences) and analyzed using FlowJo software.
Purification of DC subsets, RT-PCR, and coculture with MOG-reactive T cells
DCs from spleen were prepared as previously described (21). In brief, MNCs from spleen of tolerized mice were incubated with anti-mouse CD11c-coated magnetic beads (Miltenyi Biotec) and then subjected to positive selection through MACS separation columns. Cells selected on the basis of CD11c expression routinely consisted of >90% viable DCs. Cells that were positive for either lineage marker were sorted with a FACSAria (BD Biosciences) into CD8α− CD11b+ and CD8α+ CD11b− DC fractions. DCs (1.25 × 10⁵) were cultured in 96-well plates for 24 h in the presence of LPS (1 μg/ml) (Sigma-Aldrich). Culture supernatants from each well were harvested and concentrations of IL-10, IL-12p70 and TGF-α1 were measured by sandwich ELISA (BD Pharmingen). NO production was measured as nitrite concentration using the Griess assay (22).
To determine IL-27 mRNA expression of CD11c+ CD11b+ and CD11c+ CD8α+ DCs, these DC subsets from spleen of tolerized mice were assayed using real-time PCR, and β-actin expression served as control. Relative expression was calculated following the previously described protocol (6, 23).
To determine the in vitro functions of these DC subsets, cells were cultured for 3 days with MOG-reactive CD4+ T cells (1 × 10⁵) at a ratio of 1:100, 1:20, 1:10 in the presence of MOG (10 μg/ml). To determine the role of IL-10 in CD11c+ CD11b+ DC-induced suppression, anti-IL-10 neutralizing mAb at 5 μg/ml was added in separate wells in parallel. Before the final 18 h of culture, 0.5 μCi of [3H]thymidine (New England Nuclear) was added to each well. Cells were harvested and incorporated radioactivity was measured in a scintillation counter. Data were presented as the mean cpm of triplicate cultures. In separate plates, DC:CD4+ T cells were cocultured at a ratio of 1:20 in the presence of MOG (10 μg/ml) for 3 days, supernatants were harvested for cytokine production by ELISA and NO by Griess assay.
TGF-β bioassay
TGF-β activity in the supernatants from coculture was assayed using the Mv-1-Lu mink lung cell line (CCL-64; American Type Culture Collection) as described (24) with minor modifications. Briefly, the cells were maintained in EMEM containing 1.0 mM sodium pyruvate and 0.1 mM non-essential amino acids and supplemented with 10% FCS. Cells were cultured 1 day before use to ensure that they were in exponential growth at the outset of the assay, which was conducted in 96-well V-bottom plates (Nunc). Ten-microliter supernatants of CD11c+ CD11b+ DCs were added to wells containing 2 × 10⁴ Mv-1-Lu cells in 90 μl of RPMI 1640 medium and cultured for 24 h, followed by 4-h [3H]thymidine incorporation. Recombinant human TGF-β1 (BD Biosciences) was used to generate a standard curve. In parallel, neutralizing anti-TGF-β1, -β2, and -β3 mAbs (R&D Systems) were added (5 μg/ml each) in the indicated wells at the beginning of culture.
DC-induced CD4+ CD25+ T cells in vitro
CD4+ T cells were isolated from the spleen of tolerized or control EAE mice on day 21 p.i. using anti-CD4 mAb-conjugated MACS beads. Cells (1 × 10⁵) were then incubated in 96-well culture plates, with or without of MOG (10 μg/ml), and with CD11c+ CD11b+ or CD11c+ CD8α+ DCs (1 × 10⁴ cells) that had been purified from the spleen of tolerized mice. After 3 days of culture, the proportion of CD4+ CD25+ T cells was analyzed using PE-labeled anti-CD25 and FITC-labeled anti-CD4 mAbs (BD Pharmingen) on a FACSAria.
Adoptive transfer of DC subsets in EAE mice
CD11c+ DCs were isolated from the spleen of MOG-i.v tolerance mice on day 21 p.i. and separated into CD11b+ and CD8α+ cells with a FACSAria, using PE-conjugated anti-mouse CD11b and PerCP-conjugated anti-mouse CD8α mAbs. CD11c+ CD11b+ and CD11c+ CD8α+ DCs (5 × 10⁵ cells/mouse; purity >97%) were then i.v. transferred into MOG-induced EAE mice on day 19 p.i., when the mean clinical score was 3 ± 0.5 (n = 5 per group). Five weeks after primary immunization, MNCs prepared from spleens of PBS- or DC-transferred mice (2 × 10⁵ cells) were stimulated with MOG (10 μg/ml) or ConA (5 μg/ml) for 3 days. Proliferative responses to MOG or ConA were measured based on [3H]thymidine incorporation. Then, MNCs from spinal cords of PBS- or DC-transferred mice were isolated, stimulated with MOG35–55 (10 μg/ml) for 4 h, and stained with anti-CD4, CD25, and intracellular Foxp3 mAbs. Foxp3 expression on gated CD4+ CD25+ T cells was determined by flow cytometry. Splenocytes from each group were cultured in the presence of MOG (10 μg/ml) for 3 days, and supernatants were assayed by ELISA for cytokine profile.
Statistical analysis
Clinical scores were analyzed using Mann-Whitney U test and all other experiments were tested for statistical differences using unpaired, two-tailed, Student’s t tests. Differences were considered significant if p < 0.05.
Results
Induction of immune tolerance and inhibition of EAE by i.v administration of MOG
We i.v. administered MOG35–55 peptide to mice after induction of EAE. Mice that received i.v. PBS in parallel served as controls. All mice in the control group developed chronic-progressive EAE. In contrast, when MOG was administered i.v. on days 3, 5, and 7 p.i., the disease was markedly suppressed (Fig. 1A; p < 0.01). Consistent with this clinical finding, histological examination of CNS tissues revealed a dramatic pathological difference between MOG-i.v. and PBS-i.v. mice. In PBS-i.v. mice, multiple inflammatory foci were observed in the white matter of the spinal cord and the inflammation score was 2.7 ± 0.2, with extensive demyelination (Fig. 1, B and C). In contrast, few inflammatory cells and little or no demyelination were detected in MOG-i.v. groups (Fig. 1, D and E). The difference between the pathological scores of PBS-i.v. and MOG-i.v. groups of mice was highly significant (Fig. 1F; p < 0.001).
FIGURE 1.
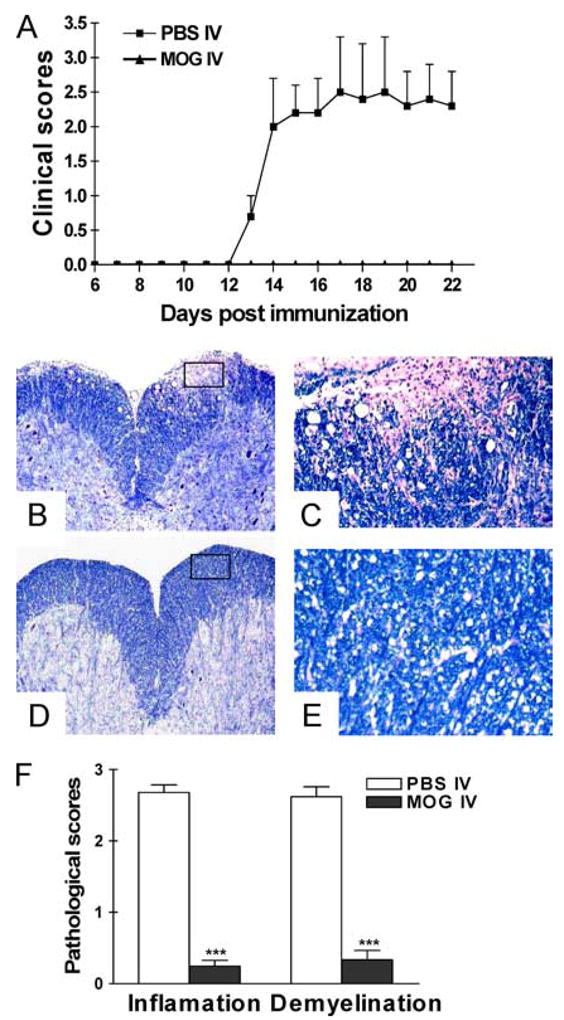
Intravenous injection of MOG35–55 prevents EAE. C57BL/6 mice were immunized with MOG35–55 + CFA. Pertussis toxin was injected on days 0 and 2 p.i. Two hundred micrograms of MOG35–55 was injected i.v. on days 3, 5, and 7 p.i. Mice that received i.v. PBS in parallel served as controls. Clinical EAE was scored according to 0–5 scale (A) (n = 5 in each group). The differences between PBS-i.v. mice and all MOG-i.v. groups were significant (p < 0.01). On day 21 p.i., spinal cords were harvested after extensive perfusion, and 5-μm sections were stained with H&E and Luxol fast blue. Shown are examples of Luxol fast blue staining for mice that received i.v. PBS (B and C) and i.v. MOG (D and E). B and D, Magnifications, ×10. C and E, Magnifications, ×20. The difference between PBS-i.v. and MOG-i.v. mice was significant (p < 0.01). F, Mean scores of inflammation and demyelination ± SD in MOG-i.v. and PBS-i.v. mice (n = 5 each group). ***, p < 0.001. One representative experiment of three is shown (total n = 15 in each group).
Increased proportions of CD11c+ CD11b+ DCs and CD4+ CD25+ T cells in the CNS and spleen of tolerized mice
To determine which DC subset is more abundant during induction of i.v. tolerance, we examined the relative populations of CD11c+ CD11b+ and CD11c+ CD8α+ DCs in the CNS and spleen after MOG 35–55-i.v. administration MOG35–55. The relative proportions of CD11c+ CD11b+ and CD11c+ CD8α+ DCs were measured in MNCs that had been isolated from the CNS and spleen 21 days p.i. A higher proportion of CD11c+ CD11b+ DCs was seen in tolerized mice than in non-tolerized EAE mice (spinal cord: 10.4 ± 0.4% vs 6.0 ± 0.5%; p < 0.01, spleen 13.1 ± 0.5% vs 5.6 ± 0.6%; p < 0.001), while a higher proportion of CD11c+ CD8α+ DCs was seen in mice with EAE than in tolerized mice (spinal cord: 9.7 ± 1.2% vs 5.2 ± 1.0%; p < 0.05) (Fig. 2A). To further elucidate the process of i.v. tolerance induction, we sought to determine the proportion of CD4+ CD25+ T cells among MNCs isolated from the CNS. Three weeks p.i., the proportion of CD4+ CD25+ T cells in the CNS was higher in tolerized mice than nontolerized mice (3.8 ± 0.2% vs 1.7 ± 0.3% of total cells; p < 0.01) (Fig. 2B). When splenocytes were cultured for 3 days in the presence of MOG, the proportion of CD4+ CD25+ T cells markedly increased in cells from tolerized mice compared with non-tolerized EAE mice (12.0 ± 0.6% vs 1.8 ± 0.1% of total cells; p < 0.001) (Fig. 2B).
FIGURE 2.

Increased proportion of CD11c+ CD11b+ DCs and CD4+ CD25+ T cells in tolerized mice. A, MNCs were isolated from spleen and the CNS of MOG-i.v. tolerance and PBS-i.v. EAE mice on day 21 p.i. The proportions of CD11c+ CD11b+ DCs and CD11c+ CD8α+ DCs were determined using flow cytometry. B, MNCs (2.5 × 10⁵) were isolated from spinal cords and spleen and the CNS on day 21 p.i, and the proportions of CD4+ CD25+ cells in freshly isolated CNS cells were determined using flow cytometry. Splenocytes were cultured for 3 days in the presence or absence (nil) of MOG35–55 (10 μg/ml), and the proportion of CD4+ CD25+ T cells was determined using flow cytometry.*, p < 0.05;**, p < 0.01;***, p < 0.001. One representative experiment of three is shown.
Decreased expression of I-A and costimulatory molecules on CD11c+ CD11b+ DCs after i.v. tolerance
To investigate the Ag-presenting capability of CD11c+ CD11b+ and CD11c+ CD8α+ DCs, the kinetics of I-A and costimulatory molecule expression on these DC subsets was examined by flow cytometry. Freshly isolated CD11c+ CD11b+ DCs from spleen of EAE and MOG tolerized mice were phenotypically immature, as determined by their expression of moderate levels of I-A, together with low to moderate expression of costimulatory molecules CD40, CD80, and CD86 (Fig. 3A). This immature or Ag-processing phenotype is consistent with previous reports regarding DCs freshly isolated from both lymphoid and nonlymphoid tissues (25, 26). Expression of I-A, CD80, CD86, and CD40 on CD11c+ CD11b+ DCs from spleen was down-regulated in MOG i.v. treated mice compared with PBS-treated EAE mice (Fig. 3A). However, CD11c+ CD8α+ DC subsets from spinal cords of MOG i.v. treated mice expressed higher levels of I-A, CD80, CD86, and CD40 than CD11c+ CD11b+ DCs (p < 0.05 to 0.001; Fig. 3B).
FIGURE 3.

Expression of I-A and costimulatory molecules on CD11b+CD11c+ DC, CD8α+CD11c+ DC subsets of EAE and i.v. tolerized mice. A, Flow cytometric analysis of cell surface markers on freshly isolated MNCs. Splenocytes of EAE mice or MOG35–55 i.v. tolerized mice were isolated on day 21 p.i. and stained for the expression of I-A, CD86, CD80 and CD40 on CD11c+CD11b+ DCs and CD11c+CD8α+ DCs.*, p < 0.05;**, p < 0.01;***, p < 0.001. B, Flow cytometric analysis of surface markers on freshly isolated CNS cells from PBS i.v. EAE mice or MOG35–55 i.v. tolerized mice. Cells were stained for expression of I-A, CD86, CD80, and CD40 on CD11c+CD11b+ and CD11c+CD8α+ DC subsets. Blue histogram lines represent specific fluorescence for indicated cell surface markers and red histogram lines represent cells stained with isotype-matched control mAbs.*, p < 0.05;**, p < 0.01;***, p < 0.001. One representative experiment of three is shown.
High levels of intracellular IL-10, but low level of IL-12 in CD11c+ CD11b+ DCs
DCs can drive either immunity or immune tolerance, and the cytokines they secrete upon Ag stimulation can provide clues as to which of the two immunologic roles a given DC subset will exert. IL-12-producing DCs tend to drive the Th1 response, whereas IL-10-producing DCs are known to drive the Th2 response and to play an important role in induction of T regulatory cells and systemic immune tolerance (5, 18). To characterize the cytokine profile of each DC subset, we isolated MNCs from spleen and spinal cords of EAE and MOG i.v. mice, and analyzed intracellular IL-10 and IL-12 in CD11c+ CD11b+ and CD11c+ CD8α+ DCs by flow cytometry. Induction of tolerance resulted in greater IL-10 expression and less IL-12 expression by CD11c+ CD11b+ DCs in spinal cords when compared with EAE mice (IL-10: 40.7 vs 30.2%, IL-12: 20 vs 24.4%). Opposite profile was observed in CD11c+ CD8α+ DCs: in tolerized mice, IL-10 expression was decreased while IL-12 expression was increased in CD11c+ CD8α+ DCs in comparison with the spinal cords from EAE mice (IL-10: 17.8% vs 22.6%, IL-12: 24.9 vs 31.3%) (Fig. 4A). Similar results for IL-12 were observed in splenocytes (Fig. 4B).
FIGURE 4.

Intracellular IL-10 and IL-12 expression in CD11c+CD11b+ and CD11c+CD8α+ DCs. MNCs were separated from spinal cords (A) and spleen (B) of tolerized and non-tolerized EAE mice, and intracellular IL-10, IL-12 expression in CD11c+CD11b+ and CD11c+CD8α+ DCs was examined by flow cytometry. One representative experiment of three is shown.
CD11c+CD11b+ DCs produced high levels of IL-10, TGF-β, IL-27 but low levels of IL-12 and NO upon LPS stimulation
To further study the cytokine profiles of these two distinct DC subsets, freshly prepared CD11c+CD11b+ or CD11c+CD8α+ DCs from spleen of tolerized mice were stimulated with or without LPS. Supernatants were harvested at 24 h after stimulation and analyzed for the production of IL-10, TGF-β, IL-12, and NO. As shown in Fig. 5A, IL-10 concentration was significantly higher in CD11c+CD11b+ DCs than in CD11c+CD8α+ DCs (p < 0.001). In contrast, IL-12 concentration was higher in CD11c+CD8α+ DCs than in CD11c+CD11b+ DCs (p < 0.01). NO production was also significantly higher in CD11c+CD8α+ DCs than in CD11c+CD11b+ DCs (p < 0.05). IL-27p28 mRNA expression in freshly purified CD11c+CD11b+ DCs exhibited a 47.5-fold increase compared with the level of CD11c+CD8α+ DCs (Fig. 5B). Bioactivity of TGF-β produced by CD11c+CD11b+ DCs was confirmed by bioassay and neutralizing Ab blocking experiment (Fig. 5C).
FIGURE 5.

Characteristics of CD11c+CD11b+ and CD11c+CD8α+ DC subsets. A, Freshly prepared CD11c+CD11b+ or CD11c+CD8α+ DCs from splenocytes of tolerized mice were stimulated with 1 μg/ml LPS for 24 h. Supernatants were assayed for IL-10, TGF-β, IL-12p70 by ELISA, and NO by Griess assay. B, CD11c+CD11b+ and CD11c+CD8α+ DCs were purified from splenocytes of tolerized mice and IL-27 mRNA expression was determined using real-time PCR. The y-axis represents the fold increase in IL-27p28 mRNA expression in CD11c+CD11b+ when compared with CD11c+CD8α+ DCs. C, TGF-β bioactivity in the CD11c+CD11b+ cell culture supernatants was determined as described in Materials and Methods. Neutralizing Abs against TGF-β1, β2, and β3 (5 ng/ml each) were added in parallel. D, MOG-reactive CD4+ T cells (1 × 10⁵) from mice with EAE were cocultured with 1 × 10⁴ CD11c+CD11b+ DCs or CD11c+CD8α+ DCs from tolerized mice for 3 days in the presence of MOG35–55 (10 μg/ml). Concentrations of IL-10, IL-12, TGF-β1, IL-4, IL-5, and IL-13 in the culture supernatants were determined by sandwich ELISA and NO by Griess assay.*, p < 0.05;**, p < 0.01;***, p < 0.001. One representative of three experiments is shown. E, Freshly prepared CD11c+CD11b+ or CD11c+CD8α+ DCs were cocultured with MOG-reactive CD4+ T cells (1 × 10⁵) and irradiated APCs (Irrad. APC; 1 × 10⁵) obtained from the spleen of mice with EAE, for 3 days at various DC:CD4+T cell ratios in the presence of MOG35–55 (10 μg/ml). Proliferative responses of CD4+ T cells were determined. Neutralizing anti-IL-10 mAb (5 μg/ml) was added in parallel in indicated wells. Values are the mean and SD from 3 independent experiments.
Immunosuppressive characteristics of CD11c+CD11b+ DCs
To analyze the functional properties of each DC subset, freshly prepared CD11c+CD11b+ or CD11c+CD8α+ DCs from spleen of tolerized mice were cocultured with MOG-reactive CD4+ T cells and irradiated APCs and were exposed to MOG35–55,. Production of IL-10, TGF-β, IL-12, NO, IL-4, IL-5, and IL-13 in coculture supernatants was measured. Concentrations of IL-10 and TGF-β were higher in the culture supernatants of CD11c+CD11b+ DCs than in those of CD11c+CD8α+ DCs (both p < 0.001). In contrast, concentrations of IL-12 and NO were higher in culture supernatants of CD11c+CD8α+ DCs than in those of CD11c+CD11b+ DCs (p < 0.01–0.001); Fig. 5D). Further, CD11c+CD11b+ DCs induced significantly higher levels of Th2 cytokines (IL-4, -5, and -13) than CD11c+CD11b+ DCs (Fig. 5D) (all p < 0.01 or 0.001). At various DC:CD4+ T cell ratios, the number of CD11c+CD11b+ DCs increased and the proliferative response of CD4+ T cells to MOG protein declined; however, no such effect was exerted by CD11c+CD8α+ DCs (Fig. 5E). CD11c+CD11b+ DC-induced suppression of T cell response was partially blocked by neutralizing IL-10 mAb (Fig. 5E). These findings suggest that IL-10 is involved in CD11c+CD11b+ DC-induced suppression of T cell proliferation in a dose-dependent manner, and that this DC subset induces the activation of helper T cells secreting Th2 cytokines.
Generation of CD4+CD25+ Treg cells by CD11c+CD11b+ DCs in vitro
To determine which subset of DCs is capable of triggering differentiation of CD4+ T cells with a regulatory phenotype, CD11c+CD11b+ or CD11c+CD8α+ DCs from spleens of tolerized mice were cultured with CD4+ T cells obtained from spleens of tolerized mice or non-tolerized mice for 3 days, with or without MOG35–55. When CD11c+ CD11b+ DCs were cultured with CD4+ T cells from tolerized mice in the presence of MOG35–55, the proportion of CD4+CD25+ T cells increased from 1.9% to 27.4% after 3 days of culture; no such increase was seen in cultures with CD11c+CD8α+ DCs (Fig. 6). In addition, the generation of CD4+CD25+ T cells was more prominent in CD4+ T cells from tolerized mice than in those from control EAE mice. These findings clearly show the ability of CD11c+CD11b+ DCs to induce CD4+CD25+ Tregs.
FIGURE 6.
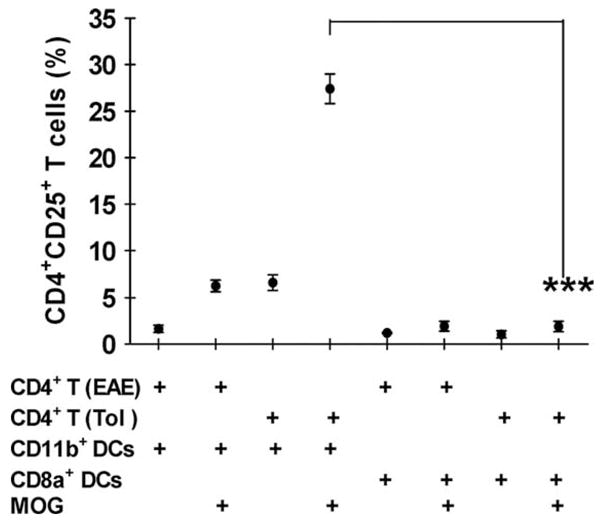
In vitro induction of CD4+CD25+ T cells by CD11c+CD11b+ DCs. CD11c+CD11b+ DCs and CD11c+CD8α+ DCs were purified by FACS from spleens of tolerized mice on day 21 p.i. These cells (1 × 10⁴) were cococultured with CD4+ T cells (1 × 10⁵) of tolerized (Tol) or EAE mice (EAE) in the presence or absence of MOG35–55 (10 μg/ml). Seventy-two hrs after culture, the proportion of CD4+CD25+ T cells was examined by flow cytometry.**, p < 0.01. Values are the mean from 3 independent experiments.
Suppression of EAE by adoptive transfer of MOG-pulsed CD11c+CD11b+ DCs
To determine whether CD11c+CD11b+ DCs have suppressive effects in vivo, DCs were separated from spleens of MOG-i.v. mice, sorted into CD11c+CD11b+ and CD11c+CD8α+ subpopulations, then transferred into recipient mice immunized to develop EAE. One week after cell transfer, mean clinical EAE scores were significantly lower in CD11c+CD11b+ DC-transferred mice than in CD11c+CD8α+ DC-transferred or non-transferred mice (Fig. 7A). Proliferative responses to MOG35–55 stimulation were significantly lower in splenocytes of mice that received CD11c+CD11b+ DCs than those received CD11c+CD8α+ DCs or PBS only (Fig. 7B). No difference was observed in proliferative responses to ConA among the three groups of splenocytes (Fig. 7B), suggesting that adoptive transfer of MOG-pulsed CD11c+CD11b+ DCs induced MOG-specific immune tolerance.
FIGURE 7.

Suppression of EAE by transfer of MOG-pulsed CD11c+CD11b+ DCs. A, Mice were sacrificed 3 wk after MOG35–55 i.v. tolerization. DCs were isolated from splenocytes using magnetic beads and separated into CD11c+CD11b+ and CD11c+CD8α+ DC subsets using a FACSAria. Sorted CD11c+CD11b+ and CD11c+CD8α+ DCs were i.v. transferred into EAE mice (5 × 10⁵/mouse; n = 5 per group). Mice that received PBS-i.v. served as controls. Mean clinical EAE scores were determined on a daily basis. B, Seven days after transfer, splenocytes of DC-transferred or EAE control mice were isolated and cultured for 3 days with MOG35–55 (10 μg/ml), ConA (5 μg/ml) or without Ag/mitogen. Proliferative responses were measured by [3H]thymidine incorporation.**, p < 0.01. C, Cells isolated from spinal cords of mice described in A were stimulated with MOG35–55 (10 μg/ml) for 4 h, stained with Abs to CD4, CD25, and intracellularly Foxp3. CD4+CD25+ T cells were gated and Foxp3 expression of these cells was analyzed by flow cytometry. One representative experiment of three is shown. D, Seven days after transfer, splenocytes of DC- or PBS-transferred mice were isolated and cultured with MOG35–55 (10 μg/ml) for 3 days. Supernatants were harvested and cytokine production was assayed by ELISA. p values refer to comparisons between DC- or PBS-transferred mice.*, p < 0.05, ***, p < 0.01, ***, p < 0.001.
Based on our assumption that i.v. tolerance may induce Tregs, we compared the proportion of CD4+CD25+Foxp3+ T cells among MNCs from spinal cords of mice that received CD11c+CD11b+ or CD11c+CD8α+ DCs. Significantly increased proportion of CD4+CD25+Foxp3+ T cells was observed in CD11c+CD11b+ DC-transferred mice (43.3%) in comparison with CD11c+CD8α+ DC-transferred (3.9%) or non-transferred mice (1.3%) (Fig. 7C).
We next analyzed the cytokines released by splenocytes from mice injected with either subset in vivo. Data in Fig. 7D showed that splenocytes from CD11c+CD11b+ DC-transferred mice produced significantly higher levels of Th2 cytokines (IL-4, IL-5, IL-13, and IL-10) but lower levels of Th1 cytokines (IL-2 and IFN-γ) upon MOG stimulation in comparison with those from CD11c+CD8α+ DC-transferred or non-transferred mice (Fig. 7D; all p < 0.05 to 0.001).
Discussion
DCs are professional APCs that play a decisive role in determining whether immunity or immune tolerance is induced in response to Ag (26). Because the spleen is an essential site for the induction of CNS immune responses and i.v. tolerance to soluble Ag, CNS and spleen DCs have been thought to play an important part in EAE (27–29). Each spleen DC subset appears to have a distinct lineage and set of functional characteristics (15, 29, 30). Lymphoid-like CD11c+ CD8α+ DCs that are IL-10lowIL-12high induce Th1 cytokines IFN-γ and IL-2 whereas myeloid-like CD11c+CD11b+ DCs IL-10highIL-12low induce Th2 cytokines IL-4 and IL-10 in vivo (15, 16, 30). To determine which DC subset is involved in the induction of i.v. tolerance in EAE, we first examined the change in proportions of CD11c+CD11b+ DCs and CD11c+CD8α+ DCs in CNS and spleen after i.v. administration of MOG and subsequent induction of EAE. It is of interest that the proportion of CD11c+CD11b+ DCs was higher in the CNS and spleen of tolerized mice, whereas CD11c+CD8α+ DCs were relatively abundant in the CNS and spleen of non-tolerized mice. IL-10 has been reported to have a major part in immune tolerance, and its production by DCs is critical for the differentiation of Treg cell, in this study, increased levels of IL-10-positive cells were seen in CD11c+CD11b+ DCs from tolerized mice. These results suggest that i.v. autoantigen induces CD11c+CD11b+ tolerogenic DCs population.
Although splenic stromal cells support DC development, these cells do not express Flt3L transcripts and produce only immature myeloid-like DCs (26, 31) This raises the possibility that a more committed progenitor of myeloid DC is maintained in spleen. Consistent with this hypothesis is the evidence that the majority of endogenous DCs in spleen are immature DCs, which are thought to be involved in the induction and maintenance of peripheral tolerance (32, 33). Recently, Zhang et al. demonstrate that endothelial splenic stroma induce hematopoietic stem cells to differentiate into regulatory DCs, with high expression of CD11b but low expression of Ia. CD11bhighIalow DCs secreting high levels of TGF-β and IL-10 can suppress T cell proliferation both in vitro and in vivo (22). Furthermore, after Ag uptake, inflammatory stimulation and migration to spleen, mature DCs can be promoted by spleen stromal cells, to differentiate into a new regulatory DC subset (CD11clowCD11bhighMHClowCD40high). These cells secreted more IL-10 and less IL-12 (34–36). Svensson et al. also proved that spleen derived stromal cells promote selective development of CD11clowCD11bhighCD45+ IL-10-producing regulatory DCs from lineage-negative c-kit+ progenitor cells (37). These DC have the capacity to suppress T cell responses and induce IL-10 producing Treg in vitro and to induce Ag-specific tolerance in vivo (22, 37). However, most regulatory DCs are prepared in vitro using immunosuppressive cytokines, such as IL-10 and TGF-β (38–40) and may not reflect the real in vivo differentiation of regulatory DCs in the immune microenvironment. Intravenous tolerance, thus, provides a useful means to induce regulatory DCs in vivo.
The function of each distinct DC subset is determined by its anatomic microenvironment in combination with its surface phenotype (41). For example, it has been found that DC production is dependent on cells comprising an endothelial niche in the spleen (31) and their ability to support myeloid DC development from bone marrow correlates with endothelial maturity (42). Therefore, it is possible that self-renewing progenitors in spleen give rise to a large fraction of DCs with tolerogenic or regulatory, rather than immunostimulatory function (31). In the current study, we first showed that CD11c+CD11b+ DCs derived from fresh splenocytes in MOG i.v. tolerized mice, which have the profile of regulatory DCs, secreted significantly more IL-10, TGF-β and IL-27p28, but low levels of IL-12 and NO upon LPS stimulation. Coculture with MOG-reactive CD4+ T cells in the presence of MOG, CD11c+CD11b+ DCs obtained from spleen of tolerized mice produced high levels of TGF-β, IL-10, and induced Th2 cytokines (IL-4, IL-5, IL-13). Furthermore, CD11c+CD11b+ DCs, but not CD11c+CD8α+ DCs, inhibited MOG-induced proliferative responses in a dose-dependent manner, and IL-10 was involved in the process. These findings suggest that CD11c+CD11b+ DCs may be a unique DC subset that mediates T cell tolerance in EAE in vivo.
It has been reported that DC deficiency in costimulatory molecules can induce T cell anergy, generate Treg cells, and promote alloantigen-specific tolerance. Several types of DCs with negative regulatory functions have been reported (43, 44). Mature DCs are also characterized by tight control over the formation of MHC/peptide complexes and their expression on the cell surface along with costimulatory molecules (45). In our study, the expression of I-A, CD86, and CD40 was up-regulated in the CD11c+CD11b+ DC subsets of EAE mice and down-regulated in MOG i.v. treated mice, indicating that CD11c+CD11b+ DC subsets in EAE mice are more mature than in i.v. tolerized mice. Furthermore, in the CNS of tolerized mice, CD11c+CD11b+ DCs appeared to have an immature phenotype compared with CD11c+CD8α+ DCs. Recently, it was reported that Tregs develop in response to chronic antigenic stimulation and act directly on APCs, rendering them tolerogenic and capable of eliciting the differentiation of CD4+ T cells with suppressive activity (42). This implies that interaction between DCs and T cells could play an important role in the proportional and functional change in populations of DC subsets. However, a link between the change in DC subset proportions and the induction of i.v. tolerance has yet to be definitively demonstrated, and the underlying mechanism remains to be elucidated.
Although expression of CD25 can be up-regulated in both activated CD4+ T cells as well as Tregs, the CD4+CD25+ T cells expanded by exposure to CD11c+CD11b+ DCs in our study are thought to be Tregs, because they inhibited the proliferation of MOG-reactive CD4+ T cells in a dose-dependent manner, whereas CD11c+CD8a+ DC did not. These findings suggest that CD11c+CD11b+ DCs may play a crucial role in i.v tolerance to MOG in the murine EAE model. In the resting state, autoreactive T cells residing in the periphery are effectively suppressed by Tregs, which are thought to prevent the development of autoimmune diseases (34, 46). Three types of regulatory T cells have been reported: CD4+CD25+Foxp3+ Tregs, IL-10-producing Tr1 cells, and TGF-β-producing Th3 cells (47). We demonstrated that, after i.v. administration of MOG and subsequent EAE induction, the proportion of CD4+CD25+ T cells increased more in the CNS and spleen than in those of non-tolerized mice. Based on those findings, we sought to determine which subset of DCs in CNS and spleen was involved in generating and increasing the proportion of Tregs, Our results provide evidence that CD11c+CD11b+ DCs induced the differentiation of CD4 T cells into CD4+CD25+ Tregs in the presence of autoantigen. In addition, the production of IL-10 by CD11c+CD11b+ DCs from CNS and spleen of tolerized mice may play a role in inducing the differentiation of Tregs.
We further confirmed that CD11c+CD11b+ DCs are tolerogenic by showing their capacity to suppress EAE in vivo. Adoptive transfer of CD11c+CD11b+ DCs induced MOG-specific immune tolerance, a significant increase in the number of spinal cord CD4+CD25+Foxp3+ T cells in vivo and a significant increase in Th2 cytokines after CD11c+CD11b+ DC injection. DCs are currently the subject of active investigation for their immunoregulatory properties in experimental autoimmune diseases (48, 49). In those studies, DCs were modulated with TNF or were genetically modified to express IL-4 and Fas ligand. However, we have shown that tolerogenic DCs can be generated in vivo during i.v tolerance, without in vitro manipulation or artificial genetic modification.
Induction of tolerogenic DCs in vivo has been considered an important mechanism underlying current immunotherapies in multiple sclerosis (MS). Among them, glatiramer acetate (GA; copolymer-1, Copaxone), an analog of myelin basic protein, has been widely used to reduce relapse frequency in relapsing-remitting MS (50). Although a Th2 shift of T cells has been documented, this effect is probably secondary to the effect on APC (50). Indeed, a novel selective inhibitory effect of GA has been found on the production of DC-derived inflammatory mediators without affecting DC maturation or DC immunostimulatory potential (51). These GA-exposed IL-10highIL-12low DCs induce IL-4-secreting Th2 cells and IL-10 production (51). A similar effect has also been observed in monocytes that have been named as Type II monocytes (52–54). However, there is no specific marker for these tolerogenic DC/monocytes. Whether GA induces CD11b+CD11c+ tolerogenic DCs is currently under investigation.
Taken together, these findings suggest that immune tolerance induced by i.v. MOG35–55 is initiated by an increase in tolerogenic CD11c+CD11b+ DCs. These DCs in the CNS and spleen interact with and differentiate Ag-reactive CD4+ T cells into Ag-induced Th2 and CD4+CD25+ Tregs, which are involved in the induction of systemic tolerance. Our findings provide evidence of a new cellular mechanism underlying i.v. tolerance. In addition, the CD11c+CD11b+ DCs generated as a part of this i.v. tolerance dramatically suppress the development of EAE both directly in the host and therapeutically when transferred to recipient mice with the disease. Thus, this population of cells should be further investigated for their potential as a novel therapeutic approach in MS and other autoimmune disorders.
Acknowledgments
We thank Katherine Regan for editorial assistance.
Footnotes
This work was supported by grants from the National Institutes of Health and the National Multiple Sclerosis Society.
Abbreviations used in this paper: EAE, experimental autoimmune encephalomyelitis; MOG, myelin oligodendrocyte glycoprotein; MS, multiple sclerosis; DCs, dendritic cells; p.i. postimmunization; Treg cell, regulatory T cell; MNC, mononuclear cell; GA, glatiramer acetate.
Disclosures
The authors have no financial conflict of interest.
References
- 1.Verbeek R, van der Mark K, Wawrousek EF, Plomp AC, van Noort JM. Tolerization of an established αB-crystallin-reactive T-cell response by intravenous antigen. Immunology. 2007;121:416–426. doi: 10.1111/j.1365-2567.2007.02592.x. [DOI] [PMC free article] [PubMed] [Google Scholar]
- 2.Kennedy MK, Dal Canto MC, Trotter JL, Miller SD. Specific immune regulation of chronic-relapsing experimental allergic encephalomyelitis in mice. J Immunol. 1988;141:2986–2993. [PubMed] [Google Scholar]
- 3.Hilliard B, Ventura ES, Rostami A. Effect of timing of intravenous administration of myelin basic protein on the induction of tolerance in experimental allergic encephalomyelitis. Mult Scler. 1999;5:2–9. doi: 10.1191/135245899701564308. [DOI] [PubMed] [Google Scholar]
- 4.Ferguson TA, Stuart PM, Herndon JM, Griffith TS. Apoptosis, tolerance, and regulatory T cells—old wine, new wineskins. Immunol Rev. 2003;193:111–123. doi: 10.1034/j.1600-065x.2003.00042.x. [DOI] [PubMed] [Google Scholar]
- 5.Zhang GX, Gran B, Yu S, Li J, Siglienti I, Chen X, Kamoun M, Rostami A. Induction of experimental autoimmune encephalomyelitis in IL-12 receptor-β2-deficient mice: IL-12 responsiveness is not required in the pathogenesis of inflammatory demyelination in the central nervous system. J Immunol. 2003;170:2153–2160. doi: 10.4049/jimmunol.170.4.2153. [DOI] [PubMed] [Google Scholar]
- 6.Mann MK, Maresz K, Shriver LP, Tan Y, Dittel BN. B cell regulation of CD4+CD25+ T regulatory cells and IL-10 via B7 is essential for recovery from experimental autoimmune encephalomyelitis. J Immunol. 2007;178:3447–3456. doi: 10.4049/jimmunol.178.6.3447. [DOI] [PubMed] [Google Scholar]
- 7.Fitzgerald DC, Zhang GX, El-Behi M, Fonseca-Kelly Z, Li H, Yu S, Saris CJ, Gran B, Ciric B, Rostami A. Suppression of autoimmune inflammation of the central nervous system by interleukin 10 secreted by interleukin 27-stimulated T cells. Nat Immunol. 2007;8:1372–1379. doi: 10.1038/ni1540. [DOI] [PubMed] [Google Scholar]
- 8.Hilliard BA, Kamoun M, Ventura E, Rostami A. Mechanisms of suppression of experimental autoimmune encephalomyelitis by intravenous administration of myelin basic protein: role of regulatory spleen cells. Exp Mol Pathol. 2000;68:29–37. doi: 10.1006/exmp.1999.2290. [DOI] [PubMed] [Google Scholar]
- 9.Jacobs MJ, van den Hoek AE, van de Putte LB, van den Berg WB. Anergy of antigen-specific T lymphocytes is a potent mechanism of intravenously induced tolerance. Immunology. 1994;82:294–300. [PMC free article] [PubMed] [Google Scholar]
- 10.Zarnani AH, Moazzeni SM, Shokri F, Salehnia M, Jeddi-Tehrani M. Kinetics of murine decidual dendritic cells. Reproduction. 2007;133:275–283. doi: 10.1530/rep.1.01232. [DOI] [PubMed] [Google Scholar]
- 11.de Jong EC, Smits HH, Kapsenberg ML. Dendritic cell-mediated T cell polarization. Springer Semin Immunopathol. 2005;26:289–307. doi: 10.1007/s00281-004-0167-1. [DOI] [PubMed] [Google Scholar]
- 12.Sponaas AM, Cadman ET, Voisine C, Harrison V, Boonstra A, O’Garra A, Langhorne J. Malaria infection changes the ability of splenic dendritic cell populations to stimulate antigen-specific T cells. J Exp Med. 2006;203:1427–1433. doi: 10.1084/jem.20052450. [DOI] [PMC free article] [PubMed] [Google Scholar]
- 13.Wu L, Dakic A. Development of dendritic cell system. Cell Mol Immunol. 2004;1:112–118. [PubMed] [Google Scholar]
- 14.Pulendran B, Lingappa J, Kennedy MK, Smith J, Teepe M, Rudensky A, Maliszewski CR, Maraskovsky E. Developmental pathways of dendritic cells in vivo: distinct function, phenotype, and localization of dendritic cell subsets in FLT3 ligand-treated mice. J Immunol. 1997;159:2222–2231. [PubMed] [Google Scholar]
- 15.Maldonado-Lopez R, De Smedt T, Michel P, Godfroid J, Pajak B, Heirman C, Thielemans K, Leo O, Urbain J, Moser M. CD8α+ and CD8α− subclasses of dendritic cells direct the development of distinct T helper cells in vivo. J Exp Med. 1999;189:587–592. doi: 10.1084/jem.189.3.587. [DOI] [PMC free article] [PubMed] [Google Scholar]
- 16.Dillon S, Agrawal S, Banerjee K, Letterio J, Denning TL, Oswald-Richter K, Kasprowicz DJ, Kellar K, Pare J, van Dyke T, et al. Yeast zymosan, a stimulus for TLR2 and dectin-1, induces regulatory antigen-presenting cells and immunological tolerance. J Clin Invest. 2006;116:916–928. doi: 10.1172/JCI27203. [DOI] [PMC free article] [PubMed] [Google Scholar]
- 17.Larmonier N, Marron M, Zeng Y, Cantrell J, Romanoski A, Sepassi M, Thompson S, Chen X, Andreansky S, Katsanis E. Tumor-derived CD4+ CD25+ regulatory T cell suppression of dendritic cell function involves TGF-β and IL-10. Cancer Immunol Immunother. 2007;56:48–59. doi: 10.1007/s00262-006-0160-8. [DOI] [PMC free article] [PubMed] [Google Scholar]
- 18.Lee LF, Xu B, Michie SA, Beilhack GF, Warganich T, Turley S, McDevitt HO. The role of TNF-α in the pathogenesis of type 1 diabetes in the nonobese diabetic mouse: analysis of dendritic cell maturation. Proc Natl Acad Sci USA. 2005;102:15995–16000. doi: 10.1073/pnas.0508122102. [DOI] [PMC free article] [PubMed] [Google Scholar]
- 19.Popov I, Li M, Zheng X, San H, Zhang X, Ichim TE, Suzuki M, Feng B, Vladau C, Zhong R, et al. Preventing autoimmune arthritis using antigen-specific immature dendritic cells: a novel tolerogenic vaccine. Arthritis Res Ther. 2006;8:R141. doi: 10.1186/ar2031. [DOI] [PMC free article] [PubMed] [Google Scholar]
- 20.Aloisi F, De Simone R, Columba-Cabezas S, Penna G, Adorini L. Functional maturation of adult mouse resting microglia into an APC is promoted by granulocyte-macrophage colony-stimulating factor and interaction with Th1 cells. J Immunol. 2000;164:1705–1712. doi: 10.4049/jimmunol.164.4.1705. [DOI] [PubMed] [Google Scholar]
- 21.Schlecht G, Mouries J, Poitrasson-Riviere M, Leclerc C, Dadaglio G. Purification of splenic dendritic cells induces maturation and capacity to stimulate Th1 response in vivo. Int Immunol. 2006;18:445–452. doi: 10.1093/intimm/dxh384. [DOI] [PubMed] [Google Scholar]
- 22.Zhang M, Tang H, Guo Z, An H, Zhu X, Song W, Guo J, Huang X, Chen T, Wang J, Cao X. Splenic stroma drives mature dendritic cells to differentiate into regulatory dendritic cells. Nat Immunol. 2004;5:1124–1133. doi: 10.1038/ni1130. [DOI] [PubMed] [Google Scholar]
- 23.Fitzgerald DC, Ciric B, Touil T, Harle H, Grammatikopolou J, Das Sarma J, Gran B, Zhang GX, Rostami A. Suppressive effect of IL-27 on encephalitogenic Th17 cells and the effector phase of experimental autoimmune encephalomyelitis. J Immunol. 2007;179:3268–3275. doi: 10.4049/jimmunol.179.5.3268. [DOI] [PubMed] [Google Scholar]
- 24.Hillyer L, Dao B, Niemiec P, Lee S, Doidge M, Bemben I, Neyestani T, Woodward B. Elevated bioactivity of the tolerogenic cytokines, interleukin-10 and transforming growth factor-β, in the blood of acutely malnourished weanling mice. Exp Biol Med (Maywood) 2006;231:1439–1447. doi: 10.1177/153537020623100818. [DOI] [PubMed] [Google Scholar]
- 25.Dubsky P, Ueno H, Piqueras B, Connolly J, Banchereau J, Palucka AK. Human dendritic cell subsets for vaccination. J Clin Immunol. 2005;25:551–572. doi: 10.1007/s10875-005-8216-7. [DOI] [PubMed] [Google Scholar]
- 26.Quah BJ, O’Neill HC. Maturation of function in dendritic cells for tolerance and immunity. J Cell Mol Med. 2005;9:643–654. doi: 10.1111/j.1582-4934.2005.tb00494.x. [DOI] [PMC free article] [PubMed] [Google Scholar]
- 27.Zhang QH, Link H, Xiao BG. Efficacy of peripheral tolerance induced by dendritic cells is dependent on route of delivery. J Autoimmun. 2004;23:37–43. doi: 10.1016/j.jaut.2004.03.010. [DOI] [PubMed] [Google Scholar]
- 28.Lappin MB, Weiss JM, Delattre V, Mai B, Dittmar H, Maier C, Manke K, Grabbe S, Martin S, Simon JC. Analysis of mouse dendritic cell migration in vivo upon subcutaneous and intravenous injection. Immunology. 1999;98:181–188. doi: 10.1046/j.1365-2567.1999.00850.x. [DOI] [PMC free article] [PubMed] [Google Scholar]
- 29.Shortman K, Liu YJ. Mouse and human dendritic cell subtypes. Nat Rev Immunol. 2002;2:151–161. doi: 10.1038/nri746. [DOI] [PubMed] [Google Scholar]
- 30.Pulendran B, Smith JL, Caspary G, Brasel K, Pettit D, Maraskovsky E, Maliszewski CR. Distinct dendritic cell subsets differentially regulate the class of immune response in vivo. Proc Natl Acad Sci USA. 1999;96:1036–1041. doi: 10.1073/pnas.96.3.1036. [DOI] [PMC free article] [PubMed] [Google Scholar]
- 31.Tan JK, O’Neill HC. Concise review: dendritic cell development in the context of the spleen microenvironment. Stem Cells. 2007;25:2139–2145. doi: 10.1634/stemcells.2007-0244. [DOI] [PubMed] [Google Scholar]
- 32.Mahnke K, Johnson TS, Ring S, Enk AH. Tolerogenic dendritic cells and regulatory T cells: a two-way relationship. J Dermatol Sci. 2007;46:159–167. doi: 10.1016/j.jdermsci.2007.03.002. [DOI] [PubMed] [Google Scholar]
- 33.Lange C, Durr M, Doster H, Melms A, Bischof F. Dendritic cell-regulatory T-cell interactions control self-directed immunity. Immunol Cell Biol. 2007;85:575–581. doi: 10.1038/sj.icb.7100088. [DOI] [PubMed] [Google Scholar]
- 34.Long ET, Wood KJ. Regulatory T cells—a journey from rodents to the clinic. Front Biosci. 2007;12:4042–4049. doi: 10.2741/2370. [DOI] [PubMed] [Google Scholar]
- 35.Li L, Liu S, Zhang T, Pan W, Yang X, Cao X. Splenic stromal microenvironment negatively regulates virus-activated plasmacytoid dendritic cells through TGF-β. J Immunol. 2008;180:2951–2956. doi: 10.4049/jimmunol.180.5.2951. [DOI] [PubMed] [Google Scholar]
- 36.Tang H, Guo Z, Zhang M, Wang J, Chen G, Cao X. Endothelial stroma programs hematopoietic stem cells to differentiate into regulatory dendritic cells through IL-10. Blood. 2006;108:1189–1197. doi: 10.1182/blood-2006-01-007187. [DOI] [PubMed] [Google Scholar]
- 37.Svensson M, Kaye PM. Stromal-cell regulation of dendritic-cell differentiation and function. Trends Immunol. 2006;27:580–587. doi: 10.1016/j.it.2006.10.006. [DOI] [PubMed] [Google Scholar]
- 38.Rutella S, Danese S, Leone G. Tolerogenic dendritic cells: cytokine modulation comes of age. Blood. 2006;108:1435–1440. doi: 10.1182/blood-2006-03-006403. [DOI] [PubMed] [Google Scholar]
- 39.Vlad G, Cortesini R, Suciu-Foca N. License to heal: bidirectional interaction of antigen-specific regulatory T cells and tolerogenic APC. J Immunol. 2005;174:5907–5914. doi: 10.4049/jimmunol.174.10.5907. [DOI] [PubMed] [Google Scholar]
- 40.Ureta G, Osorio F, Morales J, Rosemblatt M, Bono MR, Fierro JA. Generation of dendritic cells with regulatory properties. Transplant Proc. 2007;39:633–637. doi: 10.1016/j.transproceed.2006.12.032. [DOI] [PubMed] [Google Scholar]
- 41.Goldschneider I, Cone RE. A central role for peripheral dendritic cells in the induction of acquired thymic tolerance. Trends Immunol. 2003;24:77–81. doi: 10.1016/s1471-4906(02)00038-8. [DOI] [PubMed] [Google Scholar]
- 42.Yamazaki S, Iyoda T, Tarbell K, Olson K, Velinzon K, Inaba K, Steinman RM. Direct expansion of functional CD25+ CD4+ regulatory T cells by antigen-processing dendritic cells. J Exp Med. 2003;198:235–247. doi: 10.1084/jem.20030422. [DOI] [PMC free article] [PubMed] [Google Scholar]
- 43.McCurry KR, Colvin BL, Zahorchak AF, Thomson AW. Regulatory dendritic cell therapy in organ transplantation. Transpl Int. 2006;19:525–538. doi: 10.1111/j.1432-2277.2006.00306.x. [DOI] [PubMed] [Google Scholar]
- 44.Novak N, Bieber T. 2. Dendritic cells as regulators of immunity and tolerance. J Allergy Clin Immunol. 2008;121:S370–374. doi: 10.1016/j.jaci.2007.06.001. quiz S413. [DOI] [PubMed] [Google Scholar]
- 45.van Duivenvoorde LM, van Mierlo GJ, Boonman ZF, Toes RE. Dendritic cells: vehicles for tolerance induction and prevention of autoimmune diseases. Immunobiology. 2006;211:627–632. doi: 10.1016/j.imbio.2006.05.014. [DOI] [PubMed] [Google Scholar]
- 46.Hill JA, Benoist C, Mathis D. Treg cells: guardians for life. Nat Immunol. 2007;8:124–125. doi: 10.1038/ni0207-124. [DOI] [PubMed] [Google Scholar]
- 47.Faria AM, Weiner HL. Oral tolerance: therapeutic implications for autoimmune diseases. Clin Dev Immunol. 2006;13:143–157. doi: 10.1080/17402520600876804. [DOI] [PMC free article] [PubMed] [Google Scholar]
- 48.Vasu C, Dogan RN, Holterman MJ, Prabhakar BS. Selective induction of dendritic cells using granulocyte macrophage-colony stimulating factor, but not fms-like tyrosine kinase receptor 3-ligand, activates thyroglobulin-specific CD4+/CD25+ T cells and suppresses experimental autoimmune thyroiditis. J Immunol. 2003;170:5511–5522. doi: 10.4049/jimmunol.170.11.5511. [DOI] [PubMed] [Google Scholar]
- 49.van Duivenvoorde LM, Louis-Plence P, Apparailly F, van der Voort EI, Huizinga TW, Jorgensen C, Toes RE. Antigen-specific immunomodulation of collagen-induced arthritis with tumor necrosis factor-stimulated dendritic cells. Arthritis Rheum. 2004;50:3354–3364. doi: 10.1002/art.20513. [DOI] [PubMed] [Google Scholar]
- 50.Farina C, Weber MS, Meinl E, Wekerle H, Hohlfeld R. Glatiramer acetate in multiple sclerosis: update on potential mechanisms of action. Lancet Neurol. 2005;4:567–575. doi: 10.1016/S1474-4422(05)70167-8. [DOI] [PubMed] [Google Scholar]
- 51.Vieira PL, Heystek HC, Wormmeester J, Wierenga EA, Kapsenberg ML. Glatiramer acetate (copolymer-1, copaxone) promotes Th2 cell development and increased IL-10 production through modulation of dendritic cells. J Immunol. 2003;170:4483–4488. doi: 10.4049/jimmunol.170.9.4483. [DOI] [PubMed] [Google Scholar]
- 52.Kim HJ, Ifergan I, Antel JP, Seguin R, Duddy M, Lapierre Y, Jalili F, Bar-Or A. Type 2 monocyte and microglia differentiation mediated by glatiramer acetate therapy in patients with multiple sclerosis. J Immunol. 2004;172:7144–7153. doi: 10.4049/jimmunol.172.11.7144. [DOI] [PubMed] [Google Scholar]
- 53.Stuve O, Youssef S, Weber MS, Nessler S, von Budingen HC, Hemmer B, Prod’homme T, Sobel RA, Steinman L, Zamvil SS. Immunomodulatory synergy by combination of atorvastatin and glatiramer acetate in treatment of CNS autoimmunity. J Clin Invest. 2006;116:1037–1044. doi: 10.1172/JCI25805. [DOI] [PMC free article] [PubMed] [Google Scholar]
- 54.Weber MS, Prod’homme T, Youssef S, Dunn SE, Rundle CD, Lee L, Patarroyo JC, Stuve O, Sobel RA, Steinman L, Zamvil SS. Type II monocytes modulate T cell-mediated central nervous system autoimmune disease. Nat Med. 2007;13:935–943. doi: 10.1038/nm1620. [DOI] [PubMed] [Google Scholar]