

Abstract
Macroautophagy, a major pathway for organelle and protein turnover, has been implicated in the neurodegeneration of Alzheimer's disease (AD). The basis for the profuse accumulation of autophagic vacuoles (AVs) in affected neurons of the AD brain, however, is unknown. In this study, we show that constitutive macroautophagy in primary cortical neurons is highly efficient, because newly formed autophagosomes are rapidly cleared by fusion with lysosomes, accounting for their scarcity in the healthy brain. Even after macroautophagy is strongly induced by suppressing mTOR (mammalian target of rapamycin) kinase activity with rapamycin or nutrient deprivation, active cathepsin-positive autolysosomes rather than LC3-II-positive autophagosomes predominate, implying efficient autophagosome clearance in healthy neurons. In contrast, selectively impeding late steps in macroautophagy by inhibiting cathepsin-mediated proteolysis within autolysosomes with cysteine- and aspartyl-protease inhibitors caused a marked accumulation of electron-dense double-membrane-limited AVs, containing cathepsin D and incompletely degraded LC3-II in perikarya and neurites. Similar structures accumulated in large numbers when fusion of autophagosomes with lysosomes was slowed by disrupting their transport on microtubules with vinblastine. Finally, we find that the autophagic vacuoles accumulating after protease inhibition or prolonged vinblastine treatment strongly resembled AVs that collect in dystrophic neurites in the AD brain and in an AD mouse model. We conclude that macroautophagy is constitutively active and highly efficient in healthy neurons and that the autophagic pathology observed in AD most likely arises from impaired clearance of AVs rather than strong autophagy induction alone. Therapeutic modulation of autophagy in AD may, therefore, require targeting late steps in the autophagic pathway.
Keywords: aging, Alzheimer, autophagy, culture, lysosome, neuron, neuron death, neuronal death, neuropathology, neuroprotection, neurotoxicity, storage
Introduction
The accumulation of specific cellular proteins within neurons is a pathologic hallmark of many major neurodegenerative diseases. Dysfunction within either of two proteolytic pathways, involved in clearing abnormal or obsolete cellular proteins, the ubiquitin–proteasome system (UPS) and the autophagic–lysosomal system, have been increasingly implicated in proteinopathies of Alzheimer's disease (AD), Huntington's disease, Parkinson's disease, and related disorders (Cuervo et al., 2004; Rubinsztein et al., 2005; Chu, 2006; Zhu et al., 2007). Macroautophagy, a major degradative pathway of the lysosomal system, plays a unique role in removing cellular organelles and protein aggregates that are too large to be degraded by the UPS (Rideout et al., 2004). In macroautophagy, hereafter referred to as autophagy, regional sequestration of cytoplasm within an enveloping double membrane structure, creates a vacuole, termed the autophagosome (De Duve and Wattiaux, 1966; Klionsky et al., 2008). Degradation of the cytoplasmic substrates is initiated when the autophagosome fuses with degradative compartments of the endosomal–lysosomal system (Berg et al., 1998). Constitutive autophagy in neurons prevents ubiquitinated proteins from accumulating and is essential for cell survival (Hara et al., 2006; Komatsu et al., 2006). In addition to exerting control over cellular protein quality, autophagy is induced during nutritional deprivation, trophic factor withdrawal, and other types of cell stress to protect cells against apoptosis by degrading nonessential cell constituents for energy (Boland and Nixon, 2006; Finn and Dice, 2006). Autophagy contributes to cell remodeling during differentiation but strong induction during development initiates a form of “autophagic” programmed cell death in some cell populations (Levine and Klionsky, 2004). Overactive or dysfunctional autophagy may also promote neuronal cell death in disease states (Nixon, 2006).
The scarcity of recognizable autophagosomes and other autophagic vacuole (AV) intermediates in healthy neurons has raised the possibility that baseline autophagy in neurons is normally low and that the frequent presence of AVs in neurodegenerative states reflects an induction of autophagy (Boellaard et al., 1989; Anglade et al., 1997; Kegel et al., 2000; Ko et al., 2005; Nixon et al., 2005). For example, in Alzheimer's disease, AVs accumulate in enormous numbers within grossly distended, “dystrophic” neurites of affected neurons and also appear in other parts of neurons. The relative contribution of heightened autophagy induction to the robust AV expansion in Alzheimer's disease is uncertain, because it is also possible that AVs might accumulate to high numbers when autophagosomal digestion is impaired. An equilibrium exists between autophagosome formation and clearance by lysosomes (Chu, 2006), termed autophagic flux, and it is now known that terminal stages of autophagosomal degradation require uncompromised vesicular trafficking, heterotypic organelle fusion and lysosomal function (Kovács et al., 1982; Takeshige et al., 1992; Tanida et al., 2005; Kiselyov et al., 2007). Interestingly, a number of recent studies on various lysosomal storage disorders have found evidence of impaired AV clearance (Kiselyov et al., 2007; Settembre et al., 2008). Little is known about the responsiveness of neurons to modulation of the autophagic system. To begin to understand the underlying molecular basis for pathological autophagic patterns in neurodegenerative disease states, we investigated responses of primary cortical neurons to robust induction of autophagy. Alternatively, we interfered with clearance of autophagosomes by (1) impeding autophagosome trafficking and subsequent fusion with lysosomes or by (2) inhibiting lysosomal proteolysis. Morphological and biochemical indices of autophagic states revealed that in healthy neurons autophagosomes are actively formed and efficiently cleared. Interference with AV clearance, rather than induction of autophagy alone, gives rise to patterns of autophagy pathology resembling those seen in Alzheimer's disease.
Materials and Methods
Culturing and treatment of primary cortical neurons.
Primary cortical neurons were derived from day 0 (0–12 h postnatal) Sprague Dawley rat pups (Charles River). Pup brains were harvested and placed in ice-cold Hibernate-E medium (BrainBits) where the meninges were removed and the cerebral cortices were dissected. Cortices were minced using a scalpel and dissociated by incubating the tissue in Hibernate-E medium containing 15 U/ml papain (Worthington Biochemicals) for 30 min at 37°C before triturating in Neurobasal medium (Invitrogen) containing 20% fetal bovine serum (HyClone) and DNase (0.2 μg/ml). Undissociated brain tissue was removed by passing the cell suspension through a 40 μm cell strainer (Thermo Fisher Scientific). Dissociated neurons were centrifuged at 200 × g for 3 min at room temperature (RT), and the pellet was resuspended in Neurobasal medium supplemented with B27 (2%), penicillin (100 U/ml), streptomycin (100 U/ml), and glutamine (0.5 mm; all Invitrogen). Viable neurons were plated at a density of 100,000 cells per 13 mm circular cover glass and 250,000 cells per well in six-well tissue culture dishes, precoated with poly-d-lysine (50 μg/ml; Sigma-Aldrich), and incubated in a humidified atmosphere containing 5% CO2/95% atmosphere at 37°C. One-half of the plating medium was replaced with fresh pen/strep-free medium after 3 d. Serum-free, B27-supplemented Neurobasal medium ensured minimal growth of glial cells (<5%) after 5 d in culture.
After 5 d in vitro, cultured neurons were treated for 1, 6, and 24 h before fixation or harvesting. Treatment conditions and compounds used included rapamycin (10 nm; LC Laboratories), vinblastine (10 μm; Sigma-Aldrich), leupeptin (20 μm; Sigma-Aldrich), pepstatin A (20 μm; Sigma-Aldrich), and Earle's balanced salt solution (EBSS) (Invitrogen)
Electron microscopy and postembedding.
Cortical biopsy specimens were studied from a 74-year-old male with a clinical diagnosis of dementia and prominent dyspraxia. The patient underwent surgery for placement of a ventricular shunt, and frontal cortex tissue obtained next to the shunt penetration site revealed numerous neurofibrillary tangles and cored amyloid plaques consistent with the neuropathologic diagnosis of Alzheimer's disease as previously described (Nixon et al., 2005). Tissue was fixed in 3% glutaraldehyde/0.1 m phosphate buffer, pH 7.4, and postfixed in 1% osmium tetroxide in Sorensen's phosphate buffer. After dehydration in ethyl alcohol, the tissue was embedded in Epon (Electron Microscopy Sciences). Tissue blocks were cut serially into ultrathin (0.06 μm) sections. Ultrathin sections were stained with uranyl acetate and lead citrate. Transgenic mice expressing the Swedish mutation of human APP (APPK670M/N671L) and mutant PS1 (PS1M146L) (Duff et al., 1996) were studied at 16 months of age. Ultrathin sections of the cerebral cortex were cut from Epon-embedded blocks and placed on copper grids for structural analysis.
Neurons were fixed for electron microscopy (EM) by removing culture medium, washing (three times) in 37°C supplement-free Neurobasal medium, and adding 4% paraformaldehyde and 1% glutaraldehyde in 0.1 m sodium cacodylate buffer, pH 7.2 (Electron Microscopy Sciences), for 3 h at RT. After fixation, neurons were washed (three times) in cacodylate buffer, postfixed in 1% osmium tetroxide, progressively dehydrated in a graded series of ethanol (50–100%), and embedded in Epon. Thin sections of 1 μm were cut from the polymer, followed by ultrathin sections (70–80 nm) using a Recheirt Ultracut S microtome, and placed on copper grids for structural analysis. Grids were briefly stained with uranyl acetate and lead citrate before being examined with a Philips electron microscope (model CM 10). Images were captured on a digital camera (Hamamatsu; model C4742-95) using Advantage CCD Camera System software (Advanced Microscopy Techniques Corporation).
Transient DsRed–LC3 and green fluorescent protein–Endo transfection.
PCR-amplified coding sequences of LC3 in green fluorescent protein (GFP)-LC3 (provided by Noboru Mizushima, Tokyo Medical and Dental University, Tokyo, Japan) was subcloned into a pDsRed-monomer-C1 vector (Clontech) to create DsRed-LC3, and verified by sequencing. The pEGFP-Endo reporter vector, which encodes a fusion protein containing the human RhoB GTPase, was obtained from Clontech. Primary cortical neurons 3–4 d in vitro (DIV) plated in 35 mm glass-bottom dishes were transfected using Lipofectamine 2000 (Invitrogen) according to the manufacturer's suggested conditions. Briefly, 2 ml of conditioned (pretransfection) medium was replaced with transfection medium consisting of 1 μg of DNA, 5 μl of Lipofectamine 2000, 500 μl of Opti-Mem (Invitrogen), and 1.5 ml of Neurobasal medium without B27. Neurons were incubated with transfection media for 30 min at 37°C, followed by replacement (three times) with fresh Neurobasal medium. Conditioned medium was readded to the transfected neurons and maintained in the incubator for least 24 h before treatments.
BODIPY-pepstatin-FL labeling.
DsRed-LC3 transfected primary cortical neurons were incubated with 1 μm BODIPY-pepstatin-FL (Invitrogen) in Neurobasal medium for 1 h at 37°C followed by replacement with fresh Neurobasal medium (two times). Subsequently, Neurobasal medium was replaced with low-fluorescence Hibernate medium (BrainBits) to reduce fluorescent background, and cultures were placed in a 37°C humidified chamber with 5% CO2 on a Zeiss LSM510 confocal microscope. Z-stack images were acquired using LSM 520 software.
Neuron harvesting and immunoblot analyses.
Neurons (DIV 5) grown in six-well plastic dishes (BD Biosciences) were washed (three times) in PBS, pH 7.4, at RT, and then scraped in 200 μl/well of ice-cold lysis buffer [M-PER buffer containing Halt Protease Inhibitor Cocktail (1:100) and 50 μm EDTA; Pierce]. Protein concentration was determined using the Bradford Assay (Pierce) and samples were standardized to 1 μg/μl using 70% trichloroacetic acid to precipitate cell lysates that were resuspended in equal volumes of lysis buffer. Sample loading buffer (2×) (62.5 mm Tris-HCl, pH 6.8, 25% glycerol, 2% SDS, 0.01% bromophenol blue, 710 μm β-mercaptoethanol) was added to cell lysates at a 1:1 ratio with lysis buffer before heating samples for 5 min at 90°C. Tris-glycine gels (Invitrogen) were loaded with 25 μg/well protein and separated using a 10% gel for phospho-p70 S6 kinase (Thr 389), and total p70 S6 kinase (both from Cell Signaling) and a 16% gel to separate light chain 3 of microtubule-associated protein 1A/B (LC3-I) and LC3-II. Separated proteins were transferred onto 0.2 μm nitrocellulose membranes (Protran; Whatman) for 2 h at 250 mA (p70S6 kinase) or 8 h at 100 mA (LC3). Membranes were rinsed in Tris-buffered saline containing 0.1% Tween 20 (TBS-T) before being blocked at RT for 1 h in a 5% nonfat milk/TBS-T solution. Primary antibodies were diluted in a 1% BSA/TBS-T solution at 1:250 for both p-p70 and total p70, and at 1:1000 for LC3 (primary antibody raised against rattus LC3 based on a GST-tagged recombinant protein) (Yu et al., 2005). Membranes were incubated with primary antibody for 2 h at RT, washed three times in TBS-T, and then incubated for 1 h at RT in secondary antibody solution (3% nonfat milk/TBS-T) containing alkaline phosphatase-conjugated secondary antibodies (Promega) for p-p70S6 kinase and total p70S6 kinase blots, and a horseradish peroxidase-conjugated antibody for LC3 blots (GE Healthcare). Membranes were washed three times for 10 min in PBS-Tween before chemiluminescent substrates (CDP-Star; Applied Biosystems; ECL; GE Healthcare) were applied and membranes were exposed to x-ray film. Densitometry of bands representing protein expression was done using Image-J (NIH Image, version 1.63) software from the National Institutes of Health. For each immunoblot, the band intensity of each lane was normalized relative to the control lane. Subsequently, the percentage change between treatments was calculated based on the normalized values.
Immunocytochemistry.
Neurons were fixed for immunocytochemistry analyses by removing culture medium, washing (three times) in PBS, and adding 4% paraformaldehyde/PBS, pH 7.4, for 15 min at RT. Neurons were permeabilized for 15 min in 0.02% Triton X-100/PBS and then blocked for 1 h at RT with a 2% fetal bovine serum/0.02% Triton X-100/PBS blocking solution. Primary antibodies were made up in blocking solution and incubated for 2 h with neuron-specific class III β-tubulin (1:1000; TUJ-1; R&D Systems), overnight for LC3 (1:250; Nanotools) and cathepsin D (1:5000; in house) at 4°C. Cells were washed (three times) in PBS for 10 min before incubation with TRITC (tetramethylrhodamine isothiocyanate)- and FITC (fluorescein isothiocyanate)-labeled secondary antibodies (1:1000/blocking solution; Invitrogen) for 1 h at RT. Neurons were washed (three times) in PBS for 10 min before mounting coverslips onto microscope slides with anti-fade Gelmount (Biomeda) and visualized using a Zeiss confocal microscope.
Immunoelectron microscopy.
Neurons were fixed with 4% paraformaldehyde, 0.15% glutaraldehyde, and 4% sucrose in 0.1 m sodium cacodylate buffer in Neurobasal media for 30 min at 37°C followed by incubation in fixative without Neurobasal at 4°C for 24 h. Preembedding and postembedding immuno-EM were done in parallel, using the same primary antibody. For preembedding, cells were incubated with 0.1% sodium borohydride in PBS for 15 min and washed (four times) in PBS for 10 min. Cells were permeabilized with 0.05% Triton X-100 in PBS for 30 min, washed in PBS (four times) for 10 min, and then blocked with 5% BSA and 5% normal goat serum in PBS for 1 h at 4°C. Cells were incubated with primary antibody polyclonal cathepsin D (1:2000 in blocking buffer) at 4°C overnight followed by washing and incubation with ultrasmall gold-conjugated goat anti-rabbit secondary antibody (1:100 in blocking buffer) for 2 h at RT. Ultrasmall gold was silver-enhanced with Custom Ultra Small kit (Electron Microscopy Sciences) using the manufacturer's guidelines. After silver enhancement, cells were postfixed with osmium tetroxide and processed for EM, as described previously (Yu et al., 2005). For postembedding immuno-EM, cells were fixed with freshly made 3% paraformaldehyde containing 0.1% glutaraldehyde and 4% sucrose in 0.1 m sodium cacodylate buffer. After fixation, cells were washed, dehydrated, and embedded in Lowicryl K4M (Polysciences) and polymerized under UV light (360 nm) at −35°C. Ultrathin sections were cut and mounted on Formvar and carbon coated nickel grids. After incubation with primary antibodies at 4°C overnight, gold-conjugated secondary antibodies [18 nm Colloidal Gold-AffiniPure Goat Anti-Rabbit IgG(H+L); Jackson ImmunoResearch Laboratories; 15 nm Protein A Gold; Cell Microscopy Center, University Medical Center Utrecht, Utrecht, The Netherlands] were applied and stained with uranyl acetate and lead citrate by standard methods. Postembedding immunogold electron microscopy on human brain was performed as previously described (Nixon et al., 2005).
Morphometric analysis.
The number of autophagic vacuoles per cell body were counted using EM images at direct magnification of 10,500× (64 μm2) for the various treatment conditions. Electron micrographs (25–100 images per treatment condition) were examined, and values are expressed as AVs per field. For our analysis, we identified AVs as compartments of 0.5 μm in diameter or larger. Autophagic vacuoles were further classified according to whether they were autophagosomes or autolysosomes based on two qualities: autophagosomes have double membranes and uncompacted cytoplasmic material including organelles such as mitochondria and ribosomes, whereas autolysosomes are single- or double-membrane-limited vesicles with densely compacted amorphous or multilamellar contents. All numerical values are expressed as mean ± SEM.
Results
Autophagy induction in neurons
As a baseline for studies of autophagy induction, we used neurons from postnatal rat pups [postnatal day 0 (P0)] grown for 5 d in a nutrient-rich condition in the presence of serum supplement, B27. Exposure of these cells to rapamycin (10 nm) for 1 h rapidly induced autophagy, as evidenced by a 78 ± 4.5% decrease in mammalian target of rapamycin (mTOR)-mediated phosphorylation of p70 S6 kinase (ratio of phosphorylated p70 to total p70) compared with untreated neurons (Fig. 1A,B). Decreased mTOR activity was sustained during rapamycin treatment for 6–24 h (Fig. 1A,B). Posttranslational modification of cytosolic LC3-I to LC3-II is followed by LC3-II translocation to nascent autophagosomal membranes, which is a useful index of autophagosome formation (Mizushima, 2004). Rapamycin elevated LC3-II levels by 55 ± 3% at 1 h and by 80–90% from 6 to 24 h (Fig. 1D). Tubulin levels, serving as an additional independent control protein, did not change significantly under any of the conditions of analysis in this study.
Figure 1.

Autophagy induction in primary cortical neurons. A, Western blot analyses showing a rapid and sustained decrease in mTOR-mediated phosphorylation of p-p70 immunoreactivity relative to total p70 immunoreactivity after rapamycin (10 nm) addition to the medium for 1–24 h. B, Densitometric analyses of gels in A (n = 6; mean ± SEM): ratios of immunoreactive p-p70 relative to total p70 in rapamycin-treated neurons are expressed as a percentage of the untreated control value for each time point (***p < 0.001). C, Representative blot of LC3-I and LC3-II immunoreactivity in neurons treated with rapamycin (10 nm) for 1, 6, and 24 h. D, Graph depicting changes in LC3-I, LC3-II, and tubulin levels in neurons treated with rapamycin 1, 6, and 24 h (*p < 0.05). E, Immunostaining for LC3 distribution in control cortical neurons and rapamycin-treated (10 nm; 24 h) neurons. F, The arrows indicate punctate LC3 representative of AV membranes. Scale bars, 5 μm. G–I, Live imaging of BODIPY-pepstatin-FL in DsRed-LC3 transfected neurons. DsRed-LC3 is primarily cytosolic in control neurons (G, left panel) but relocated into vesicles after treatment with rapamycin (10 nm) for 6 h (H, left panels). Rapamycin-induced AVs contain lysosomal enzymes: H and I, inset, illustrate varying degrees to which autolysosomes have matured to lysosomes. Background BODIPY-pepstatin-FL labeling indicates lysosomal compartments in neighboring untransfected neurons. Scale bars: G–I, 10 μm.
Cortical neurons cultured in nutrient-rich media for 5 d rarely contained autophagosomes identified by LC3 labeling or by ultrastructural analysis (Figs. 1E, 2A,B). Rapamycin (10 nm) treatment of neurons for 24 h caused LC3 immunoreactivity in perikarya to redistribute from the cytosol to vesicular structures (Fig. 1F). To visualize the maturation of autophagic vacuoles, we transfected neurons with DsRed-tagged LC3 (DsRed-LC3) and loaded them with BODIPY-pepstatin-FL, a fluorescent probe that binds to active cathepsin D and is an indicator of protease activity and indirectly of vesicle acidification. LC3-positive vesicular compartments were relatively uncommon, whereas BODIPY-positive lysosomes were abundant in neurons under basal conditions (Fig. 1G). In rapamycin-treated neurons, DsRed-LC3 redistributed from the cytosol to AVs (Fig. 1H). The stronger vesicular LC3 in DsRed-transfected neurons compared with endogenous LC3 detected by immunostaining (Fig. 1, compare F, H) can be explained by transient overexpression of DsRed-LC3 and its relative stability in the lumen of the AV. Despite strong autophagy induction for 6 h with rapamycin (10 nm), the vast majority of the DsRed-LC3-positive compartments contained abundant active cathepsin D, indicating that fusion with lysosomes occurs rapidly after autophagosome formation (Fig. 1I). These AVs contained LC3 on the limiting membrane as well as incompletely degraded DsRed-LC3 in the lumen (Fig. 1I, left inset) and were classified as autophagolysosomes, or autophagosomes that have undergone fusion with lysosomes and hereafter referred to as autolysosomes. Under the same conditions, AVs that predominantly contained cathepsin but displayed only traces of undegraded ds-Red LC3 in the lumen were also observed, representing a more mature autophagosome or autolysosome (Fig. 1G,I). EM analyses of rapamycin-treated neurons revealed markedly increased proportions of large (0.5–1 μm) relatively clear vacuoles in cell bodies containing scattered amorphous material after 1 h (Fig. 2C) and through to 24 h (Fig. 2E). Overall, the ultrastructure of most AVs in rapamycin-treated neurons resembled lysosomes observed in untreated neurons (Fig. 2G) that were enlarged. We collected counts of autophagosomes and autolysosomes on a series of electron micrograph images of cell bodies from rapamycin-treated and control neurons and found that autolysosomes were significantly greater in number (8.21 ± 1.33 per field; p < 0.001) than autophagosomes (2.42 ± 0.56 per field; p < 0.001) compared with controls (0.11 ± 0.15 per field). Furthermore, in immuno-EM analyses, almost all AVs accumulating after rapamycin treatment contained immunogold-labeled cathepsin D, many at levels similar to those in lysosomes of neurons under basal conditions (Fig. 2H). These results indicate that neurons initiate and sustain autophagy induction when mTOR is inhibited; however, they do not accumulate large numbers of autophagosomes, which are efficiently converted to autolysosomes by lysosomal hydrolases (Tanida et al., 2004).
Figure 2.

A, B, AV ultrastructure in neurons during autophagy induction: 5-d-old primary cortical neurons displayed few AVs in their cell bodies (A) (scale bar, 2 μm) and neurites (B). C, Appearance of large clear autophagic fusion compartments in the cell body after rapamycin (10 nm) treatment for 1 h. D, Electron-dense sequestered material was observed in neurites after rapamycin (10 nm) treatment for 1 h. E, F, Prolonged activation of autophagy with rapamycin (10 nm; 24 h) revealed multiple autophagic compartments in both cell bodies (E) and neurites (F). G, H, Ultrastructural localization of cathepsin D in control (G) and rapamycin (10 nm; 6 h)-treated neurons by silver-enhanced immunogold labeling with cathepsin D antibody (H). In control neurons, cathepsin D is abundant in lysosomes with relatively little electron-dense content (arrows). Most AVs in rapamycin-treated neurons are decorated with silver-enhanced immunogold (arrows), indicating the presence of cathepsin D. Scale bars, 500 nm (except as otherwise noted).
Cathepsin inhibition induces accumulation of autophagic vacuoles with characteristic morphologies
Lysosomal proteolysis is predominantly mediated by cysteine and aspartyl proteases, which are inhibited by leupeptin and pepstatin, respectively. In neurons treated with leupeptin, pepstatin, or both, the levels of total p70S6k and p-p70S6k (phospho-Thr 389) remained comparable with those in untreated neurons (Fig. 3A,B), indicating that cathepsin inhibition does not lead to autophagy induction through mTOR inhibition. However, even in the absence of mTOR inactivation, leupeptin (20 μm) increased LC3-II levels more than fourfold over that of control LC3-II levels by 24 h (Fig. 3C,D). LC3-positive compartments also became significantly more numerous after cotreatment with leupeptin and pepstatin (Fig. 3E), considerably exceeding the numbers seen in rapamycin-treated cultures (Fig. 1F). The cysteine protease inhibitor, leupeptin, did not alter cathepsin D activity in DsRed-LC3 vesicles (Fig. 3E), but DsRed-LC3 levels were higher in most vesicles compared with those after rapamycin treatment (compare Figs. 1H,I, 3E). The pEGFP-Endo reporter vector encodes a fusion protein containing the human RhoB GTPase, and labels endocytic compartments. To confirm delayed degradation of endosomes as well as autophagosomes when lysosomal proteases are impaired, we transfected primary neurons with GFP-Endo and immunostained for LC3 and cathepsin D. GFP-Endo does not colocalize with cathepsin D under normal conditions (Fig. 3F, left panel), but occasionally colocalizes with LC3-positive AVs, although this was rare because vesicular LC3 is not often observed in untreated neurons (Fig. 3F, middle panel). After treatment with leupeptin and pepstatin, vesicles were identified that were both GFP-Endo-positive and LC3-positive (Fig. 3G, middle panel, arrows). Most of these profiles contained cathepsin D (right panel, inset, arrow) similar to the DsRed-LC3/BODIPY-pepstatin-positive AVs that accumulated under the same condition. The presence of endosomal and autophagosomal marker proteins with cathepsin D indicates many of these compartments are amphisomes (Gordon and Seglen, 1988). Also, GFP-Endo-positive vesicles containing cathepsin D (Fig. 3G, left panel, inset, arrows) were detected, which confirmed impaired degradation of endocytic as well as autophagic compartments, when lysosomal proteases are inhibited. These results indicate that cathepsin inhibition promotes accumulation of autophagic compartments including amphisomes, and that degradation within these compartments is impaired. Numbers of predominantly double-membrane-limited AVs containing amorphous electron-dense material began to rise by 6 h in the cell bodies (Fig. 4A) and some neurites (Fig. 4B) of leupeptin-treated neurons and were very abundant in both perikarya and neurites by 24 h of treatment with leupeptin (Fig. 4C,D) (5.85 ± 1.46 per field, p < 0.01, vs control, 1.27 ± 0.48 per field). Pepstatin also elevated LC3-II levels twofold but did not significantly enhance the effect of leupeptin when the two inhibitors were combined. As expected, virtually all AVs that accumulated after 24 h leupeptin treatment contained cathepsin D immunoreactivity, indicating that these structures were autolysosomes (Fig. 4E), confirming morphometric analysis showing 75% of the AVs appear to be autolysosomes.
Figure 3.
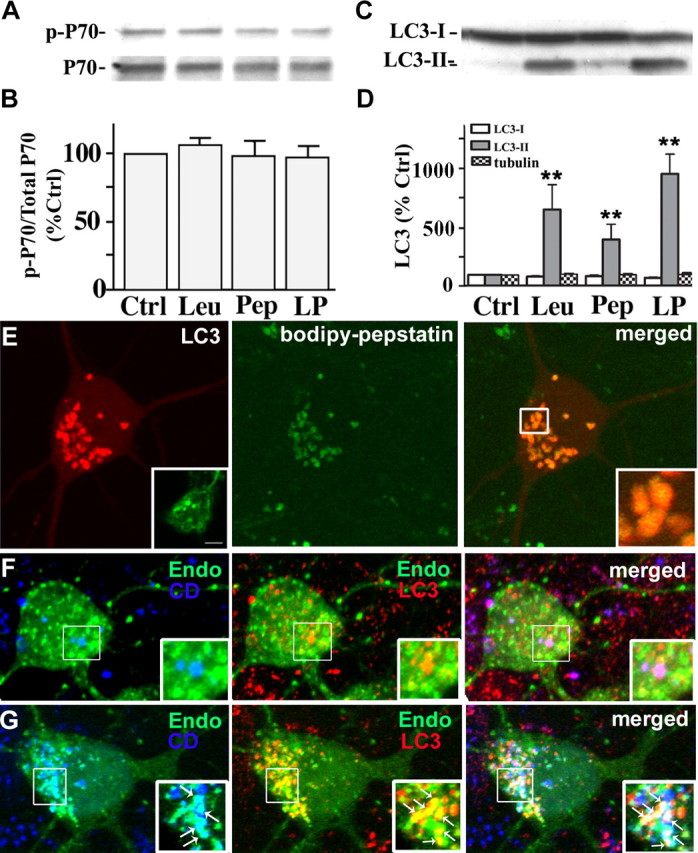
Cathepsin inhibition markedly elevates LC3-II levels without inducing mTOR-mediated autophagy. A, Immunoblot analyses of phospho-p70 and total p70 after leupeptin (20 μm), pepstatin (20 μm), or both (LP) were added to the medium for 24 h. B, Densitometric analyses of gels in A (n = 5): ratios of phospho-p70 relative to total p70 are expressed as a percentage of the untreated control value. Error bars indicate SEM. C, Immunoblot analyses of LC3-I and LC3-II after neurons were exposed to protease inhibitors for 24 h. D, Densitometric analyses of LC3-I, LC3-II, and tubulin immunoreactivity in neurons after protease inhibitor treatment (n = 5; **p < 0.01). E, Live image of DsRed-LC3 transfected neurons treated with leupeptin (20 μm) for 24 h loaded with BODIPY-pepstatin-FL. Vesicular LC3 localizes within BODIPY-pepstatin-positive compartments: lack of degradation results in a strong LC3 signal (E, right panel inset). Neurons treated with leupeptin and pepstatin for 24 h immunostained for LC3 show a similar pattern of punctate LC3 accumulation (E, left panel inset). F, GFP-Endomarker transfected neurons immunostained with LC3 (red) and cathepsin D (blue). Under normal conditions, LC3 and GFP-Endo occasionally colocalize (F, middle panel inset), whereas endosomes and cathepsin D do not (F, left panel inset). Cotreatment with leupeptin and pepstatin causes accumulation of LC3- and GFP-Endomarker-positive amphisomes (G, middle panel, arrows), as well as GFP-Endomarker and cathepsin D-positive endosomes and lysosomes.
Figure 4.
Ultrastructure and cathepsin D content of AVs accumulating after exposure of neurons to leupeptin (20 μm). A–C, After 6 h, numbers of mainly double-membrane-limited autophagosomes containing amorphous electron-dense material are seen in the cell bodies of some neurons (A) and in neurites (B), which was more evident after 24 h in all neurons (C). D, Undegraded organellar material was also present in AVs within the neurites of neurons after 24 h. AV morphologies were similar in neurons treated with leupeptin plus pepstatin (data not shown). E, Silver-enhanced immunogold ultrastructural localization of cathepsin D in AVs (arrowheads) in neurons treated with leupeptin (24 h; 20 μm). Scale bars, 500 nm.
To superimpose autophagy induction on inhibited lysosomal proteolysis, we grew additional neurons in EBSS, a glucose-containing medium that is devoid of amino acids and other growth factors. All EBSS-cultured neurons showed a rapid decrease in p70S6k expression relative to that in neurons grown in the presence of serum (Fig. 5A,B). LC3-II levels after starvation alone, were not detectably elevated, and LC3-I levels were reduced after 24 h (11 ± 1%), suggesting that LC3-II turnover under these extreme induction conditions partially depletes LC3-I levels (Fig. 5C,D). In contrast, starvation in the presence of leupeptin raised LC3-II levels 20-fold after 24 h (Fig. 5C,D). Starved neurons treated with pepstatin had no additional effects on LC3 levels beyond those found in nutrient sufficient conditions or when combined with leupeptin. As seen after rapamycin-mediated autophagy induction, neurons starved of nutrients (EBSS) for 24 h accumulated large vacuolar compartments that were devoid of most organellar material, corresponding to autolysosomes (Fig. 5E). In contrast, impeding degradation with leupeptin and pepstatin in the starved neurons caused granular material to accumulate in AVs (Fig. 5F) that were characterized ultrastructurally as primarily double-membrane-limited vesicles containing amorphous electron-dense or multilamellar material (Fig. 5G,H).
Figure 5.
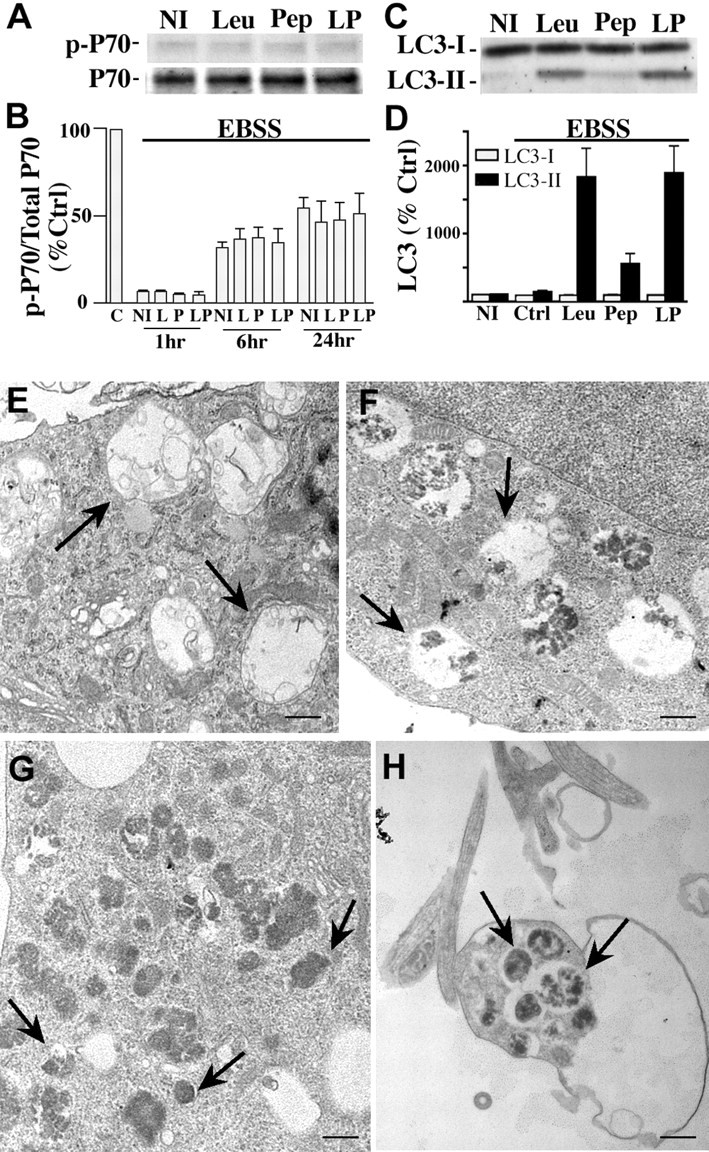
Autophagy induction by serum starvation with or without cathepsin inhibition. A, Western blot analyses of p-p70 and total p70 in neurons grown in EBSS in the absence [no inhibitor (NI)] or presence of pepstatin (Pep, P; 20 μm), leupeptin (Leu, L; 20 μm), or both (LP) for 24 h. B, Densitometric analyses of multiple gels in A (n = 5): ratios of p-p70 and p70 immunoreactivity are expressed as a percentage of the untreated control (C) value shown at 100% (p < 0.0001 for 1 h, p < 0.001 for 6 h, and p < 0.05 for 24 h treatments in EBSS culture media). Error bars indicate SEM. C, Representative immunoblots of LC3-I and LC3-II immunoreactivity in neurons grown in EBSS in the absence or presence of protease inhibitors for 24 h. D, Densitometric analyses of LC3-I and LC3-II levels after neurons grown in EBSS in the absence or presence of protease inhibitors for 24 h. In B and D, densitometric values are expressed as ratios of immunoreactivity levels after each inhibitor treatment relative to the corresponding ratio for untreated control neurons grown in NBM/B27. E, Ultrastructure of AVs in neuronal perikaryon after growth in EBSS for 24 h (F) EBSS with leupeptin (20 μm) and pepstatin (20 μm) for 6 h. Scale bar, 500 nm. G, H, Cell body (G) and neurite (H) of neurons cultured in EBSS with leupeptin (20 μm) and pepstatin (20 μm) for 24 h. Arrows indicate different AV morphologies seen in each treatment. Scale bars, 500 nm.
Inhibition of autophagosome–lysosome delivery induces rapid AV accumulation in neurons
The microtubule-depolymerizing compound, vinblastine, disrupts cytoskeletal-dependent vesicular transport and subsequent fusion of autophagosomes with endosomal and lysosomal compartments (Marzella et al., 1980; Kovács et al., 1982; Gordon and Seglen, 1988; Köchl et al., 2006). It has also recently been shown that, in addition to blocking AV clearance by lysosomes, vinblastine induces autophagy (Köchl et al., 2006). Consistent with the latter observation, vinblastine (10 μm) decreased p70 phosphorylation by 31 ± 12% at 6 h and by 71 ± 7% at 24 h (Fig. 6A,B). Vinblastine progressively raised LC3-II to levels well beyond those seen after inducing autophagy with rapamycin. LC3-II levels rose 128 ± 44% by 1 h, 289 ± 93% after 6 h, and 444 ± 102% after 24 h of rapamycin treatment (Fig. 6C,D), in the absence of a change in LC3-I levels. LC3 immunoreactivity also redistributed to abundant punctate structures in the cell body and neurites in the presence of vinblastine. Vinblastine treatment for 24 h caused extensive AV accumulation and neuritic degeneration evident in immunolabeling studies with class III β-tubulin antibody (Fig. 6H). In contrast, exposure of neurons to rapamycin or leupeptin had no discernable effects on microtubule integrity (Fig. 6F,G).
Figure 6.

Vinblastine effects on AV accumulation and autophagy induction. A, Western blot analyses of p-p70 and total p70 after exposure of neurons to vinblastine (10 μm) for 1–24 h. B, Densitometric analyses of immunoblots in A (n = 6): ratios of p-p70 relative to total p70 are expressed as percentages of the control value from each set of treatments (*p < 0.05; **p < 0.01; ***p < 0.001). Error bars indicate SEM. C, Representative immunoblots of LC3-I and LC3-II in neurons exposed to vinblastine (10 μm) for 1, 6, and 24 h. D, Densitometry of LC3-I, LC3-II, and tubulin levels after neurons exposed to vinblastine (10 μm) for 1, 6, and 24 h (n = 6; *p < 0.05, **p < 0.01). E–H, Immunostaining of primary neurons stained with TUJ-1 antibody for neuron-specific β-III-tubulin. Tubulin remains intact when autophagy is induced (F) or lysosomal proteolysis is inhibited by leupeptin (20 μm) (G), but is disrupted after 24 h treatment with vinblastine (10 μm) (H). Scale bars, 5 μm. I, J, Live image of BODIPY-pepstatin-FL in DsRed-LC3 transfected neurons after treatment with vinblastine (10 μm). Autophagosomes that have not fused with lysosomes are the predominant AVs accumulating after 1 h of vinblastine (I, right panel). J, After 6 h of vinblastine, LC3 mostly colocalizes with BODIPY-pepstatin vesicles indicating that fusion between autophagosomes and lysosomes occurs despite impairment in microtubule-dependent lysosome transport. K, AV accumulation seen in vinblastine (10 μm; 1 h)-treated neurons immunostained with LC3 antibody. L, Quantification of vesicular profiles in DsRed-LC3 transfected cells loaded with BODIPY-pepstatin. The average number of each vesicle type is shown as a percentage of the total number: red, autophagosome (AP); orange, autolysosome (AL); yellow, lysosomes with minimal traces of DsRed-LC3; green, lysosomes. In untreated neurons transiently expressing DsRed-LC3 loaded with BODIPY-pepstatin, most vesicles (∼80%) are lysosomes. Autophagosomes are efficiently fused with lysosomes after rapamycin because the proportion of autophagosomes remains very low, and only autolysosomes are increased. Between 1 and 6 h of vinblastine treatment, autophagosome maturation also occurs as indicated by the increased proportion of autolysosomes.
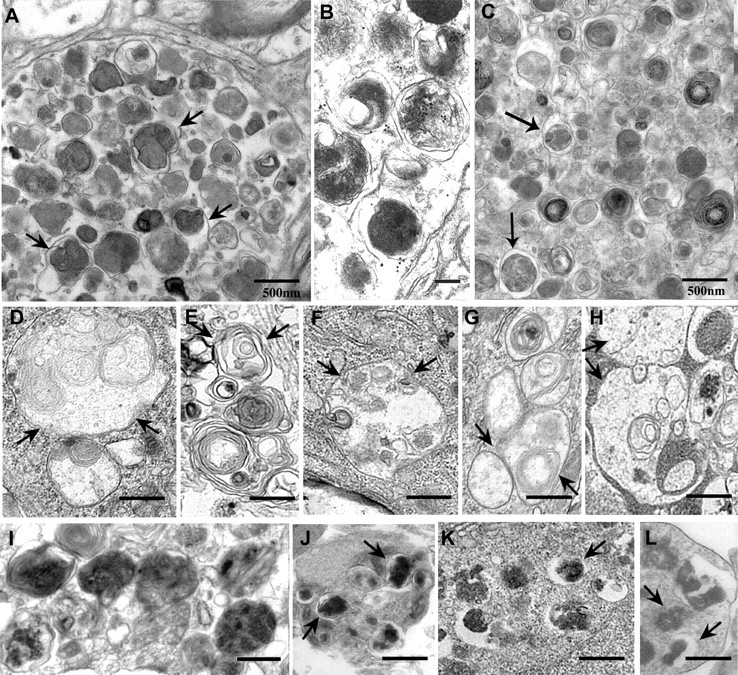
AVs accumulating within 1 h of vinblastine in DsRed-LC3 transfected neurons resembled endogenous LC3 immunolabeling after the same vinblastine treatment (Fig. 6I, left panel and inset). These AVs were autophagosomes that appeared red and lacked BODIPY-pepstatin (Fig. 6I, right panel inset, arrowhead) or autolysosomes that appear orange (red vesicle containing green BODIPY-pepstatin in the lumen; arrows) where AV–lysosome fusion has already occurred. In contrast, DsRed-LC3 vesicles containing BODIPY-pepstatin increased after 6 h of vinblastine (Fig. 6J,K), indicating that some extent of fusion with lysosomes occurs in the presence of vinblastine. To quantify the degree of delayed AV maturation caused by vinblastine, vesicular profiles of DsRed-LC3/BODIPY-pepstatin labeled neurons were quantified after rapamycin (10 nm, 6 h) and vinblastine (10 μm) for 1 and 6 h (Fig. 6L). DsRed-LC3 vesicles lacking any BODIPY-pepstatin were identified as autophagosomes (red; AP), whereas DsRed-LC3 positive vesicles containing BODIPY-pepstatin in the lumen were classified as autolysosomes (orange; AL). BODIPY-pepstatin-positive vesicles containing traces of DsRed-LC3 (yellow; LY) and BODIPY-pepstatin-only vesicles (green; LY) were characterized as lysosomes. Total vesicle counts per neuron were made for at least 15 cells under each condition and the fraction of each profile was reflected as a percentage of the total number of LC3 and BODIPY-pepstatin-positive vesicles. Efficient AV maturation was found in rapamycin-treated neurons, whose AV profiles were mostly autolysosomal (Fig. 6L, orange bar) (39.4%) and autophagosomes were rare (<1%). In contrast, vinblastine-mediated impairment of AV transport/fusion at 1 h increased the proportion of autophagosomes (red bar) (22.7%), whereas similar proportions of autolysosomes were maintained (39%). Extending vinblastine treatment for 6 h did not increase the relative proportion of autophagosomes, but increased the percentage of autolysosomes (57.3%) and decreased the proportion of lysosomes. In contrast to rapamycin treatment, vinblastine reduced the proportion of lysosomes, which may indicate a delayed completion of proteolysis from autolysosome to lysosome. Initial maturation steps occur with vinblastine treatment, but the impaired fusion efficiency between AVs and lysosomes are such that incompletely degraded autolysosomes accumulate. At the ultrastructural level, the morphology of AVs that rapidly accumulated within the cell bodies (Fig. 7A) and neurites (Fig. 7A, inset) after 1 h of vinblastine treatment corresponded frequently (44%) to autophagosomes (5.46 ± 0.86 per field, p < 0.001, vs control, 0.11 ± 0.15 per field), containing undigested uncompacted organellar material within single- and double-membrane-limited vesicles (Fig. 7A, middle panel). Lysosomotropic agents such as ammonium chloride (NH4Cl) neutralize acidic compartments and caused accumulation of morphologically similar autophagosomes by preventing autophagosome–lysosome fusion (Fig. 7A, bottom inset). By immunoelectron microscopy, cathepsin D was absent in these structures after short exposure to vinblastine, confirming that they were autophagosomes (Fig. 7C). After 6 h of vinblastine treatment, the AVs in neuronal cell bodies (Fig. 7B) and neurites (Fig. 7B, inset) were in the majority (63%) classified as autolysosomes (5.54 ± 1.04 per field, p < 0.001, vs the numbers in control cells, 1.27 ± 0.40 per field), which were single-membrane-limited vesicles containing amorphous electron-dense material and cathepsin D immunoreactivity (Fig. 7D). The change in morphology of AV intralumenal substrates between 1 and 6 h suggested that, despite impaired fusion with lysosomes, limited hydrolysis of substrates is possible within autophagosomes, but is insufficient to degrade the inner limiting membrane of most autophagosomes.
Figure 7.

Ultrastructure and cathepsin D content of AVs accumulating after exposure of neurons to vinblastine (10 μm). A, Vinblastine treatment caused accumulation of predominantly double-membrane-limited AVs containing organelle structures with mostly undegraded material (arrows) in the cell body and neurites (inset) after 1 h, similar in morphology to autophagosomes that accumulated after treatment with ammonium chloride (50 mm, 6 h; bottom inset). C, These structures contained undetectable levels of cathepsin D by silver-enhanced immunogold labeling. B, D, After 6 h of vinblastine treatment, double-membrane-limited AVs contained more amorphous electron-dense material and cathepsin D (D) reflecting partial digestion of autophagosomal contents in cell bodies (B, arrows) and neurites (B, inset). Most AVs at 6 h after vinblastine were decorated by silver-enhanced immunogold-conjugated cathepsin D antibodies. Scale bars, 500 nm.
Comparison to AV pathology in AD brain and AD mouse models
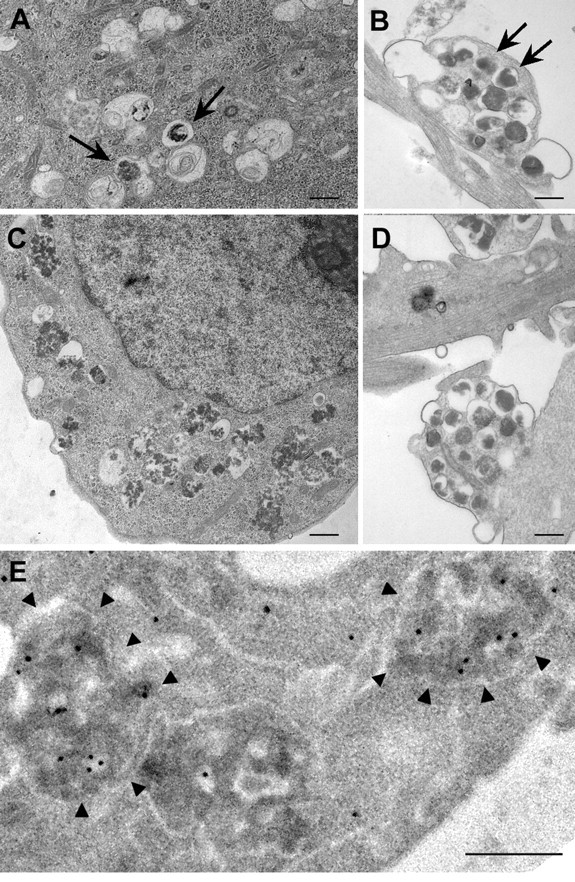
In Alzheimer's disease, AVs with distinct morphologies accumulate in dystrophic neurites in massive numbers (Nixon et al., 2005; Yu et al., 2005). The most prevalent morphology consisted of single- and double-membrane-limited vesicles with densely compacted amorphous or multilamellar contents (Fig. 8A). The majority of the compartments were labeled by immunogold-conjugated cathepsin D antibodies in immunoelectron microscopy analysis (Fig. 8B) (Nixon et al., 2005). Similar AV morphologies were seen in dystrophic neurites from PS/APP mice (Fig. 8C). The patterns within dystrophic neurites of AD brains were distinct from those that form in neurites and perikarya of treated primary cortical neurons after autophagy induction alone or after acute autophagosome–lysosome delivery impairment (Fig. 8D–H). In contrast, AV morphologies in AD strongly resembled the AV patterns generated in neurites and cell bodies of primary cortical neurons in which autophagosome proteolysis was inhibited or events required for efficient autophagosome–lysosome fusion were impaired but not entirely prevented (Fig. 8I–L). This morphologic pattern and AV accumulation were further accelerated when autophagy induction was superimposed.
Figure 8.
A–C, Comparison of AV ultrastructure in Alzheimer's disease and treated primary neurons: In the brains of patients with Alzheimer's disease (A, B) or the brain of a PS/APP mouse model of AD (C), dystrophic neurites in cerebral cortex contain robust accumulations of single- and double-membrane-limited AVs with electron-dense content, which contain cathepsin D (B). D–L represent the internal morphology of primary neurons during different autophagy modulating conditions. D and E depict conditions in which autophagy is strongly induced: cell body (D, F) and neurite (E) of rapamycin (10 nm; 24 h)-treated neurons; cell body (G) of EBSS-starved neurons (24 h). H depicts autophagosomes in perikarya after 1 h vinblastine treatment in which autophagosome fusion with lysosomes are severely impaired. I–L depict conditions involving impaired AV clearance illustrating AV morphologies resembling those in AD brain: cell body of vinblastine (10 μm)-treated neurons for 6 h (I, J); cell body (K) of EBSS plus pepstatin (20 μm; 24 h)-treated neurons; cell body (L) of leupeptin (20 μm; 24 h)-treated neurons. Arrows indicate different AV morphologies seen in each treatment. Scale bars, 500 nm.
Discussion
Although the scarcity of AVs in the healthy brain (Mizushima et al., 2004; Nixon et al., 2005) has suggested a low activity of autophagy in neurons, we provide evidence that constitutive autophagy is relatively active in primary cortical neurons. Autophagosomes accumulated relatively rapidly when their clearance was prevented by blocking lysosomal proteolysis with cathepsin inhibitors. Considering the inhibition of lysosomal degradation did not induce autophagy, accumulating AVs may represent constitutive autophagosome formation in neurons under these conditions. The findings accord with our observation that intraventricular infusion of leupeptin in mice also induces a marked buildup of electron-dense autophagosomes and autolysosomes in neurons (S. D. Schmidt, S. Lee, R. A. Nixon, unpublished data). Our results also complement recent studies in which blocking autophagosome formation by deletion of the Atg5 or Atg7 genes caused accumulation of ubiquitinated proteins and eventual neurodegeneration, demonstrating that autophagy is both constitutive and essential for neuronal survival (Hara et al., 2006; Komatsu et al., 2006). In our study, the rapid accumulation of AVs within hours after protease inhibition in primary cortical neurons highlights an even greater basal level of autophagic activity than is suggested by the slow accumulation of ubiquitinated proteins over many days when autophagosome formation is prevented in vivo.
Of significant relevance to pathological states of autophagy, our data show that newly formed autophagosomes are normally eliminated efficiently in neurons by fusing with lysosomes, thereby avoiding a buildup of autophagic intermediates even when autophagy is strongly induced. The efficiency of this process in neurons accounts for previous observations that AV intermediates in the autophagic pathway are relatively uncommon in normal brain tissue (Mizushima et al., 2004; Nixon et al., 2005). Neurons exhibited similar responses to strong autophagy induction by two different inhibitors of the mTOR kinase pathway: rapamycin, a direct inhibitor of the mTOR complex (Blommaart et al., 1995; Sabers et al., 1995), and nutrient deprivation, which inactivates the PI3K (phosphoinositide 3-kinase)–AKT pathway leading to mTOR suppression (Barber et al., 2001; Vander Haar et al., 2007). Surprisingly, under maximal mTOR suppression, LC3-II-positive autophagosomes were only modestly increased in number, although AVs in later stages of digestion identified by electron microscopy were much more numerous. These vesicular profiles, which were strongly cathepsin-positive, correspond to autolysosomes (Lawrence and Brown, 1992; Eskelinen, 2005), which are larger than lysosomes, are relatively electron-translucent, and contain partially digested substrates. These observations indicate that, even under strong autophagy induction conditions, the fusion of autophagosomes with late endosomal and lysosomal compartments is highly efficient. Interestingly, in non-neuronal cells, such as fibroblasts and blastocysts (Tanida et al., 2004; Yu et al., 2005), acute autophagy induction does lead to greater transient accumulations of autophagosomes and larger LC3-II elevation than in neurons, underscoring cell type differences in the efficiency of AV clearance by lysosomes.
During AV clearance, fusion with a lysosome introduces into the autophagosome >60 hydrolases with acidic pH optima and a membrane-spanning proton pump (V-ATPase) that lowers the intralumenal pH to levels required for optimal protease activation (Sun-Wada et al., 2003). Intact microtubules are needed for AV transport, which facilitate fusion between autophagosomes and late endosomal and lysosomal compartments (Kovács et al., 1982; Köchl et al., 2006). As predicted, vinblastine, an inhibitor of microtubule assembly and of autophagosome transport to lysosomes, induced the rapid accumulation of autophagosomes and prevented the turnover of LC3-II associated with these compartments. The accumulation of immature AVs in neurites in these neurons within hours of vinblastine treatment (as also observed with protease inhibitors) accords with evidence for active ongoing autophagy in these processes. Previous studies of growing neurons in culture have shown that autolysosome formation is active in neurites, as evidenced by the progressive acidification of retrogradely transported vesicles with AV characteristics (Overly et al., 1995). In our study, longer vinblastine treatment transformed large autophagosomes containing undigested organellar material into smaller (0.3–1.0 μm) vesicles. These vesicles retained some features of immature AVs (e.g., double membranes), but exhibited an amorphous dense intralumenal content, implying that limited proteolysis occurred within these compartments, although autophagosome maturation was incomplete. Although vinblastine indirectly reduces AV fusion with endosomal and lysosomal compartments by disrupting microtubule-dependent AV transport (Gordon and Seglen, 1988; Köchl et al., 2006), evidence that fusion itself is unaffected has been reported (Punnonen and Reunanen, 1990). Thus, residual stochastic fusion events may be sufficient to partially digest AVs, because some cathepsins are active over a broad pH range up to neutral pH (Turk et al., 1999; Pillay et al., 2002).
Impeding AV clearance either by inhibiting autophagosome–lysosome delivery or by blocking substrate proteolysis induced a relatively rapid accumulation of AVs with morphologies very similar to those seen in the AD brain and in the PS/APP mouse model of AD. These included large proportions of single- and double-membrane-limited vesicles with dense amorphous or granular content, contrasting sharply with the autolysosomes seen after strong autophagy induction in neurons with unimpaired AV clearance. These observations strongly support the hypothesis that profuse AV accumulation in AD neurons is reflective of impaired AV clearance from affected neurites in addition to any effects on autophagy induction. Defective axonal transport of vesicular cargoes back to the cell body has been proposed as one possible mechanism for organelle accumulation within axons in various metabolic and traumatic axonal injury states (Hollenbeck, 1993; Wang et al., 2006). Axonal swellings developing early in AD brain and in mouse models of AD (Stokin et al., 2005) have been attributed to axonal transport failure. In these settings, a variety of organelle types are usually present in the swellings. In contrast, AVs accumulate relatively selectively when proteolysis in autolysosomes is inhibited in vivo after leupeptin administration or in mice in which the genes for cathepsins D or cathepsins B and L are deleted (Bi et al., 1999; Shacka et al., 2007). These observations, although not inconsistent with a general defect in axonal transport, raise the additional possibility that a change in the properties of AVs may influence their axonal transport specifically, without necessarily altering general transport mechanisms. The transport kinetics of individual types of endocytic and autophagic vesicles in axons differ (Hollenbeck, 1993; Deinhardt et al., 2006), and an impairment in the maturation of AV subtypes could alter transport properties and favor AV accumulation. Interestingly, a number of recent studies on various lysosomal storage disorders have also found evidence of impaired AV clearance (Kiselyov et al., 2007; Settembre et al., 2008).
Our evidence showing that autophagy induction in the face of impaired AV clearance exacerbates AV pathology has possible implications for autophagy modulation as a therapeutic strategy in neurodegenerative diseases. Recent evidence suggests that autophagy enhancement is a promising therapeutic strategy against the toxicity of misfolded proteins in age-related neurodegenerative diseases (Rubinsztein et al., 2007). In diseases in which the autophagic pathway may be normal or sluggish but not defective, as seems to be the case in Huntington disease models (Rubinsztein et al., 2005), pharmacologically enhancing the sequestration of misfolded proteins would be expected to promote more rapid digestion and clearance of toxic protein with therapeutic benefits, as has been observed (Ravikumar et al., 2004; Sarkar et al., 2007). In AD in which autophagosome clearance may be impaired, strongly inducing autophagosome formation in AD may exacerbate an already massive neuronal buildup of “intermediate” autophagic compartments, some of which are able to generate Aβ (β-amyloid) (Yu et al., 2005) and possibly other toxic metabolites. Both positive and negative effects of autophagy have been proposed in neuronal function (Chu, 2006; Martinez-Vicente and Cuervo, 2007), and the future delineation of specific (primary) and nonspecific (secondary) autophagic dysfunction in different neurodegenerative diseases will provide a better insight into the differences in their underlying pathology. From results obtained in this study, we propose that therapeutic modulation of autophagy in AD may need to improve the efficiency of autophagosome maturation or eventual substrate digestion by lysosomes.
Footnotes
This work was supported by grants from the National Institute on Aging (AG 017617), the Alzheimer's Association, and the Wellcome Trust (B.B.). We gratefully acknowledge the assistance of Corrinne Peterhoff, Nicole Piorkowski, and Heather Braunstein at Nathan Kline Institute (NKI) in preparing this manuscript, along with Dr. Ana Maria Cuervo at Albert Einstein College of Medicine (Bronx, NY) for her feedback on this manuscript. We also thank Dr. Panaiyur S. Mohan at NKI for supplying the LC3 antibody, Dr. John S. Young from the Department of Pharmacology at the University of Oxford for his assistance with confocal microscopy imaging, and Dr. Alice Liang from New York University School of Medicine (New York, NY) for her assistance with immunoelectron microscopy.
References
- Anglade P, Vyas S, Javoy-Agid F, Herrero MT, Michel PP, Marquez J, Mouatt-Prigent A, Ruberg M, Hirsch EC, Agid Y. Apoptosis and autophagy in nigral neurons of patients with Parkinson's disease. Histol Histopathol. 1997;12:25–31. [PubMed] [Google Scholar]
- Barber AJ, Nakamura M, Wolpert EB, Reiter CE, Seigel GM, Antonetti DA, Gardner TW. Insulin rescues retinal neurons from apoptosis by a phosphatidylinositol 3-kinase/Akt-mediated mechanism that reduces the activation of caspase-3. J Biol Chem. 2001;276:32814–32821. doi: 10.1074/jbc.M104738200. [DOI] [PubMed] [Google Scholar]
- Berg TO, Fengsrud M, Strømhaug PE, Berg T, Seglen PO. Isolation and characterization of rat liver amphisomes. Evidence for fusion of autophagosomes with both early and late endosomes. J Biol Chem. 1998;273:21883–21892. doi: 10.1074/jbc.273.34.21883. [DOI] [PubMed] [Google Scholar]
- Bi X, Zhou J, Lynch G. Lysosomal protease inhibitors induce meganeurites and tangle-like structures in entorhinohippocampal regions vulnerable to Alzheimer's disease. Exp Neurol. 1999;158:312–327. doi: 10.1006/exnr.1999.7087. [DOI] [PubMed] [Google Scholar]
- Blommaart EF, Luiken JJ, Blommaart PJ, van Woerkom GM, Meijer AJ. Phosphorylation of ribosomal protein S6 is inhibitory for autophagy in isolated rat hepatocytes. J Biol Chem. 1995;270:2320–2326. doi: 10.1074/jbc.270.5.2320. [DOI] [PubMed] [Google Scholar]
- Boellaard JW, Schlote W, Tateishi J. Neuronal autophagy in experimental Creutzfeldt-Jakob's disease. Acta Neuropathol (Berl) 1989;78:410–418. doi: 10.1007/BF00688178. [DOI] [PubMed] [Google Scholar]
- Boland B, Nixon RA. Neuronal macroautophagy: from development to degeneration. Mol Aspects Med. 2006;27:503–519. doi: 10.1016/j.mam.2006.08.009. [DOI] [PubMed] [Google Scholar]
- Chu CT. Autophagic stress in neuronal injury and disease. J Neuropathol Exp Neurol. 2006;65:423–432. doi: 10.1097/01.jnen.0000229233.75253.be. [DOI] [PMC free article] [PubMed] [Google Scholar]
- Cuervo AM, Stefanis L, Fredenburg R, Lansbury PT, Sulzer D. Impaired degradation of mutant alpha-synuclein by chaperone-mediated autophagy. Science. 2004;305:1292–1295. doi: 10.1126/science.1101738. [DOI] [PubMed] [Google Scholar]
- De Duve C, Wattiaux R. Functions of lysosomes. Annu Rev Physiol. 1966;28:435–492. doi: 10.1146/annurev.ph.28.030166.002251. [DOI] [PubMed] [Google Scholar]
- Deinhardt K, Salinas S, Verastegui C, Watson R, Worth D, Hanrahan S, Bucci C, Schiavo G. Rab5 and Rab7 control endocytic sorting along the axonal retrograde transport pathway. Neuron. 2006;52:293–305. doi: 10.1016/j.neuron.2006.08.018. [DOI] [PubMed] [Google Scholar]
- Duff K, Eckman C, Zehr C, Yu X, Prada CM, Perez-tur J, Hutton M, Buee L, Harigaya Y, Yager D, Morgan D, Gordon MN, Holcomb L, Refolo L, Zenk B, Hardy J, Younkin S. Increased amyloid-beta42(43) in brains of mice expressing mutant presenilin 1. Nature. 1996;383:710–713. doi: 10.1038/383710a0. [DOI] [PubMed] [Google Scholar]
- Eskelinen EL. Maturation of autophagic vacuoles in mammalian cells. Autophagy. 2005;1:1–10. doi: 10.4161/auto.1.1.1270. [DOI] [PubMed] [Google Scholar]
- Finn PF, Dice JF. Proteolytic and lipolytic responses to starvation. Nutrition. 2006;22:830–844. doi: 10.1016/j.nut.2006.04.008. [DOI] [PubMed] [Google Scholar]
- Gordon PB, Seglen PO. Prelysosomal convergence of autophagic and endocytic pathways. Biochem Biophys Res Commun. 1988;151:40–47. doi: 10.1016/0006-291x(88)90556-6. [DOI] [PubMed] [Google Scholar]
- Hara T, Nakamura K, Matsui M, Yamamoto A, Nakahara Y, Suzuki-Migishima R, Yokoyama M, Mishima K, Saito I, Okano H, Mizushima N. Suppression of basal autophagy in neural cells causes neurodegenerative disease in mice. Nature. 2006;441:885–889. doi: 10.1038/nature04724. [DOI] [PubMed] [Google Scholar]
- Hollenbeck PJ. Products of endocytosis and autophagy are retrieved from axons by regulated retrograde organelle transport. J Cell Biol. 1993;121:305–315. doi: 10.1083/jcb.121.2.305. [DOI] [PMC free article] [PubMed] [Google Scholar]
- Kegel KB, Kim M, Sapp E, McIntyre C, Castaño JG, Aronin N, DiFiglia M. Huntingtin expression stimulates endosomal-lysosomal activity, endosome tubulation, and autophagy. J Neurosci. 2000;20:7268–7278. doi: 10.1523/JNEUROSCI.20-19-07268.2000. [DOI] [PMC free article] [PubMed] [Google Scholar]
- Kiselyov K, Jennigs JJ, Jr, Rbaibi Y, Chu CT. Autophagy, mitochondria and cell death in lysosomal storage diseases. Autophagy. 2007;3:259–262. doi: 10.4161/auto.3906. [DOI] [PMC free article] [PubMed] [Google Scholar]
- Klionsky DJ, Abeliovich H, Agostinis P, Agrawal DK, Aliev G, Askew DS, Baba M, Baehrecke EH, Bahr BA, Ballabio A, Bamber BA, Bassham DC, Bergamini E, Bi X, Biard-Piechaczyk M, Blum JS, Bredesen DE, Brodsky JL, Brumell JH, Brunk UT, et al. Guidelines for the use and interpretation of assays for monitoring autophagy in higher eukaryotes. Autophagy. 2008;4:151–175. doi: 10.4161/auto.5338. [DOI] [PMC free article] [PubMed] [Google Scholar]
- Ko DC, Milenkovic L, Beier SM, Manuel H, Buchanan J, Scott MP. Cell-autonomous death of cerebellar purkinje neurons with autophagy in Niemann-Pick type C disease. PLoS Genet. 2005;1:81–95. doi: 10.1371/journal.pgen.0010007. [DOI] [PMC free article] [PubMed] [Google Scholar]
- Köchl R, Hu XW, Chan EY, Tooze SA. Microtubules facilitate autophagosome formation and fusion of autophagosomes with endosomes. Traffic. 2006;7:129–145. doi: 10.1111/j.1600-0854.2005.00368.x. [DOI] [PubMed] [Google Scholar]
- Komatsu M, Waguri S, Chiba T, Murata S, Iwata J, Tanida I, Ueno T, Koike M, Uchiyama Y, Kominami E, Tanaka K. Loss of autophagy in the central nervous system causes neurodegeneration in mice. Nature. 2006;441:880–884. doi: 10.1038/nature04723. [DOI] [PubMed] [Google Scholar]
- Kovács AL, Reith A, Seglen PO. Accumulation of autophagosomes after inhibition of hepatocytic protein degradation by vinblastine, leupeptin or a lysosomotropic amine. Exp Cell Res. 1982;137:191–201. doi: 10.1016/0014-4827(82)90020-9. [DOI] [PubMed] [Google Scholar]
- Lawrence BP, Brown WJ. Autophagic vacuoles rapidly fuse with pre-existing lysosomes in cultured hepatocytes. J Cell Sci. 1992;102:515–526. doi: 10.1242/jcs.102.3.515. [DOI] [PubMed] [Google Scholar]
- Levine B, Klionsky DJ. Development by self-digestion: molecular mechanisms and biological functions of autophagy. Dev Cell. 2004;6:463–477. doi: 10.1016/s1534-5807(04)00099-1. [DOI] [PubMed] [Google Scholar]
- Martinez-Vicente M, Cuervo AM. Autophagy and neurodegeneration: when the cleaning crew goes on strike. Lancet Neurol. 2007;6:352–361. doi: 10.1016/S1474-4422(07)70076-5. [DOI] [PubMed] [Google Scholar]
- Marzella L, Sandberg PO, Glaumann H. Autophagic degradation in rat liver after vinblastine treatment. Exp Cell Res. 1980;128:291–301. doi: 10.1016/0014-4827(80)90065-8. [DOI] [PubMed] [Google Scholar]
- Mizushima N. Methods for monitoring autophagy. Int J Biochem Cell Biol. 2004;36:2491–2502. doi: 10.1016/j.biocel.2004.02.005. [DOI] [PubMed] [Google Scholar]
- Mizushima N, Yamamoto A, Matsui M, Yoshimori T, Ohsumi Y. In vivo analysis of autophagy in response to nutrient starvation using transgenic mice expressing a fluorescent autophagosome marker. Mol Biol Cell. 2004;15:1101–1111. doi: 10.1091/mbc.E03-09-0704. [DOI] [PMC free article] [PubMed] [Google Scholar]
- Nixon RA. Autophagy in neurodegenerative disease: friend, foe or turncoat? Trends Neurosci. 2006;29:528–535. doi: 10.1016/j.tins.2006.07.003. [DOI] [PubMed] [Google Scholar]
- Nixon RA, Wegiel J, Kumar A, Yu WH, Peterhoff C, Cataldo A, Cuervo AM. Extensive involvement of autophagy in Alzheimer disease: an immuno-electron microscopy study. J Neuropathol Exp Neurol. 2005;64:113–122. doi: 10.1093/jnen/64.2.113. [DOI] [PubMed] [Google Scholar]
- Overly CC, Lee KD, Berthiaume E, Hollenbeck PJ. Quantitative measurement of intraorganelle pH in the endosomal-lysosomal pathway in neurons by using ratiometric imaging with pyranine. Proc Natl Acad Sci USA. 1995;92:3156–3160. doi: 10.1073/pnas.92.8.3156. [DOI] [PMC free article] [PubMed] [Google Scholar]
- Pillay CS, Elliott E, Dennison C. Endolysosomal proteolysis and its regulation. Biochem J. 2002;363:417–429. doi: 10.1042/0264-6021:3630417. [DOI] [PMC free article] [PubMed] [Google Scholar]
- Punnonen EL, Reunanen H. Effects of vinblastine, leucine, and histidine, and 3-methyladenine on autophagy in Ehrlich ascites cells. Exp Mol Pathol. 1990;52:87–97. doi: 10.1016/0014-4800(90)90061-h. [DOI] [PubMed] [Google Scholar]
- Ravikumar B, Vacher C, Berger Z, Davies JE, Luo S, Oroz LG, Scaravilli F, Easton DF, Duden R, O'Kane CJ, Rubinsztein DC. Inhibition of mTOR induces autophagy and reduces toxicity of polyglutamine expansions in fly and mouse models of Huntington disease. Nat Genet. 2004;36:585–595. doi: 10.1038/ng1362. [DOI] [PubMed] [Google Scholar]
- Rideout HJ, Lang-Rollin I, Stefanis L. Involvement of macroautophagy in the dissolution of neuronal inclusions. Int J Biochem Cell Biol. 2004;36:2551–2562. doi: 10.1016/j.biocel.2004.05.008. [DOI] [PubMed] [Google Scholar]
- Rubinsztein DC, DiFiglia M, Heintz N, Nixon RA, Qin ZH, Ravikumar B, Stefanis L, Tolkovsky A. Autophagy and its possible roles in nervous system diseases, damage and repair. Autophagy. 2005;1:11–22. doi: 10.4161/auto.1.1.1513. [DOI] [PubMed] [Google Scholar]
- Rubinsztein DC, Gestwicki JE, Murphy LO, Klionsky DJ. Potential therapeutic applications of autophagy. Nat Rev Drug Discov. 2007;6:304–312. doi: 10.1038/nrd2272. [DOI] [PubMed] [Google Scholar]
- Sabers CJ, Martin MM, Brunn GJ, Williams JM, Dumont FJ, Wiederrecht G, Abraham RT. Isolation of a protein target of the FKBP12-rapamycin complex in mammalian cells. J Biol Chem. 1995;270:815–822. doi: 10.1074/jbc.270.2.815. [DOI] [PubMed] [Google Scholar]
- Sarkar S, Perlstein EO, Imarisio S, Pineau S, Cordenier A, Maglathlin RL, Webster JA, Lewis TA, O'Kane CJ, Schreiber SL, Rubinsztein DC. Small molecules enhance autophagy and reduce toxicity in Huntington's disease models. Nat Chem Biol. 2007;3:331–338. doi: 10.1038/nchembio883. [DOI] [PMC free article] [PubMed] [Google Scholar]
- Settembre C, Fraldi A, Jahreiss L, Spampanato C, Venturi C, Medina D, de Pablo R, Tacchetti C, Rubinsztein DC, Ballabio A. A block of autophagy in lysosomal storage disorders. Hum Mol Genet. 2008;17:119–129. doi: 10.1093/hmg/ddm289. [DOI] [PubMed] [Google Scholar]
- Shacka JJ, Klocke BJ, Young C, Shibata M, Olney JW, Uchiyama Y, Saftig P, Roth KA. Cathepsin D deficiency induces persistent neurodegeneration in the absence of Bax-dependent apoptosis. J Neurosci. 2007;27:2081–2090. doi: 10.1523/JNEUROSCI.5577-06.2007. [DOI] [PMC free article] [PubMed] [Google Scholar]
- Stokin GB, Lillo C, Falzone TL, Brusch RG, Rockenstein E, Mount SL, Raman R, Davies P, Masliah E, Williams DS, Goldstein LS. Axonopathy and transport deficits early in the pathogenesis of Alzheimer's disease. Science. 2005;307:1282–1288. doi: 10.1126/science.1105681. [DOI] [PubMed] [Google Scholar]
- Sun-Wada GH, Wada Y, Futai M. Lysosome and lysosome-related organelles responsible for specialized functions in higher organisms, with special emphasis on vacuolar-type proton ATPase. Cell Struct Funct. 2003;28:455–463. doi: 10.1247/csf.28.455. [DOI] [PubMed] [Google Scholar]
- Takeshige K, Baba M, Tsuboi S, Noda T, Ohsumi Y. Autophagy in yeast demonstrated with proteinase-deficient mutants and conditions for its induction. J Cell Biol. 1992;119:301–311. doi: 10.1083/jcb.119.2.301. [DOI] [PMC free article] [PubMed] [Google Scholar]
- Tanida I, Ueno T, Kominami E. LC3 conjugation system in mammalian autophagy. Int J Biochem Cell Biol. 2004;36:2503–2518. doi: 10.1016/j.biocel.2004.05.009. [DOI] [PMC free article] [PubMed] [Google Scholar]
- Tanida I, Minematsu-Ikeguchi N, Ueno T, Kominami E. Lysosomal turnover, but not a cellular level, of endogenous LC3 is a marker for autophagy. Autophagy. 2005;1:84–91. doi: 10.4161/auto.1.2.1697. [DOI] [PubMed] [Google Scholar]
- Turk B, Dolenc I, Lenarcic B, Krizaj I, Turk V, Bieth JG, Björk I. Acidic pH as a physiological regulator of human cathepsin L activity. Eur J Biochem. 1999;259:926–932. doi: 10.1046/j.1432-1327.1999.00145.x. [DOI] [PubMed] [Google Scholar]
- Vander Haar E, Lee SI, Bandhakavi S, Griffin TJ, Kim DH. Insulin signalling to mTOR mediated by the Akt/PKB substrate PRAS40. Nat Cell Biol. 2007;9:316–323. doi: 10.1038/ncb1547. [DOI] [PubMed] [Google Scholar]
- Wang QJ, Ding Y, Kohtz DS, Kohtz S, Mizushima N, Cristea IM, Rout MP, Chait BT, Zhong Y, Heintz N, Yue Z. Induction of autophagy in axonal dystrophy and degeneration. J Neurosci. 2006;26:8057–8068. doi: 10.1523/JNEUROSCI.2261-06.2006. [DOI] [PMC free article] [PubMed] [Google Scholar]
- Yu WH, Cuervo AM, Kumar A, Peterhoff CM, Schmidt SD, Lee JH, Mohan PS, Mercken M, Farmery MR, Tjernberg LO, Jiang Y, Duff K, Uchiyama Y, Näslund J, Mathews PM, Cataldo AM, Nixon RA. Macroautophagy—a novel beta-amyloid peptide-generating pathway activated in Alzheimer's disease. J Cell Biol. 2005;171:87–98. doi: 10.1083/jcb.200505082. [DOI] [PMC free article] [PubMed] [Google Scholar]
- Zhu JH, Horbinski C, Guo F, Watkins S, Uchiyama Y, Chu CT. Regulation of autophagy by extracellular signal-regulated protein kinases during 1-methyl-4-phenylpyridinium-induced cell death. Am J Pathol. 2007;170:75–86. doi: 10.2353/ajpath.2007.060524. [DOI] [PMC free article] [PubMed] [Google Scholar]