Abstract
Our aims were to measure the gastric volume response in excess of ingested meal volume (i.e., gastric accommodation), contribution of swallowed air to this excess, day-to-day variability of gastric volumes measured by MRI and their relationship to volumes measured by single-photon-emission computed tomography (SPECT). In 20 healthy volunteers, fasting and postprandial gastric volumes were measured after technetium99m-pertechnetate labeling of the gastric mucosa by SPECT and separately by MRI, using 3D gradient echo and 2D half-Fourier acquisition single-shot turbo spin echo (HASTE) sequences. Ten of these subjects had a second MRI exam to assess intra-individual variation. Thereafter, another 10 subjects had 2 MRI studies during which they ingested the nutrient in 30 or 150 mL aliquots. During MRI, the postprandial gastric volume change exceeded the ingested meal volume by 106 ± 12 mL (Mean ± SEM). The HASTE and gradient echo sequences distinguished air from fluid under fasting and postprandial conditions respectively. This postprandial excess mainly comprised air (61 ± 5 mL), which was not significantly different when ingested as 30 mL or 150 mL aliquots. Fasting and postprandial gastric volumes measured by MRI were generally reproducible within subjects. During SPECT, postprandial volumes increased by 158 ± 18 mL; gastric volumes measured by SPECT were higher than MRI. MRI measures gastric volumes with acceptable performance characteristics; the postprandial excess primarily consists of air, which is not affected by the mode of ingestion. Gastric volumes are technique specific and differ between MRI and SPECT.
BACKGROUND
The stomach relaxes or accommodates after a meal, providing room for food to be broken down into smaller particles. This process can be measured by a barostat or by less invasive techniques [i.e., single photon emission computed tomography (SPECT), ultrasound, or MRI]. Impaired accommodation may explain early satiety in functional dyspepsia. (1–3) However, the magnitude of this postprandial change differs among techniques, and is generally higher when recorded by a barostat, perhaps because an intra-gastric balloon distends the stomach and displaces food toward the antrum. (4, 5) Some studies suggest that the postprandial increase in gastric volume exceeds the sum of fasting gastric volume and volume ingested; (6, 7) others did not confirm this finding, arguing against the concept of accommodation or the ability of SPECT to actually measure accommodation. (5, 8) Gastric volumes measured by SPECT and a barostat were significantly correlated when measured simultaneously (9) but not when measured separately. (8) While no head-to-head comparisons of non-invasive techniques (i.e., SPECT, MRI and US) have been reported, a comparison of different studies suggests that the postprandial increase in gastric volume over meal volume is smaller when measured by MRI (e.g., 79 mL after a glucose meal) than by SPECT (e.g., average 200 mL and 5th percentile of 128 mL after a 300 mL (kcal) liquid nutrient meal. (6, 7)
The factors contributing to the postprandial change in gastric volume are incompletely understood. Although this increment is primarily attributed to gastric relaxation, it may be affected by gastric emptying and gastric secretion. (5–7) In addition, the possibility that air is displaced from the hypopharynx to the stomach during swallowing needs to be considered. Healthy subjects swallow an average of 17.7 mL of air with a single bolus of 10 mL. (10) MRI is capable of measuring total gastric volume and distinguishing between gastric air and fluid. When the nutrient is labeled with gadolinium, air can be distinguished from nutrient on postprandial T1-weighted images (5, 7) but not without intraluminal gadolinium under fasting conditions. Therefore, it may be necessary to use more than one imaging sequence to optimally visualize the stomach and to distinguish between gastric air and fluid under fasting and postprandial conditions.
In the only prior study to assess the intra-individual day-to-day reproducibility of gastric volumes measured by MRI, fasting and postprandial gastric volumes were not reproducible in 8 healthy controls and 8 patients with functional dyspepsia. (11) However, the postprandial change in gastric volumes was significantly and highly correlated (r = 0.7, p < 0.05) between the 2 examinations.
Thus, our study was designed to: (i) assess fasting and postprandial volumes by MRI; (ii) ascertain the volume of swallowed air contributing to fasting and postprandial gastric volumes; (iii) determine the inter-individual variation and the intra-individual day-to-day reproducibility of measuring gastric volumes by MRI; and (iv) compare gastric volumes measured by MRI and SPECT in healthy subjects. This study enhances our understanding of the contributions of air and secretions to gastric volumes and assesses performance characteristics of these measurements.
MATERIAL AND METHODS
In vitro validation studies
In vitro validation studies were performed to assess the accuracy of gastric volume measurements by MRI and SPECT. These studies were performed by imaging a latex balloon (Trojan™,, Church and Dwight, Princeton, NJ) filled with variable volumes, ranging from 100 mL to 1000 mL, and placed in a water bath. The balloon was filled with 99mTc for SPECT and gadolinium labeled with Ensure for MRI. Imaging was performed with the imaging protocols used for humans studies with SPECT and MRI as described below.
Experimental Design for Human Studies
In Experiment 1, gastric volumes were measured separately by MRI and SPECT in 20 healthy subjects. Reproducibility was evaluated by repeating measurements of gastric volumes by MRI in 10 subjects. In Experiment 2, 10 healthy subjects underwent two MRI examinations to ascertain if the bolus size affects gastric volumes.
Subjects
All subjects were recruited from the local community by public advertisement. Experiment 1 included 20 healthy volunteers [14 female; median age 34 yr, range 27–48 yr; BMI 25.2 ± 0.9 kg/m2 (Mean ± SEM)] and experiment 2 was conducted in 10 healthy volunteers (9 female; median age 34 yr, range 21–44 yr; BMI 25 ± 1 kg/m2). None had previous gastrointestinal surgery (other than appendectomy), significant underlying illnesses, or medication use, except for stable doses of birth control pill, L-thyroxine, or estrogen replacement therapy. Functional GI disorders, anxiety, and depression were excluded using validated screening questionnaires, a clinical interview, and a physical examination. (12, 13) Females of child-bearing potential underwent a pregnancy test within 48 h of each study. All subjects gave their written informed consent to participate in the protocol, which had been approved previously by the Institutional Review Board and Radiation Safety Committee of the Mayo Clinic.
99mTc-SPECT for Measuring Gastric Volumes (Experiment 1)
Gastric volumes were assessed by single-photon-emission computed tomography (SPECT) as described previously. (14) After intravenous injection of 99mTc-labeled sodium pertechnetate (10 mCi), dynamic tomographic images of the gastric wall were acquired during fasting and for a total of 32 min after ingestion of a 300-ml nutrient drink (Ensure, 1 kcal/ml, Ross Laboratories, Abbott Park, IL) by a dual-head gamma camera (Helix SPECT System, Elscint, Haifa, Israel) in a multiorbit-mode system. Since the 99mTc is taken up by gastric parietal and mucus-secreting epithelial cells, the entire gastric mucosa is visualized by this technique. As previously described, a three-dimensional rendering of the stomach and its volume was obtained by using the AVW 3.0 (Core B; Biomedical Imaging Resource, Mayo Foundation, Rochester, MN) image processing libraries. (6)
Gastric MRI
Method (Experiment 1)
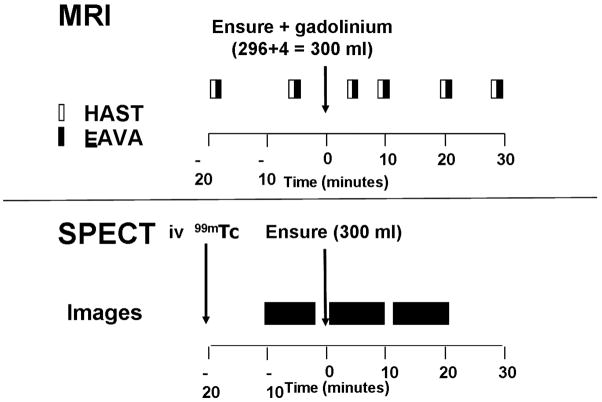
The stomach was imaged under fasting and postprandial conditions [i.e., after ingestion of Ensure (296 ml) labeled with gadolinium (4 mL) [gadodiamide (Omniscan, GE Healthcare, Oslo, Norway)] through a straw in the supine position] using a torso phased array coil and a 1.5T magnet MRI (GE Healthcare, Waukesha, WI) according to the schedule shown in Figure 1. Based on preliminary studies, we used 2 imaging sequences to optimize visualization of the stomach and its contents under fasting and postprandial conditions. The axial 3D axial gradient echo (LAVA) sequence (i.e., 4 mm slices with 2 mm overlap, matrix size 256 × 160, 1 NEX, parallel imaging) imaged the entire stomach in 13 seconds. Subjects were encouraged to hold their breath for this sequence. The coronal 2D half-Fourier acquisition single-shot turbo spin echo (HASTE) sequence (i.e., minimum TR, TE 80 ms, 5 mm slices with 0 mm gap, matrix size 256 × 224, 1 NEX), imaged the entire stomach in 28 seconds, i.e., a two breathholds. Subjects were encouraged to hold their breath for as long as possible during this scan. The ratio for mixing gadolinium with Ensure was derived from preliminary in vitro studies to assess the optimum signal to noise ratio (data not shown).
Figure 1.
Experimental timeline. Fasting and postprandial images were acquired at regular intervals by MRI and SPECT. For the LAVA sequence, fasting volumes were measured at 20 minutes before a meal in all subjects and at 5 minutes before a meal in 14 of 20 subjects.
Day to day reproducibility of gastric volumes was assessed by repeating a gastric MRI in 10 randomly selected healthy subjects on a second day at an average of 18 days (range 12 – 41 days) of the initial study.
Method (Experiment 2)
In Experiment 2, fasting and postprandial volumes were acquired by the same MRI sequences as described above for Experiment 1 on two occasions separated by an average of 11 days (range 3–22 days). During these studies, subjects drank the Ensure while seated from a cup in ten 30 mL or two 150 mL aliquots in randomized order on the two study days.
Data Analysis
MR images were processed by a variety of algorithms using ANALYZE software (Biomedical Imaging Resource, Mayo Clinic, Rochester, MN). The outer and inner stomach contours were identified and manually outlined on each volume scan by technologists. Image segmentation was reviewed by a radiologist (JF) for accuracy.
The total stomach volume was calculated by 2 methods. In all subjects, total stomach volume was derived by summing the volume within the stomach wall and separately its contents; this measurement was used for all analyses. In a subset of 14 subjects, total stomach volume was also calculated by calculating the entire volume encompassed within a region of interest demarcated by the outer gastric wall.
In addition to assessing total volume, we also estimated the volume of gastric air and fluids. Intragastric fluid and air were easily distinguishable on the HASTE sequence during fasting and the LAVA sequence during postprandial periods. In a subset of patients, the gastric volume was also measured
Statistical Analysis
The concordance between gastric volumes measured by different MRI sequences, (i.e., HASTE and axial LAVA) on the same day, by MRI on 2 separate days, and between MRI and SPECT was assessed by Lin’s concordance statistic (the concordance correlation coefficient [CCC]. (15) The paired t-test was used to compare within subject differences against zero. A Bland Altman assessment examined whether the magnitude of differences between 2 measurements was correlated with the magnitude of the measured responses (i.e., the average value for both studies) using Pearson’s correlation coefficient. (16) Because fasting volumes were different for MRI and SPECT, we used the symmetric change [i.e., 100*log(Postprandial/Fasting volume)] for comparing the postprandial volume change between SPECT and MRI.
RESULTS
In Vitro Studies
There was an excellent correlation between actual and measured volumes by SPECT [CCC (95% CI) = 0.99 (0.99, 1.0)] and MRI [0.99 (0.99, 1.0)].
Image Characteristics
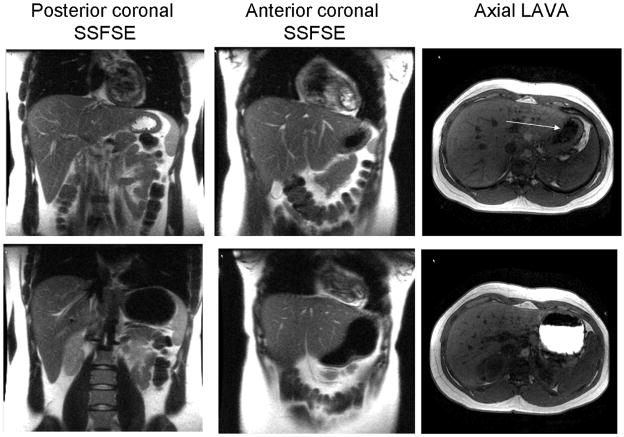
Under fasting conditions, intragastric fluid and air were easily distinguishable from the stomach wall on the T2-weighted (HASTE) sequence, but not on the 3D (LAVA) sequence. After a meal, the nutrient labeled with gadolinium was clearly distinguishable from air on the LAVA sequences. (Figure 2) In contrast, both air and fluid had a low signal intensity separated by a gray interface, on the postprandial HASTE sequence. Therefore, while both sequences measure total gastric volumes, intragastric air and fluid were most easily distinguishable on the HASTE images before and the LAVA images after a meal.
Figure 2.
Fasting (upper panel) and postprandial (lower panel) images acquired by MRI. In the fasting HASTE images, the distinction between high signal intensity fluid, which is layered posteriorly (i.e., in the dependent position) and low signal intensity air, which is anterior, is obvious. In the LAVA images, the air-fluid interface is subtle (arrow). Postprandially, air and fluid have low signal intensity in HASTE images but easily distinguishable on LAVA sequence (i.e., nutrient labeled with gadolinium appears bright while air is dark)
Fasting and Postprandial Gastric Volumes Measured by MRI
With the HASTE sequence, fasting volumes at 20 minutes (i.e., 168 ± 10 mL) and 5 minutes before a meal (i.e., 169 ± 12 mL) were correlated [CCC (95% CI) = 0.92 (0.84, 0.99)]. Similarly, with the LAVA sequence, fasting volumes at 20 (169 ± 9 mL) and 5 minutes (172 ± 11 mL) were correlated (0.86; 95% CI, 0.73, 0.99) for the 14 subjects in whom images were acquired at both time points. This volume was primarily comprised of the gastric wall (i.e., as defined by the volume between the outer and inner stomach contours), which occupied 118 ± 5 ml, i.e., nearly 70% of the total fasting volume. The volume of air in the fasting stomach was 21 ± 3 mL at 20 minutes before and 25 ± 5 mL at 5 minutes before a meal.
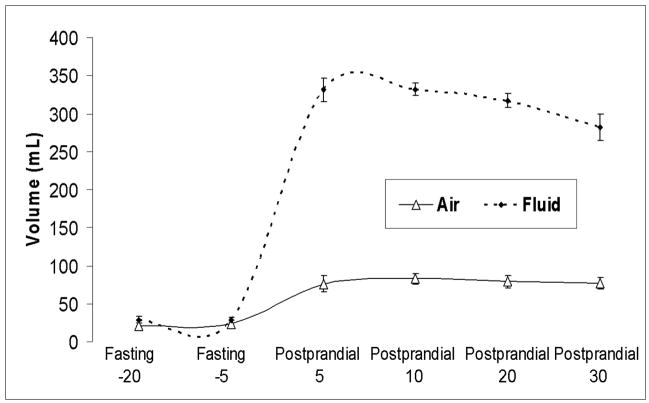
The average postprandial gastric volume change after a 300 mL meal was 351 ± 9 mL for the HASTE sequence and 406 ± 12 mL for the LAVA sequence. (Table 1) After accounting for nutrient volume (300 mL), the postprandial excess was on average 51 mL for HASTE and 106 mL for the LAVA sequence. To ensure accuracy, the postprandial change in air was calculated by subtracting air on fasting HASTE from postprandial LAVA sequences; the postprandial change in air was approximately 60 mL. (Figure 3)
Table 1.
Comparison of Gastric Volumes Measured by Pulse Sequence
| Measurements* | HASTE | LAVA | CCC (95% CI) | P value for Bland Altman Assessment # |
|---|---|---|---|---|
| Fasting | 167 ± 10 | 156 ± 9 | 0.83 (0.70, 0.97) | 0.28 |
| Postprandial 5 | 525 ± 19 | 558 ± 19 | 0.82 (0.67, 0.97) | 0.70 |
| Postprandial 10 | 500 ± 16 | 538 ± 16 | 0.74 (0.56 – 0.93) | 0.85 |
| Postprandial 20 | 479 ± 13 | 507 ± 16 | 0.77 (0.61 – 0.94) | 0.11 |
| Postprandial 30 | 462 ± 11 | 481 ± 14 | 0.66 (0.41 – 0.90) | 0.16 |
| Postprandial change 5 | 352 ± 10 | 402 ± 12 | 0.45 (0.21, 0.69) | 0.19 |
| Postprandial change 10 | 327 ± 7 | 383 ± 10 | 0.32 (0.13, 0.51) | 0.05 |
| Postprandial change 20 | 307 ± 8 | 349 ± 12 | 0.53 (0.31, 0.74) | 0.03 |
| Postprandial change 30 | 290 ± 8 | 324 ± 11 | 0.36 (0.06, 0.66) | 0.23 |
Numbers reflect imaging time, in minutes, relative to meal ingestion. Postprandial change is the difference between postprandial and fasting volume.
Test for (Pearson) correlation of differences versus overall mean
Figure 3.
Temporal profile in intragastric air and fluid volumes assessed by MRI. Data are derived from HASTE sequence in fasting conditions and LAVA sequence after a meal. Observe that air volume increased by an average of 61 mL while gastric fluid increased by 318 mL (i.e., 18 mL more than ingested nutrient) immediately after a meal.
Reproducibility of Gastric Volumes Measured by MRI
Fasting and postprandial volumes measured by both MRI pulse sequences at corresponding timepoints were generally correlated but higher for the LAVA than the HASTE images. (Table 1) With the exception of the postprandial volume change at 20 minutes, differences in volumes measured by both techniques were not generally related to average volumes (i.e., the test for correlation between differences and overall mean values was negative).
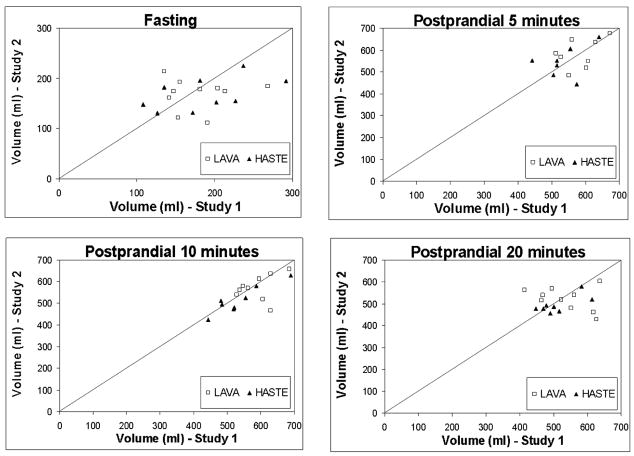
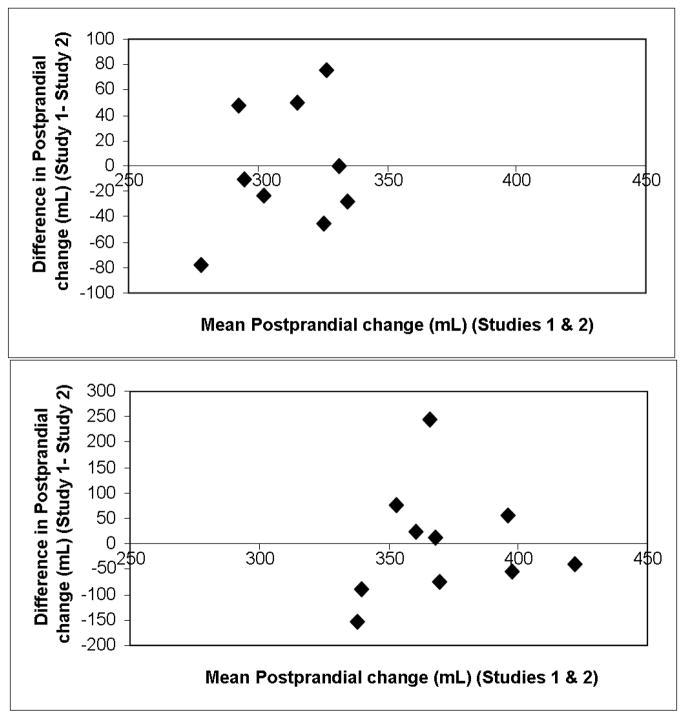
Intra-individual reproducibility for MRI analyzed by correlation coefficients (Table 2) and coefficients of variation (Table 3) was better for postprandial than fasting volumes and also better for the HASTE than the axial LAVA sequence. (Figure 4) Thus, for the HASTE sequence, postprandial volumes and the postprandial volume changes were significantly correlated between days and the coefficient of variation was 15–20%. For most parameters, intra-individual was higher then inter-individual variability. Moreover, differences in postprandial gastric volume changes between first and second studies were not related to the average postprandial gastric volume changes for the first and second studies. (Figure 5)
Table 2.
Day to Day Reproducibility of Gastric Volumes Measured by MRI
| Measurements relative to meal | HASTE | LAVA | ||||
|---|---|---|---|---|---|---|
| Day 1 | Day 2 | CCC (95% CI) | Day 1 | Day 2 | CCC (95% CI) | |
| Fasting | 190 ± 21 | 179 ± 14 | 0.43 (−0.06, 0.92) | 179 ± 13 | 169 ± 10 | 0.66 (0.26, 1.0) |
| Postprandial 5 | 565 ± 36 | 563 ± 29 | 0.62 (0.15, 1.0) | 603 ± 27 | 597 ± 25 | 0.65 (0.23, 1.0) |
| Postprandial 10 | 535 ± 28 | 515 ± 23 | 0.87 (0.70, 1.0) | 591 ± 17 | 572 ± 20 | 0.31 (−0.23, 0.93) |
| Postprandial 20 | 508 ± 18 | 491 ± 13 | 0.64 (0.27, 1.0) | 556 ± 19 | 522 ± 17 | −0.11 (−0.68, 0.45) |
| Postprandial 30 | 481 ± 18 | 462 ± 19 | 0.27 (−0.37, 0.91) | 523 ± 20 | 512 ± 16 | −0.001 (−0.67, 0.67) |
| Postprandial change 5 | 365 ± 14 | 384 ± 13 | 0.63 (0.19, 1.0) | 425 ± 19 | 421 ± 22 | 0.35 (−0.29, 0.99) |
| Postprandial change 10 | 336 ± 11 | 336 ± 13 | 0.05 (−0.74, 0.84) | 414 ± 14 | 396 ± 21 | −0.40 (−0.95, 0.14) |
| Postprandial change 20 | 312 ± 11 | 316 ± 9 | 0.14 (−0.57, 0.85) | 377 ± 20 | 352 ± 22 | −0.18 (−0.80, 0.44) |
| Postprandial change 30 | 286 ± 14 | 286 ± 14 | 0.13 (−0.60, 0.86) | 344 ± 22 | 343 ± 20 | −0.70 (−1.0, −0.34) |
Data are based on 10 subjects who had 2 MRI examinations. For all parameters, differences between first and second studies were not statistically significant and the Bland Altman assessment was negative.
Table 3.
Variability of Gastric Volumes Measured by MRI
| Measurements | CV (%) for HASTE | CV (%) for LAVA | ||
|---|---|---|---|---|
| Inter-individual | Intra-individual | Inter-individual | Intra-individual | |
| Fasting | 32 | 32 | 25 | 30 |
| Postprandial 5 | 15 | 15 | 13 | 11 |
| Postprandial 10 | 13 | 6 | 12 | 11 |
| Postprandial 20 | 12 | 8 | 14 | 16 |
| Postprandial change 5 | 11 | 9 | 13 | 17 |
| Postprandial change 10 | 8 | 16 | 12 | 24 |
| Postprandial change 20 | 11 | 14 | 16 | 28 |
| Postprandial change 30 | 13 | 21 | 18 | 35 |
| Average postprandial change | 10 | 17 | 15 | 21 |
Figure 4.
Day-to-day reproducibility of total gastric volumes under fasting and postprandial conditions. In general, agreement was superior for HASTE than LAVA sequences and for postprandial rather than fasting volumes.
Figure 5.
Bland-Altman plots for comparison of postprandial gastric volume changes in first and second studies measured by the HASTE sequence (upper panel) and LAVA sequence (lower panel). Plots depict the relationship between the average postprandial gastric volume change (x axis) for first and second studies and the differences (Study 1 – Study 2) of postprandial gastric volume changes (y axis). These figures indicate that the differences between first and second studies were not associated with the mean postprandial gastric volume change for the first and second studies.
Comparison of Gastric Volumes Measured by MRI and SPECT
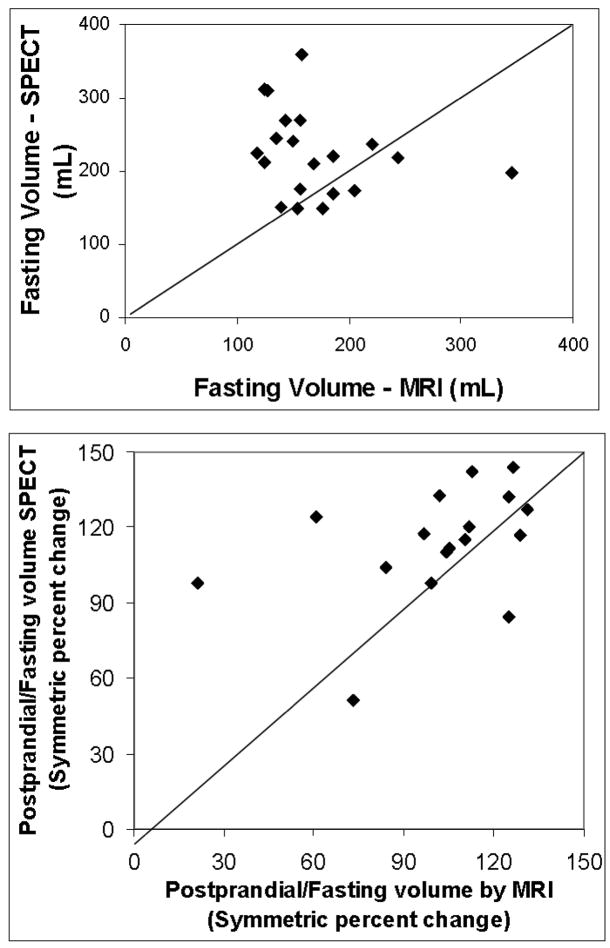
Fasting and postprandial gastric volumes measured by MRI and SPECT were comparable but not significantly correlated. (Table 4, Figure 6) Postprandial volume changes measured by SPECT were systematically higher than MRI. (Table 4) However, the Bland Altman test demonstrates that differences between MRI and SPECT were not significantly affected by gastric volume.
Table 4.
Comparison of Gastric Volumes Measured by MRI and SPECT
| Measurements | MRI (LAVA sequence) | SPECT | CCC (95% CI) | Bland Altman Assessment # |
|---|---|---|---|---|
| Fasting | 156 ± 9 | 225 ± 13 | −0.01 (−0.31, 0.30) | 0.11 |
| Postprandial 10 | 542 ± 15 | 697 ± 18 | −0.04 (−0.14, 0.05) | 0.33 |
| Postprandial 20 | 513 ± 16 | 667 ± 20 | 0.02 (−0.08, 0.12) | 0.35 |
| Postprandial volume change 100*log(Postprandial/Fasting volume | 105 ± 4 | 114 ± 5 | −0.07 (−0.49, 0.35) | 0.35 |
Test for (Pearson) correlation of differences versus overall mean.
Figure 6.
Comparison of fasting volumes (upper panel) and the postprandial change in gastric volumes (lower panel) measured by MRI versus SPECT. Lines are the Y=X line of identity.
Effect of Variation in Aliquot Size on Intragastric Air
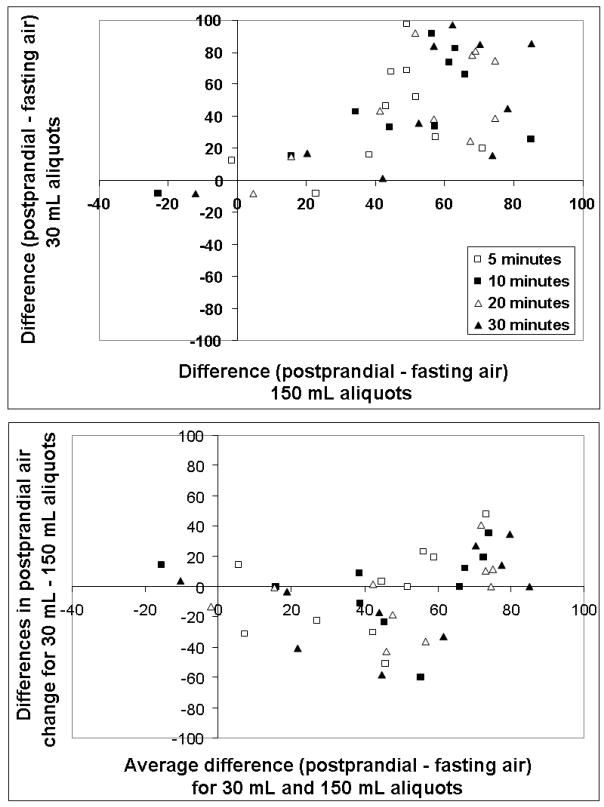
In Experiment 1, intragastric air volumes were very similar at 20 and 5 minutes before a meal with the exception of 1 subject (data not shown). Air volume increased by 63 ± 7 mL immediately after a meal and declined to 49 ± 9 mL at 30 minutes post meal. Thus, in most subjects intragastric air volume was relatively stable for up to 30 minutes after a meal. (Figure 3) In Experiment 2, the postprandial change in intragastric air was not significantly different when the nutrient was ingested in ten aliquots of 30 mL (i.e., 43 ± 9 mL) than in 2 aliquots of 150 mL (i.e., 44 ± 4 mL). (Figure 7) The study order (i.e., 10 small aliquots versus 2 large aliquots first) did not affect the postprandial volume or air change either (data not shown). Moreover, differences in postprandial air volumes for 30 mL and 150 mL aliquots measured by both techniques were not related to the average change in air volume (i.e., the test for correlation between differences and overall mean values was negative).
Figure 7.
Comparison of the differences between gastric air during postprandial and fasting images at 5, 10, 20, and 30 minutes after nutrient ingestion in 30 mL or 150 mL aliquots (upper panel) and the relationship between the mean of these differences to the difference of differences [i.e., Postprandial difference (30 mL aliquots) – postprandial difference (150 mL aliquots), lower panel]. Air volumes were not higher when nutrient was ingested in smaller aliquots suggesting that gastric air is not primarily swallowed air.
DISCUSSION
Allowing for differences in meal size, the postprandial increase in gastric volume in this study is comparable to a previous report from the Zurich group (average = 79 mL), confirming that postprandial gastric expansion measured by MRI exceeds the volume of the ingested nutrient (7). Similar to previous studies, we could distinguish intra-gastric nutrient labeled with gadolinium from air on postprandial images. (5, 7) However, we found that under fasting conditions, it was challenging to demarcate the boundary between the inner stomach wall and gastric contents or to distinguish between gastric fluid and air with these sequences. Therefore, we used 2-D T2-weighted (HASTE) and 3D LAVA sequences to discriminate between intragastric air and fluid under fasting and postprandial conditions, respectively. In this study, gastric air increased by an average of 60 mL after a meal; this increase comprised a major proportion of the postprandial excess in total gastric volume. Because an average of 17.7 mL of air is displaced from the hypopharynx and swallowed with each sip with a single bolus of 10 mL, (10) we sought to ascertain whether the postprandial increase in gastric air was derived from swallowing. The postprandial increase in gastric air was not significantly different when volunteers were asked to drink the same nutrient liquid volume in 2 or 10 sips, suggesting that the mode of drinking, does not significantly affect the postprandial increase in gastric air measured by MRI. Because we did not count the number of swallows, we don’t know if subjects required more than 1 swallow to drink each 150 mL aliquot. While these observations suggest that the mode of nutrient ingestion did not affect postprandial gastric volume changes, further studies are required to understand the contributions of gastric relaxation and swallowed air to postprandial gastric volumes. Conceivably, the recumbent position might limit belching of air trapped in the fundus above the gastroesophageal junction in the recumbent position. However, a comparison of gastric MRI in the seated and recumbent positions revealed significant differences in intragastric air only during the late (i.e., 30 – 90 minutes) and not during the early postprandial period (0 – 30 minutes). (17) In comparison to air, the postprandial gastric fluid volume is a more dynamic process. This process is primarily influenced by secretion and emptying which has also been measured by MRI. (7, 18)
On a given day, fasting and postprandial volumes and the postprandial volume change measured by both MRI sequences were in agreement at corresponding timepoints. Either sequence should suffice for measuring fasting and postprandial total gastric volumes. We cannot explain why volumes were more reproducible between days for the HASTE than the LAVA sequence because the HASTE sequence acquires images over 28 seconds and is therefore more prone to motion (i.e., breathing) artefact than the 3D sequence.
Intra-individual, day-to-day reproducibility for gastric volumes measured by MRI was better for fasting than postprandial volumes and better for HASTE than LAVA sequences. Thus, for postprandial volumes and volume changes measured by the HASTE sequence, the within subject CV (%) was 15% or lower, which is comparable to the intra-subject CV of gastric emptying half-time measured by scintigraphy. (19) For the postprandial volume change between 10 and 30 minutes, the confidence intervals for concordance correlation coefficients crossed 0 suggesting poor reproducibility between days. However, the coefficients of variation for postprandial volumes and the postprandial volume change at 10 and 20 minutes were generally < 30%. While agreement measured by concordance correlation coefficients is affected by the direction of the change (i.e., positive or negative) between first and subsequent assessments, coefficients of variation are not. Indeed, mean volumes during first and second studies were nearly identical. Thus inferences based on mean volumes (e.g. between treatment groups in a randomized controlled trial) should not be affected by the lack of agreement between individual subject measurements from day to day. The low concordance correlation coefficients for certain volume estimates probably reflect day to day differences in true volumes within subjects rather than systematic differences due to measurement technique. Future studies with more subjects are required to ascertain whether standardizing the rate of nutrient ingestion can improve day-to-day reproducibility in gastric volumes.
Studies in patients are necessary to ascertain the additional utility of quantifying intragastric air and fluid in addition to total gastric volume. Conceivably, separate measurements of air and fluid may be useful in patients with delayed gastric emptying, since delayed emptying may increase postprandial gastric volumes and thereby exaggerate measured volume change. Similar to SPECT, MRI is conducted in the supine position. However, body position (i.e., right decubitus versus seated) did not affect gastric volumes and has a relatively minor effect on gastric emptying of caloric liquids, (17, 20) perhaps because more rapid initial emptying in the seated position is offset by feedback inhibition of gastric emptying by duodenal nutrients. Moreover, as discussed below, fasting and postprandial gastric volumes in this study were similar to a previous study with MRI in the seated position. (7)
Image analysis in this study was a labor intensive process. On average, dedicated technicians required approximately 3 hours to segment LAVA image volumes at each timepoint. Less time was required for analyzing HASTE volumes. Every image was reviewed by the same radiologist. Careful manual segmentation was required to distinguish the outer boundary of the stomach wall from other abdominal structures. Air and labeled fluid can be segmented using semi-automated thresholded connectivity methods (21), but often require manual correction where the automatically extracted regions violate the manually traced stomach wall boundary. Cost and the need for manual image segmentation are potential barriers to widespread use of MRI for gastric imaging. However, it should be feasible to rapidly measure total gastric volumes on postprandial LAVA images acquired by semi-automated analysis. Because gastric accommodation is a reflex, impaired accommodation should be evident in the early postprandial period, necessitating postprandial images for only 30 minutes. (3) Moreover, early postprandial measurements (i.e., at 5 minutes after a meal) are more reproducible and are less likely to be influenced by delayed gastric emptying and/or duodenal nutrient-mediated feedback modulation of gastric accommodation.
Fasting and postprandial gastric volumes and the postprandial gastric volume change measured by MRI were not significantly correlated with SPECT. However, gastric volumes recorded by MRI and SPECT are similar to previous studies. For MRI, the average fasting volume was 170 mL versus 180 mL in a previous study and the postprandial “excess” volume was 70 mL versus 81 mL after 400 kCal (500 mL) dextrose previously. (7) Average fasting and postprandial volumes recorded by SPECT were also comparable to previous studies with SPECT but higher than MRI. (22) Because phantom studies separately with MRI and SPECT suggest that both techniques accurately measure volumes, the observed differences between MRI and SPECT probably reflect differences in the way these techniques image the stomach, rather than a deficiency of either technique. The resolution of SPECT is approximately 8.5 – 9.5 mm in all dimensions, compared to HASTE (1.56mm × 1.66mm × 10mm) and LAVA (1.56mm × 2.5mm × 4mm) MRI sequences. SPECT images take much longer to acquire than MRI images. Therefore, gastric motion, either due to respiratory motion or due to gastric contraction, during the acquisition, could potentially blur the edges and thereby increase the apparent gastric volume. Moreover, during 99mTc scintigraphy, the isotope labels not only the gastric wall (i.e., parietal and non-parietal cells) but is also secreted into the lumen. The relative distribution of 99mTc activity between the wall and the lumen is affected by secretory status. Thus, pentagastrin stimulation increased the activity of 99mTc in the lumen but activity in the wall remained constant. In contrast, MRI directly visualizes the stomach wall. Although gadolinium ions can block nonselective ion channels and activate gastric acid secretion, the gadolinium used for MRI is in a complex (i.e., gadodiamide), which is not decomposed and is excreted unchanged in urine. (23–25)
In summary, our observations suggest that fasting and postprandial gastric volumes and intra-gastric air and fluid content can be measured by a combination of gastric MRI sequences in humans. Different MRI sequences are required to optimally distinguish between air and fluid under fasting (i.e., HASTE sequence) and postprandial conditions (i.e., LAVA sequence). Intra-individual variability was lower for postprandial than fasting gastric volume and also higher for HASTE than LAVA sequences. For postprandial volumes and the postprandial volume change measured by HASTE, intra-subject variability is comparable to gastric emptying measured by scintigraphy in healthy subjects. From a physiological perspective, these observations demonstrate that postprandial gastric expansion is accompanied by increased air, which is not significantly influenced by the mode of drinking. Further studies are required to understand the contributions of gastric relaxation and swallowed air to observed postprandial volume changes.
Acknowledgments
This study was supported in part by USPHS NIH Grant P01 DK068055, NIH Grant C06 RR018898, and by Grant Number 1 UL1 RR024150-01* from the National Center for Research Resources (NCRR), a component of the National Institutes of Health (NIH), and the NIH Roadmap for Medical Research. An abstract of this work was published in Neurogastroenterology and Motility 19:421-2, 2007.
Footnotes
Competing Interests: The authors have no competing interests.
References
- 1.Bredenoord AJ, Chial HJ, Camilleri M, Mullan BP, Murray JA. Gastric accommodation and emptying in evaluation of patients with upper gastrointestinal symptoms. Clinical Gastroenterology and Hepatology. 2003;1:264–272. [PubMed] [Google Scholar]
- 2.Karamanolis G, Caenepeel P, Arts J, Tack J. Association of the predominant symptom with clinical characteristics and pathophysiological mechanisms in functional dyspepsia. [comment] Gastroenterology. 2006;130:296–303. doi: 10.1053/j.gastro.2005.10.019. [DOI] [PubMed] [Google Scholar]
- 3.Mundt MW, Samsom M. Fundal dysaccommodation in functional dyspepsia: head-to-head comparison between the barostat and three-dimensional ultrasonographic technique. Gut. 2006;55:1725–1730. doi: 10.1136/gut.2004.062836. [DOI] [PMC free article] [PubMed] [Google Scholar]
- 4.Mundt MW, Hausken T, Samsom M. Effect of intragastric barostat bag on proximal and distal gastric accommodation in response to liquid meal. American Journal of Physiology - Gastrointestinal & Liver Physiology. 2002;283:G681–686. doi: 10.1152/ajpgi.00499.2001. [DOI] [PubMed] [Google Scholar]
- 5.de Zwart IM, Haans JJL, Verbeek P, Eilers PH, de Roos A, Masclee AA. Gastric accommodation and motility are influenced by the barostat device: assessment with magnetic resonance imaging. Am J Physiol:Gastro Liver Physiol. 2007;292:G208–G214. doi: 10.1152/ajpgi.00151.2006. [DOI] [PubMed] [Google Scholar]
- 6.Burton DD, Kim HJ, Camilleri M, et al. Relationship of gastric emptying and volume changes after a solid meal in humans. American Journal of Physiology -Gastrointestinal & Liver Physiology. 2005;289:G261–266. doi: 10.1152/ajpgi.00052.2005. [DOI] [PubMed] [Google Scholar]
- 7.Goetze O, Steingoetter A, Menne D, et al. The effect of macronutrients on gastric volume responses and gastric emptying in humans: A magnetic resonance imaging study. American Journal of Physiology - Gastrointestinal & Liver Physiology. 2007;292:G11–17. doi: 10.1152/ajpgi.00498.2005. [DOI] [PubMed] [Google Scholar]
- 8.van den Elzen BDJ, Bennink RJ, Wieringa RE, Tytgat GNJ, Boeckxstaens GEE. Fundic accommodation assessed by SPECT scanning: comparison with the gastric barostat. Gut. 2003;52:1548–1554. doi: 10.1136/gut.52.11.1548. [DOI] [PMC free article] [PubMed] [Google Scholar]
- 9.Bouras EP, Delgado-Aros S, Camilleri M, et al. SPECT imaging of the stomach: comparison with barostat, and effects of sex, age, body mass index, and fundoplication. Single photon emission computed tomography. Gut. 2002;51:781–786. doi: 10.1136/gut.51.6.781. [DOI] [PMC free article] [PubMed] [Google Scholar]
- 10.Pouderoux P, Ergun GA, Lin S, Kahrilas PJ. Esophageal bolus transit imaged by ultrafast computerized tomography. Gastroenterology. 1996;110:1422–1428. doi: 10.1053/gast.1996.v110.pm8613047. [DOI] [PubMed] [Google Scholar]
- 11.Fruehauf H, Goetze O, Steingoetter A, et al. Intersubject and intrasubject variability of gastric volumes in response to isocaloric liquid meals in functional dyspepsia and health. Neurogastroenterol Motil. 2007;19:553–561. doi: 10.1111/j.1365-2982.2007.00904.x. [DOI] [PubMed] [Google Scholar]
- 12.Talley NJ, Phillips SF, Wiltgen CM, Zinsmeister AR, Melton LJ. Assessment of functional gastrointestinal disease: the bowel disease questionnaire. Mayo Clin Proc. 1990;65:1456–1479. doi: 10.1016/s0025-6196(12)62169-7. [DOI] [PubMed] [Google Scholar]
- 13.Zigmond A, Snaith R. The hospital anxiety and depression scale. Acta Psychiatr Scand. 1983;67:361–370. doi: 10.1111/j.1600-0447.1983.tb09716.x. [DOI] [PubMed] [Google Scholar]
- 14.Kuiken SD, Samsom M, Camilleri M, et al. Development of a test to measure gastric accommodation in humans. American Journal of Physiology. 1999;277:G1217– 1221. doi: 10.1152/ajpgi.1999.277.6.G1217. [DOI] [PubMed] [Google Scholar]
- 15.Carrasco JL, Jover L. Estimating the generalized concordance correlation coefficient through variance components. Biometrics. 2003;59:849–858. doi: 10.1111/j.0006-341x.2003.00099.x. [DOI] [PubMed] [Google Scholar]
- 16.Bland JM, Altman DG. Comparing two methods of clinical measurement: a personal history. Int J Epidemiol. 1995;24:S7–14. doi: 10.1093/ije/24.supplement_1.s7. [DOI] [PubMed] [Google Scholar]
- 17.Treier R, Steingoetter A, Weishaupt D, et al. Gastric motor function and emptying in the right decubitus and seated body position as assessed by magnetic resonance imaging. J Magn Reson Imaging. 2006;23:331–338. doi: 10.1002/jmri.20507. [DOI] [PubMed] [Google Scholar]
- 18.Goetze O, Treier R, Steingoetter A, et al. Effect of gastric secretion on gastric volume responses, emptying and intragastric dilution in humans - a magnetic resonance imaging (MRI) study. Gastroenterology. 2007;132:T1903. [Google Scholar]
- 19.Cremonini F, Mullan BP, Camilleri M, Burton DD, Rank MR. Performance characteristics of scintigraphic transit measurements for studies of experimental therapies. Alimentary Pharmacology & Therapeutics. 2002;16:1781–1790. doi: 10.1046/j.1365-2036.2002.01344.x. [DOI] [PubMed] [Google Scholar]
- 20.Burn-Murdoch R, Fisher MA, Hunt JN. Does lying on the right side increase the rate of gastric emptying? J Physiol (Lond) 1980;302:395–398. doi: 10.1113/jphysiol.1980.sp013251. [DOI] [PMC free article] [PubMed] [Google Scholar]
- 21.Robb RA. Biomedical Imaging, Visualization and Analysis. New York, NY: John Wiley & Sons, Inc; 1999. [Google Scholar]
- 22.Delgado-Aros S, Camilleri M, Cremonini F, Ferber I, Stephens D, Burton DD. Contributions of gastric volumes and gastric emptying to meal size and postmeal symptoms in functional dyspepsia. [see comment] Gastroenterology. 2004;127:1685–1694. doi: 10.1053/j.gastro.2004.09.006. [DOI] [PubMed] [Google Scholar]
- 23.Le Mignon MM, Chambon C, Warrington S, Davies R, Bonnemain B. Gd- DOTA. Pharmacokinetics and tolerability after intravenous injection into healthy volunteers. Invest Radiol. 1990;25:933–937. [PubMed] [Google Scholar]
- 24.Geibel JP, Wagner CA, Caroppo R, et al. The stomach divalent ion-sensing receptor scar is a modulator of gastric acid secretion. J Biol Chem. 2001;276:39549–39552. doi: 10.1074/jbc.M107315200. [DOI] [PubMed] [Google Scholar]
- 25.Adding LC, Bannenberg GL, Gustafsson LE. Basic experimental studies and clinical aspects of gadolinium salts and chelates. Cardiovascular Drug Reviews. 2001;19:41–56. doi: 10.1111/j.1527-3466.2001.tb00182.x. [DOI] [PubMed] [Google Scholar]


