Japan has the world's highest life expectancy at birth, estimated in 2005 to be 78.7 years for males and 85.5 years for females (World Health Organization 2005). Over the postwar decades as the health status of its population rapidly improved, Japan steadily caught up with and then surpassed the life expectancies of other developed countries. In the United States, life expectancy in 2005 was 75.2 for males and 80.4 for females (US National Center for Health Statistics 2008). US life expectancy has risen more slowly not only than Japan's but also in comparison to many other countries: once near the lead in longevity rankings, the United States is now behind some 30 other countries (Population Reference Bureau 2008).
Age- and sex-specific mortality rates in the United States relative to those in Japan, expressed as ratios, are shown in Table 1. For women, mortality at most ages below 70 years is almost twice as high in the US as in Japan; for men the differences, after age 35, are somewhat smaller. Examining individual causes of death, US mortality from diabetes is more than three times higher than in Japan for men and 5- to 8-fold higher for most ages of women. Cerebrovascular mortality is lower in the US than in Japan for men and fairly similar in the two countries for women up to age 75. Mortality from heart disease is also relatively lower among American men except at the oldest ages; for women, Japan has the advantage over most of the age range.
TABLE 1. Ratio of US/Japan mortality rates by age, sex, and selected causes: 2004.
| All causes | Cancer | Heart disease | Cerebrovascular | Diabetes | ||||||
|---|---|---|---|---|---|---|---|---|---|---|
| Age | Males | Females | Males | Females | Males | Females | Males | Females | Males | Females |
| 20–24 | 2.4 | 1.8 | 1.0 | 1.9 | 0.1 | 0.6 | 0.7 | 1.2 | 4.9 | 5.9 |
| 25–34 | 1.9 | 1.8 | 1.2 | 1.1 | 0.2 | 1.8 | 0.5 | 1.2 | 3.3 | 8.5 |
| 35–44 | 1.7 | 2.0 | 1.5 | 0.9 | 0.4 | 4.2 | 0.5 | 1.0 | 3.6 | 7.1 |
| 45–54 | 1.4 | 1.7 | 1.0 | 1.2 | 0.6 | 1.6 | 0.4 | 1.0 | 2.9 | 5.9 |
| 55–64 | 1.4 | 2.0 | 0.9 | 1.8 | 0.8 | 6.6 | 0.4 | 1.1 | 3.1 | 6.6 |
| 65–74 | 1.3 | 2.0 | 0.8 | 2.0 | 1.1 | 3.8 | 0.5 | 1.0 | 3.0 | 5.0 |
| 75–84 | 1.2 | 1.6 | 0.8 | 1.4 | 1.6 | 1.8 | 0.8 | 0.6 | 3.4 | 3.3 |
| 85+ | 1.0 | 1.3 | 1.0 | 0.7 | 2.8 | 0.8 | 1.3 | 0.3 | 2.9 | 2.6 |
SOURCES: United States: Centers for Disease Control and Prevention (2004); Japan: Ministry of Health, Labour, and Welfare (2006)
Mortality is one indicator of population health, but an earlier sign of deteriorating health is the onset of physiological dysregulation as indicated by adverse levels of a number of biological markers with recognized clinical relevance. A number of individual biomarkers as well as summary indicators of biological risk factors have been associated with poorer physical and cognitive function, more heart disease, and higher mortality (Seeman et al. 2004a; Seplaki et al. 2004). Recent research has reported higher levels of some biological risk factors among Americans compared to British persons of the same age (Banks et al. 2006). On the other hand, the United States appears to have lower levels of blood pressure than many European countries with higher life expectancy (Wolf-Maier et al. 2003).
In this article, we compare the prevalence of clinically recognized risk levels in a number of biological risk factors for men and women across all adult ages in the United States and Japan. This comparison should help us better understand the paths to differential life expectancy between Americans and Japanese.
Background
A number of biological risk factors have been recognized as related to the leading causes of mortality, such as coronary heart disease (CHD) and stroke, and to overall mortality. Elevated blood pressure was one of the earliest known risk factors for heart disease; blood pressure is regularly monitored, with treatment prescribed for adverse levels, in both Japan and the United States. Higher blood pressure levels in Japan compared to the US were assumed to be one explanation for the higher level of stroke mortality among Japanese (Sarti et al. 2000), although as we have shown in Table 1, Japanese women no longer have higher cerebrovascular mortality than American women. Previous research indicates that the prevalence of hypertension in middle age to older adulthood is higher in Japan than in the United States, with the difference being larger for men than for women (Hayes and Taler 1998; Sekikawa and Hayakawa 2004; Ueshima 2007). Of course, levels of blood pressure as well as the size of differentials can change over time. There has been an overall decline in blood pressure levels among Japanese (Ueshima 1990; Ueshima et al. 1987); while in the United States, the incidence of high blood pressure has increased in recent years, especially among women (Crimmins et al. 2005; Kim et al. 2006).
Additional indicators of risk also related to CHD, stroke, and mortality comprise what has become known as metabolic syndrome: adverse levels of weight, cholesterol, and triglycerides and problems with insulin processing. Japanese men and women have much lower levels of body mass index (BMI) than Americans (Ogden et al. 2004; Yoshiike et al. 1998). BMI has increased in recent years, however, in both Japan (Yoshiike et al. 1998) and the United States (Crimmins et al. 2005).
The increase in weight has been linked to an increase in diabetes in the United States (Mokdad et al. 2003) and is assumed to have had the same effect in Japan (Ito et al. 2003). Despite increasing total cholesterol levels in Japan (Ueshima 2007) and recently decreasing levels in the US (Crimmins et al. 2005), total cholesterol levels for middle-aged and older adults have been reported to be somewhat lower in Japan than in the US (Ueshima 2007). High total cholesterol is associated with greater all-cause mortality in both countries (Anderson, Castelli, and Levy 1987; Okamura et al. 2008), although the link between cholesterol and mortality varies across countries and may be weaker in Japan than in other countries (Verschuren et al. 1995).
In addition to a link between individual biological markers and risk for adverse health outcomes, a number of studies have shown that summary indexes of biological risk for an individual are an even better predictor of subsequent CHD, death, and functioning problems (Crimmins et al. 2006; Crimmins and Seeman 2004; Hu et al. 2007; Karlamangla et al. 2006; Seeman et al. 2001, 2004b; Zethelius et al. 2008). Relating a summary measure with nine components to subsequent mortality in a sample of Americans aged 20 and over showed that having an average of three risk factors compared with none reduced life expectancy at age 20 by about six years (Crimmins, Kim, and Seeman 2008). The explanation is that the presence of dysregulation in multiple somatic systems may interact to create higher risk than the additive independent effects. Risk factors in summary measures have included traditional cardiovascular and metabolic indicators discussed above as well as indicators of inflammation and coagulation, functioning of the hypothalamic–pituitary axis (HPA), and the sympathetic nervous system (SNS) (Crimmins et al. 2006; Seeman et al. 1997).
In this article we use information from nationally representative samples in Japan and the United States to characterize levels of biological risk, using individual indicators and summary measures incorporating information on eight indicators of clinically defined risk by age and sex in the two countries. We also examine differences in treatment of two components of risk, hypertension and elevated cholesterol, and the effect of differences in treatment of overall biological risk levels in Japan and the United States. Our hypothesis is that Americans will have higher levels of a number of biological risk factors than Japanese, and we think it is particularly useful to specify how individual risk factors measured using a set of major biomarkers differ between the two countries. We also compare a summary measure of biological risk for the two countries. Our findings clarify differences in risk factors for both men and women within nationally representative data sets that span the adult age range. Because the risk factors we examine have all been related to major chronic disease and mortality, we expect to improve our understanding of health differences that may be related to current and future life expectancy differences between the two countries.
Data and methods
Data sources
We use data from the US National Health and Nutrition Examination Survey (NHANES) (2001–06) and the Japanese Health and Nutrition Survey Report (2004) to investigate age patterns and national differences in biological markers of health among individuals aged 20 and older. The NHANES regularly monitors the health and nutritional status of children and adults in the United States. The survey also collects information about health behaviors and diet. Annually about 5,000 people undergo detailed interviews and medical examinations, including a number of physiological measures and laboratory tests. US counties are the primary sampling units for this survey, which employs a complex sampling design. When weighted, the sample is representative of the American noninstitutionalized population. We use the 2001–06 data since the data are released in two-year intervals, and this set of years is centered on 2004, thereby providing an appropriate chronological comparison with the Japanese data. We use individual-level data from NHANES based on a sample of 15,431 individuals aged 20 and older, 14,542 of whom participated in the laboratory testing used in this analysis.
The 2004 Japanese Health and Nutrition Survey is a subsample from the 2004 Kokumin Seikatsu Kiso Chousa (Comprehensive Survey of Living Conditions of People on Health and Welfare). Kokumin Seikatsu Kiso Chousa employs a two-stage random sampling method. Among 5,280 census tracts, 300 were sampled for inclusion in the Japanese National Health and Nutrition Survey (Katanoda and Matsumura 2002). Because of the Niigata-Chuuetsu Earthquake in October 2004, however, the survey was not conducted in two of the 300 census tracts. From the census tracts, approximately 3,400 households and 9,300 household members were eligible for the survey. Among these, 6,509 were aged 20 or over and 6,188 participated in physiological measurements while 3,932 provided blood samples. The survey, used without weights, has been shown to be broadly representative of the Japanese population (Katanoda et al. 2005). Women are slightly overrepresented in the sample (1–2 percent higher than in the population), perhaps because of their greater willingness to respond or greater accessibility. Also, Japanese ages 20–29 are slightly underrepresented in the sample, perhaps because of greater difficulty in contacting members of this age group.
The Japanese Health and Nutrition Survey provides information on participants' demographic characteristics, physical examinations, health behaviors, diet, and laboratory evaluations. The sample number varies across biological markers because some people did not participate in all tests. For this analysis, we have only group-level published data for Japanese.
Defining biological risk
In each country, we examine the percent of the population with measured levels above the clinically established level for defining risk related to eight indicators: systolic blood pressure (SBP), diastolic blood pressure (DBP), total cholesterol, high density lipoprotein (HDL) cholesterol, triglycerides, glycosylated hemoglobin, albumin, and BMI. Most of these are well-established indicators of cardiovascular and metabolic risk, and measurement is fairly standard in major laboratories around the world. Appendix Table 1 provides information on the collection and assay methods used in the two countries. Five of these indicators, measures of total cholesterol, HDL, triglycerides, glycosylated hemoglobin, and albumin, are based on assays from venous blood collection taken in a laboratory setting, which should produce comparable results in the two countries. Lipid assays used in both countries are certified by the US Centers for Disease Control and Prevention. While comparability across studies is always a concern, we would be more concerned about comparability if blood samples were being drawn in homes by nonmedical personnel or if assays were based on blood spots rather than standard laboratory procedures for whole blood collection (McDade, Williams, and Snodgrass 2007). Cholesterol and triglyceride levels are indicators of lipid levels (Crimmins et al. 2008). Glycosylated hemoglobin is an indicator of recent insulin processing and an indicator of risk for diabetes (Rohlfing et al. 2000). Low albumin is an indicator of both poor diet and inflammation and has been related to a number of adverse health consequences (Kalantar-Zadeh et al. 2001; Reuben et al. 2000, 2002). BMI is computed from measured height and weight in both studies; blood pressure, height, and weight are measured in physical exams by trained personnel.
APPENDIX TABLE 1. Collection and assay methods used in the United States and Japan.
| United States | Japan | |||||
|---|---|---|---|---|---|---|
| Biomarker | Measure | Method | Calibration | Measure | Method | Calibration |
| Systolic blood pressure | Physical exam | Average of 3 sets of blood pressure measurements | Physical exam | Average of 2 sets of blood pressure measurements | ||
| Diastolic blood pressure | Physical exam | Average of 3 sets of blood pressure measurements | Physical exam | Average of 2 sets of blood pressure measurements | ||
| Total cholesterol | Blood serum | Hitachi 704/717/912 Analyzer (Roche Diagnostics) | Frozen serum calibration pools (Soloman Park Laboratories, Kirkland, WA) | Blood serum | Hitachi 7170 | Seiken Liquid Abnormal |
| HDL cholesterol* | Blood serum | Hitachi 704/717/912 Analyzer (Roche Diagnostics) | Frozen serum calibration pools (Soloman Park Laboratories, Kirkland, WA) | Blood serum | Hitachi 7170 | Cholestest®N Calibrator (Sekisui Medical Co. Ltd.) |
| Fasting triglycerides | Blood serum | Hitachi 704/717/912 Analyzer (Roche Diagnostics) | Calibration sera (Precical, cat no 620213) | Blood serum | Hitachi 7170 | Multi cariblator lipid |
| Body mass index | Physical exam | Exam weight, standard anthropometry | Physical exam | Exam weight, standard anthropometry | ||
| Glycosylated hemoglobin | Whole blood | Primus Automated HPLC System/ Tosoh Alc 2.2 Plus Glycohemoglobin Analyzer | Primus high performance liquid chromatography (HPLC) | Whole blood | BM 9030 (JEOL Ltd) | RAPIDIA® Auto HbAlc (Sekisui Medical Co. Ltd.) |
| Albumin | Blood serum | Beckman Synchron LX20 | Synchron Protein Calibrators (Part #450202) | Blood serum | Hitachi 7170 | Protein Standard |
Change in assay methods since 2001 was adjusted by correcting HDL in 2001–02 and 2005–06 using the Solomon Lab quality controls: Corrected HDL = [(Solomon Park assigned HDL value) × (Participant HDL)] /(Quality Control HDL value associated with participant sample) HDL = high density lipoprotein
In order to make our biomarker measurement as comparable as possible between the two countries, we adjust the sample used for some markers. For instance, we exclude blood pressure of pregnant women in the United States to make the data comparable with those from Japan, where blood pressure was measured only for nonpregnant women. In Japan the entire sample fasted for at least three hours before blood was taken; only about half the sample fasted in the United States. In order to include comparable data, triglyceride levels were included only for those who fasted for at least three hours in the US, resulting in a smaller sample than for the other biomarkers in the US.
The collection of blood pressure was done slightly differently in the two countries, although in both the measurement was done manually by trained personnel. In the United States, the components of blood pressure are measured three times and, in Japan, they are measured twice; in each case, the average of the readings is computed and used to determine high blood pressure. To ensure comparability, we compared the prevalence of high SBP and high DBP in the United States using both approaches and did not find significant differences in the level of high blood pressure using the two approaches.
The cutoff points indicating clinical risk are listed in Table 2. While we recognize that the clinical significance of particular thresholds may differ across countries (e.g., with respect to weight: Ito et al. 2003; Reynolds et al. 2008; WHO Expert Consultation 2004), we use the same cutpoints for all markers in the two countries. We also examine treatment for hypertension and elevated cholesterol. We consider medication use as well as measured risk for SBP, DBP, and total cholesterol in creating alternative measures of risk. This allows us to examine national differences in risk, adjusting for use of drugs affecting specific risk factors.
TABLE 2. High-risk cutoff points for biological risk factors and sample sizes, United States and Japan.
| Indicator | High-risk cutoff point | Sample size | |
|---|---|---|---|
| United States | Japan | ||
| Systolic blood pressure* | ≥140 mmHg | 12,692 | 4,304 |
| Diastolic blood pressure* | ≥90 mmHg | 12,692 | 4,304 |
| Total cholesterol | ≥240 mg/dL | 13,648 | 3,931 |
| HDL cholesterol | <40 mg/dL | 13,647 | 3,931 |
| Fasting triglycerides | ≥200 mg/dL | 7,313 | 3,931 |
| Body mass index | ≥25 kg/m2 | 14,017 | 5,517 |
| Glycosylated hemoglobin | ≥6.4% | 13,795 | 3,919 |
| Albumin | <3.8 g/dL | 13,616 | 3,931 |
Average of three sets of blood pressure measurements in the US and the average of two measurements in Japan. HDL = high density lipoprotein
We also compare the two populations on health behaviors that are known to be related to biological risk factors: current smoking, fat consumption, and exercise.
Methods
We compare the prevalence of each individual risk factor in an age-sex group for the two countries. We also develop a summary measure of biological risk that represents the mean number of risk factors present for an individual, out of eight measured (above or below) risk levels in an age, sex, and country group. Average biological risk is the sum of the proportions in each age-sex group having high-risk levels of each of the eight biomarkers. More complicated approaches to measurement of biological risk have not proven to significantly increase predictive ability (Karlamangla et al. 2002; Singer, Ryff, and Seeman 2004). In this case, without individual-level data for Japan, we have no alternative to our simple approach. The results are presented graphically with the vertical bars showing the 95 percent confidence intervals (CIs) surrounding the point estimates. The width of the 95 percent CIs is calculated as 1.96 times the standard error of the proportion.
Results
Measured biological risk
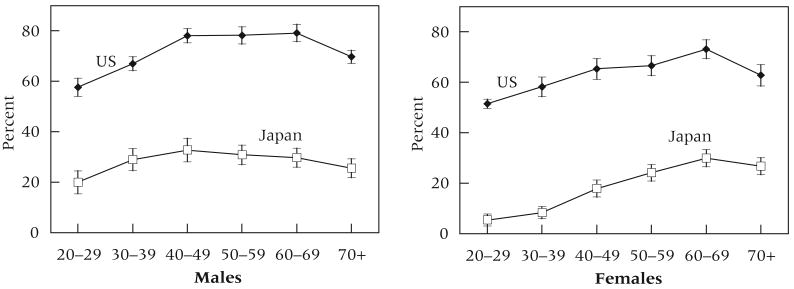
We begin by examining differences between the United States and Japan in the percentage of individuals who are overweight. We focus on overweight (BMI of 25 kg/m2 or greater) rather than obesity (BMI of 30 kg/m2 or greater) because this is the only high level of BMI for which detailed information is presented in the Japanese data. The percent of Americans overweight greatly exceeds that of Japanese in every age-sex group (Figure 1). Compared to Japanese, about 40 to 50 percent more Americans are overweight in each age group. Among men, the percent overweight is 2 to 3 times higher among Americans; among women, the percent overweight at ages less than 40 is 7 to 10 times higher in the United States than in Japan. For men and women in both countries, people 70 and older are less likely to be overweight than people in their 60s, perhaps reflecting the incidence of weight-related deaths.
FIGURE 1. Percent of Japanese and US men and women who are overweight (BMI ≥25 kg/m2) by age.
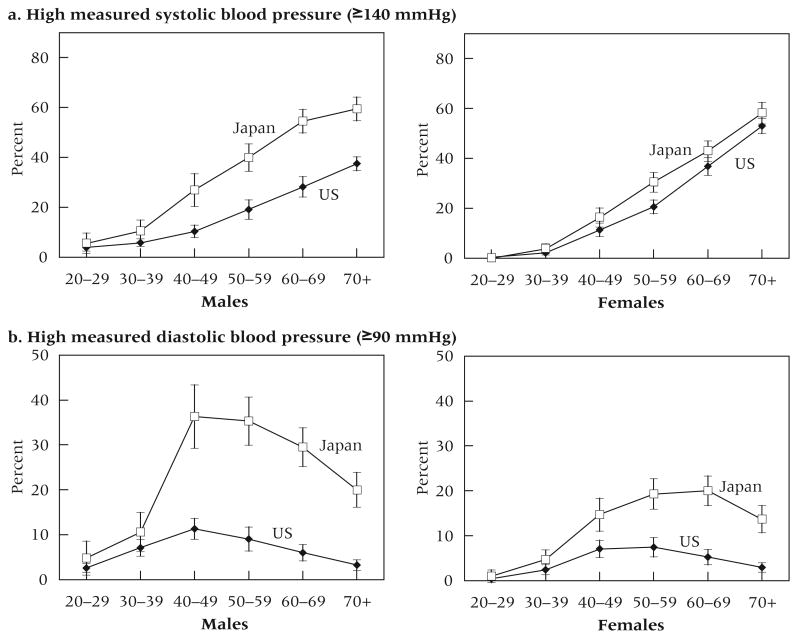
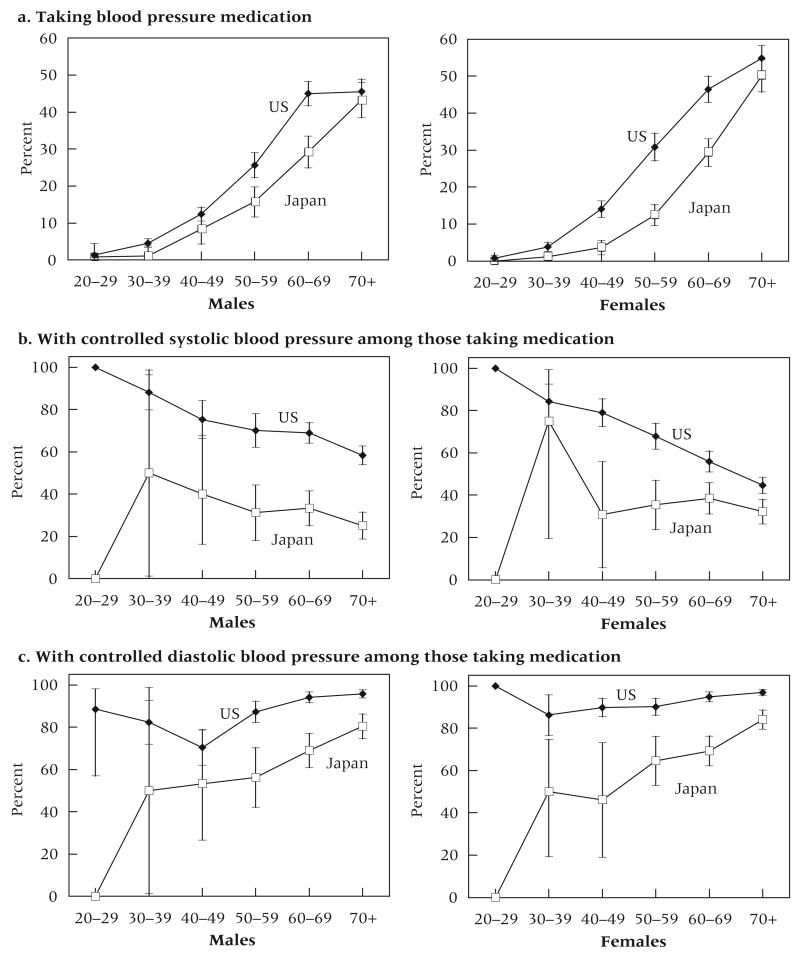
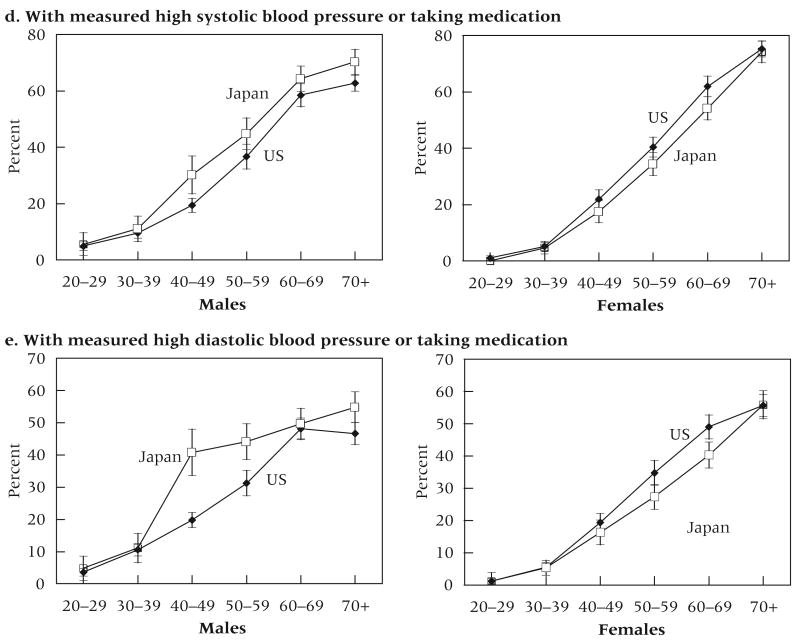
Measured high blood pressure is more prevalent in Japan than in the United States after age 40 (Figure 2). The differences for men are large: the proportion with high SBP is about twice as high in Japan as in the United States (Figure 2a). For women, the difference between the two countries is significant only at ages 50–59. Japanese have higher levels of high DBP after age 40 (Figure 2b). The differences between men in the two countries in high-risk levels of DBP are even greater than differences for SBP.
FIGURE 2. Percent of Japanese and US men and women by age with.
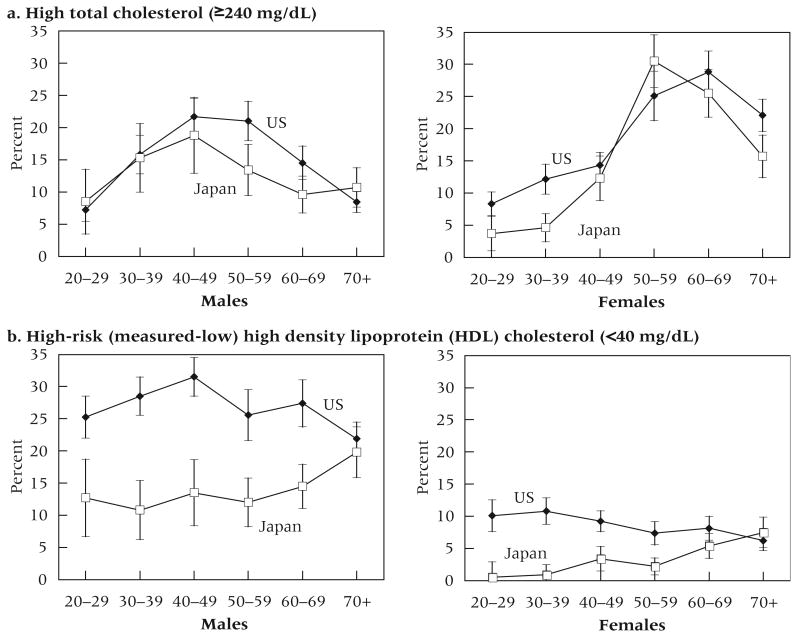
The differences between Americans and Japanese in high-risk total cholesterol are more complex (Figure 3a). American men have significantly higher levels at late middle ages (ages 50–59); at these ages there is no difference for women. On the other hand, Japanese women have lower levels than American women up to age 40 and at ages 70 and over. American men and women have a significantly higher prevalence of high-risk—low—HDL than their Japanese counterparts until the old ages (Figure 3b). In fact, in a number of age groups, American men and women are 2 to 3 times more likely to have low HDL. American women in their 20s and 30s are 10 to 20 times more likely to have low HDL than Japanese women.
FIGURE 3. Percent of Japanese and US men and women by age with.
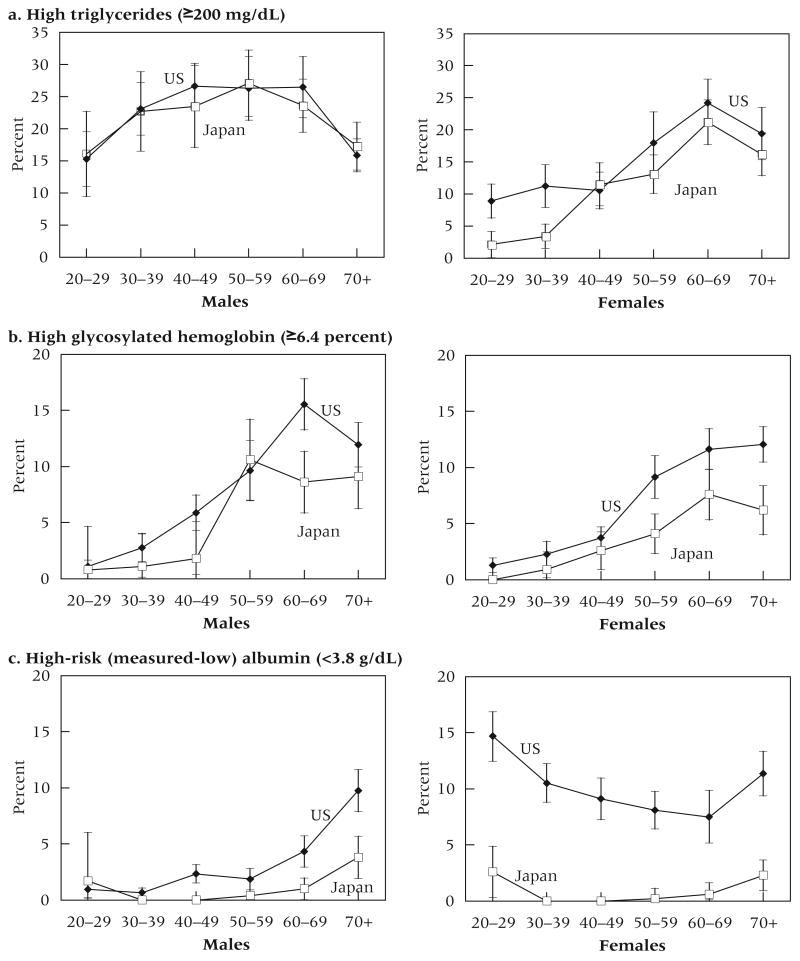
High levels of triglycerides are significantly more prevalent among American women below age 40; by contrast, for men, the percent with high levels of triglycerides is the same at all ages in the two countries (Figure 4a). Adverse levels of glycosylated hemoglobin are more prevalent among American women than among Japanese women in some age groups (Figure 4b). Among men, Americans have a significantly higher level of glycosylated hemoglobin at ages 60–69. Low albumin is very uncommon among Japanese women but characterizes a high percent of American women, particularly those at younger ages (Figure 4c). The percent with low albumin rises with age among American men and is significantly higher among American men than Japanese men at most ages, but the differences between men in the two countries are not as great as among women.
FIGURE 4. Percent of Japanese and US men and women by age with.
Biological risk and medication use
Because the prevalence of some risk factors is affected by medication use, examination of the use of medications and the level of control of risk achieved through medication use in the two countries is indicative of how medical care may differentially affect biological risk. Measured blood pressure can be altered by the use of medication to lower blood pressure. Some of those with blood pressure measured even below the cutoff level have been diagnosed with high blood pressure in the past and use medication to control blood pressure. If one has had high blood pressure and it is now controlled, mortality risk may still be elevated (Benetos et al. 2003).
In both the United States and Japan, treatment for hypertension is recommended when SBP is ≥140 mmHg and DBP is ≥90 mmHg (Chobanian et al. 2003; Japan Society of Hypertension 2008). After age 30 and before age 70, more Americans than Japanese are taking blood pressure medication (Figure 5a). The differences in use of antihypertensive medication are even greater among women than men. About 10 to 20 percent more women in the United States are taking medication in each age group from 40 to 70. The use of medication is similar among the youngest and oldest age groups in the two countries. While guidelines for treatment of hypertension are the same in Japan as in the US, Americans who take medication to lower blood pressure are more likely than Japanese taking medication to achieve control of both SBP and DBP. This means that Americans are both more likely to use medication to control the risk of hypertension and more effective in reducing hypertension when medication is used. In both countries, younger people are more likely to achieve control of SBP than older people (Figure 5b); for DBP, the control is better at older ages (Figure 5c).
FIGURE 5. Percent of Japanese and US men and women by age.
If we define high-risk blood pressure to include people who are taking blood pressure medication along with people with high measured risk, we have a better indication of the prevalence of those who have ever had high-risk levels of blood pressure. When this is done, the national differences in level of high-risk SBP change. Among men, the differences in prevalence are now small and generally insignificant, but Japanese men still have a higher prevalence of hypertension. American and Japanese women have similar levels of ever-having high SBP (Figure 5d). The results are similar when medication use is considered along with measured high DBP (Figure 5e).
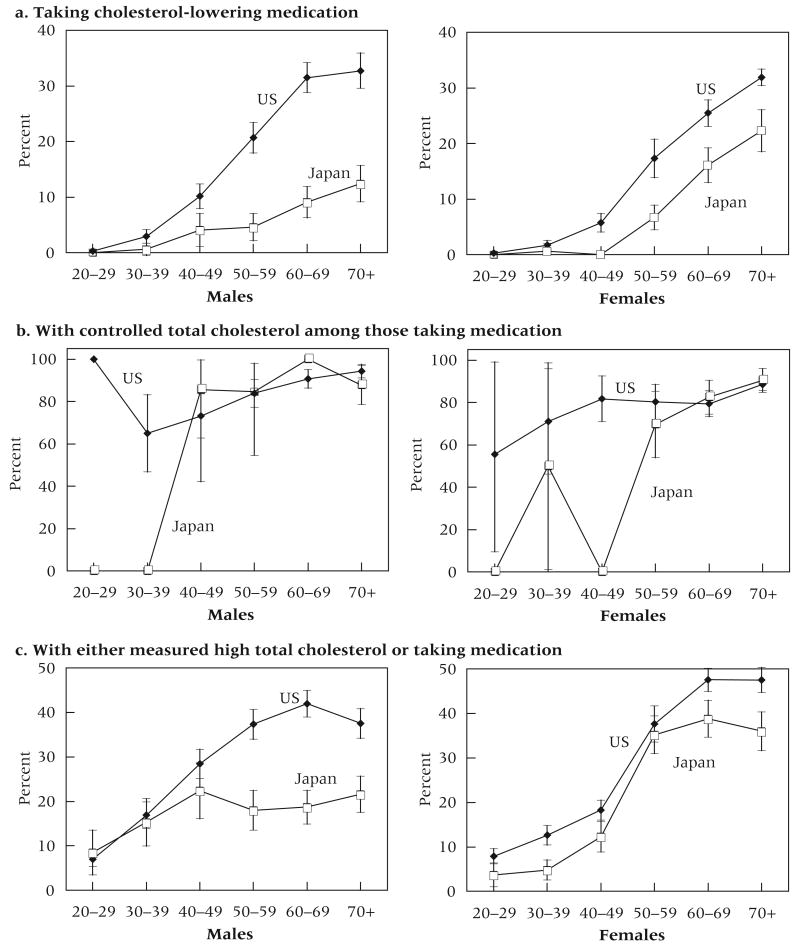
Current guidelines recommend treatment for elevated levels of lipids at lower levels in Japan than in the United States (high total cholesterol is >220 mg/dL in Japan and ≥240 mg/dL in the US; high triglycerides >150 mg/dL in Japan and ≥200 mg/dL in the US) (Atherosclerosis Society of Japan 2008; Expert Panel 2001). In spite of the higher levels at which treatment is recommended in the United States, American men and women are more likely to be taking cholesterol-lowering medication at all ages (Figure 6a); the differences are significant over age 30 for both men and women. Use of medication increases with age in all groups, but even over age 70 very few Japanese men report taking such medication (12.4 percent) while the corresponding figure is a third (32.7 percent) for American men. The differences among women in the two countries are smaller. Japanese women are more likely than Japanese men of the same age to take cholesterol-lowering medication after age 50. In the United States, use among men and women is the same at ages 70 and over; before that, it is somewhat more common among men. Among those using medication, control of total cholesterol is about the same among Japanese and American men; American women have higher levels of control in middle age (40–49) (Figure 6b).
FIGURE 6. Percent of Japanese and US men and women by age.
If use of medication is taken into account in defining high-risk levels of total cholesterol, Americans fare somewhat worse than they did when we use the indicator based only on measured high total cholesterol (Figure 6c). The percent of American men with total cholesterol that is either being treated or is measured high is significantly greater than that for Japanese men over age 50. For women, Americans have significantly higher levels of diagnosed high total cholesterol than Japanese at all ages except for women in their 20s and 50s.
Summary measures
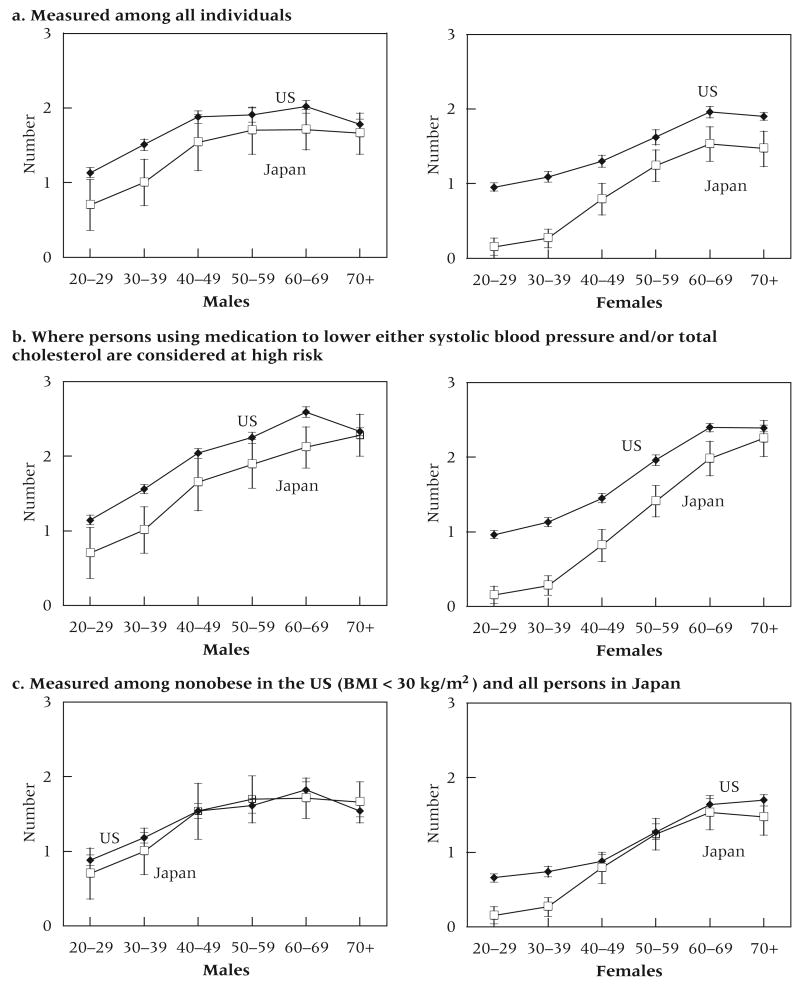
We now compare summary measures of biological risk, indicating the average number of measured risk factors out of eight (Figure 7a). The level of biological risk is higher among Americans than among Japanese at all ages, although for men the difference is not significant over age 40. The differences between American and Japanese women are generally larger than those for men, particularly at younger ages, and they are significant across the age range. Such differences by age in cross-sectional data could reflect biological risk rising at an earlier age among Americans than among Japanese, particularly among women; or they could reflect cohort differences, with increasing divergence between the two countries among younger cohorts.
FIGURE 7. Average number of high-risk biomarkers out of eight biomarkers for Japanese and US men and women, by age.
If we compute the summary measure of biological risk using the same eight indicators, but define SBP and total cholesterol as high risk when a person is using medication for high levels of either of these conditions, the pattern of differences is about the same except that American men in their 60s have significantly higher risk than Japanese men of the same age (Figure 7b). We also find that women in the two countries have the same level of risk over age 70. For both men and women, Americans have higher risk at earlier ages.
The effect of overweight and obesity
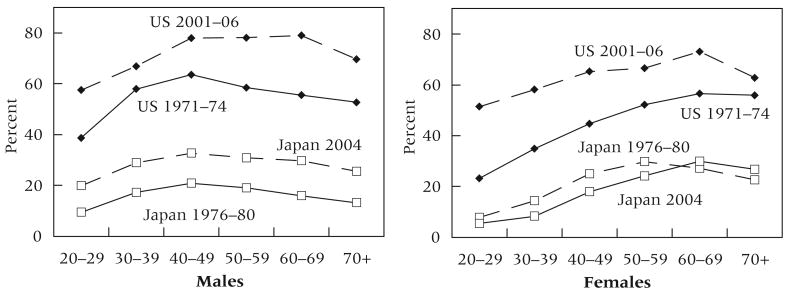
As indicated in Figure 1, many more Americans than Japanese are overweight. These national differences have grown larger in recent years, particularly among women at younger adult ages (Figure 8). Over the last two or three decades, overweight has increased markedly among both men and women in the United States and among men in Japan. Japanese women have not seen sharp increases. Because of the very large difference between Americans and Japanese in the prevalence of being overweight, and the fact that being overweight is a precursor to many of the other risk factors considered, such as hypertension, high total cholesterol, and high triglycerides (Must et al. 1999; National Heart, Lung, and Blood Institute 1998; Pi-Sunyer 1993), we estimate the effect of differential obesity on the overall level of biological risk. Only 3 percent of Japanese are obese (BMI ≥ 30 kg/m2) as opposed to 34.8 percent of Americans. Because we do not have individual-level data for Japanese, we cannot eliminate obese persons from the Japanese data. For the United States, we eliminate the 34.8 percent of the sample (4,948 people out of 14,221) who have a BMI ≥ 30 kg/m2, then compute the summary measure of biological risk for the nonobese subsample and compare it to the summary measure for all Japanese. Among the sample of nonobese Americans, 50.2 percent are overweight, which is still about twice as high as the 26.3 percent overweight among Japanese. The average summary risk level for nonobese American men is the same as that for Japanese men at every age. Nonobese American women have similar levels of risk to Japanese women from ages 40 and over, but American women younger than age 40 have excess risk (Figure 7c).
FIGURE 8. Percent of Japanese and US men and women overweight (BMI ≥ 25 kg/m2), by age: 1970s and 2000s.
SOURCES: US 1971–74 from Flegal et al. (1998); Japan 1976–80 from Yoshiike et al. (2002).
Discussion and conclusions
American men and women overall have higher levels of biological risk than Japanese, particularly at ages up to 50. Three findings are noteworthy. First, the differences in prevalence in many markers of risk between American and Japanese women are particularly large at younger ages. Second, prescription drug use in the United States has become an important mechanism of controlling both individual risk and the population prevalence of high cholesterol and high blood pressure. Without the higher use of prescription drugs, the United States would have even more elevated levels of risk. Third, the role of body weight in the United States appears to be highly significant.
If we eliminate obese persons, the American population becomes similar to the Japanese population in the summary level of biological risk, except in the case of younger women. This is, of course, only an exercise in indicating the possible potential of weight; we cannot conclude that being overweight is the reason that biological risk and mortality are higher in the United States. In fact, a number of studies have shown that higher weight is not always linked to higher mortality in either country (Flegal et al. 2005; Kuriyama et al. 2004). However, the weight differences between the two countries undoubtedly result from differences in fundamental behaviors and culture that may have additional important health influences.
While weight is clearly a much greater health problem among Americans, differences between the two countries in the other individual biological risk factors are complex. Measured levels of blood pressure are higher for Japanese than for Americans. While high blood pressure may result from different circumstances in the two countries, our analysis shows that the lower levels of measured high blood pressure in the United States are the result of more Americans using medication to reduce blood pressure and using this medication more effectively than Japanese. On the other hand, measured lipid levels tend to be higher among Americans than among Japanese and would be even higher if Americans were not more likely to use cholesterol-lowering medication. The levels of glycosylated hemoglobin are also more likely to be high among Americans. However, high levels of triglycerides, another metabolic indicator, are not more common among American men, indicating that not all of the factors in the metabolic syndrome are higher among Americans. Additionally, inflammation, as indicated by low albumin levels, seems particularly high among American women relative to their Japanese counterparts.
Comparisons of levels of biological markers for late-middle-aged persons between non-Hispanic whites in the United States and in Britain have shown that Americans have similar levels of hypertension but are more likely to have adverse levels of weight, glycosylated hemoglobin, inflammation, and HDL cholesterol than the British (Banks et al. 2006). On the other hand, the United States has a relatively low level of hypertension compared to a number of European countries (Wolf-Maier et al. 2003). Our findings for Japan add to the literature that suggests that Americans have worse levels of a number of clinical predictors of poor health, particularly the metabolic and inflammatory markers but not hypertension. Also, our findings of a larger difference at younger ages in biological risk between Japan and the United States may suggest that changes in physiological dysregulation occur at younger ages among Americans, or differ more substantially between recent Japanese and American adult cohorts. If more years are spent with dysregulation by the time Americans reach older age, this may provide another impetus for shorter life expectancy.
Many factors can be invoked in explaining the observed differences in risk factors between the two countries. Differences in health care, culture, diet, behaviors, and other lifestyle factors may play a role. The differences in biological risk are unlikely to be explained by differences in per capita health care spending, since less is spent on health care in Japan than in the United States (Hagist and Kotlikoff 2005). The differences, however, may be related to the availability of health care throughout life in the two countries. Some studies have suggested that one reason for relatively good health in Japan is the presence of a well-established system of universal health care (Wise and Yashiro 2006). While all Japanese are provided health care coverage either through universal health insurance or through employment-based insurance (Barker 2006; Bean 2005), many people in the United States spend years without health insurance. This may be one reason that socioeconomic differences in health in Japan are small relative to those in the United States (Marmot and Davey Smith 1989).
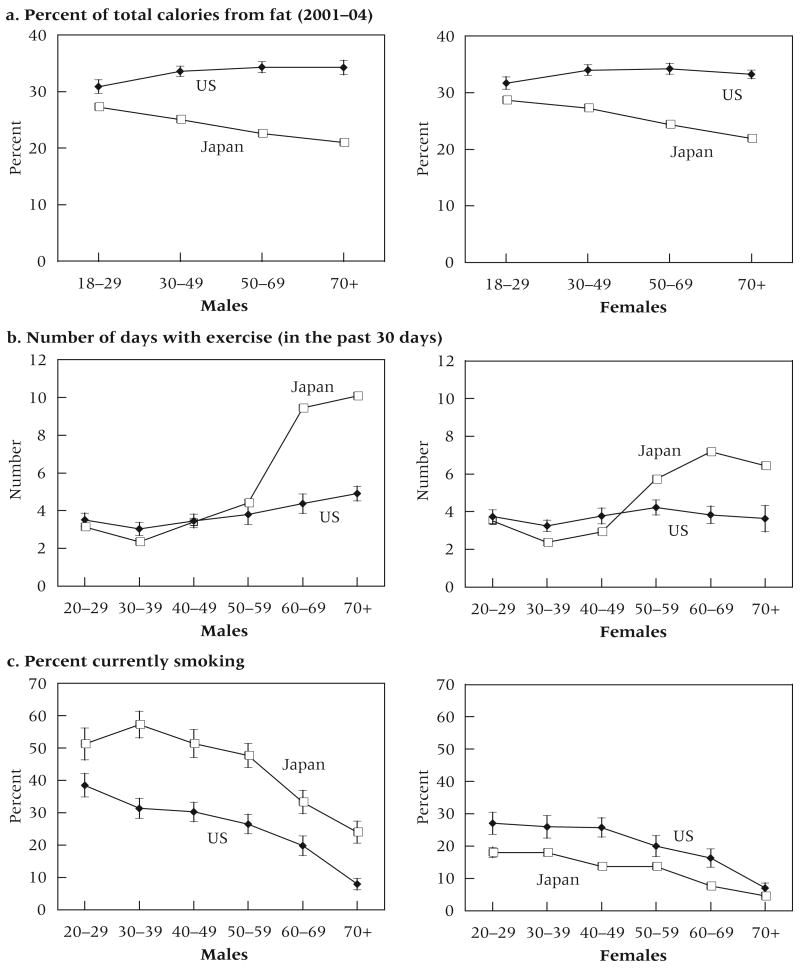
Low-fat diets among Japanese have been suggested as one of the reasons for their low levels of obesity and high levels of life expectancy (Marmot and Davey Smith 1989). Evidence from the two surveys analyzed here indicates that the percent of calories from fat is lower in Japan than in the United States after age 20 (Figure 9a). The differences are widest at the oldest ages. In Japan, the percent of calories from fat declines with age in these cross-sectional data; in the United States, it is constant across age. The change with age in Japan could reflect cohort changes in the consumption of nontraditional foods by younger people. Available measures of exercise are not ideal, as they tend to emphasize rigorous, routine, and formal exercise rather than total energy expenditure; nor are they perfectly comparable between the two countries. But given these caveats, the data indicate similar exercise behavior in both countries up to age 50 and more exercise among older Japanese (Figure 9b). Current smokers are more common among Japanese males. Among females, the differences are small and tend to be insignificant at the oldest ages, but American women smoke more at younger ages (Figure 9c).
FIGURE 9. Health behaviors of Japanese and US men and women, by age.
Numerous limitations to our analysis must be mentioned. The lack of individual-level data for Japanese eliminates any ability to link individual levels in one risk factor to levels of other risk factors as well as to other social, demographic, and behavioral factors. In addition, we are limited in the physiological indicators that we can investigate; many physiological paths are not included in our analysis. For instance, neither survey includes markers of HPA or SNS dysregulation, which could reflect different levels of stress and social support related to differences in the social structures of the two countries.
The greatest limitation in these data for both countries is that they are cross-sectional. Our data are displayed by age, but age differences at one historical date are not necessarily representative of how any one cohort ages. We cannot separate age and cohort effects in interpreting the observed differences. Perhaps most importantly, we cannot link the presence of the risk factors to subsequent mortality to see how the relationships differ between countries. Studies in Taiwan have found the links of some of these variables to mortality to be somewhat smaller than those reported in the United States (Goldman et al. 2006). Thus, we must be cautious in linking observed differences in biological risks to differences in life expectancy. We observe the largest differences between Japanese and Americans at younger ages, which are not the ages when death occurs for most people. The differences in life expectancy between the United States and Japan result from deaths at the oldest years, when the biological risk between the two countries is currently much more similar. It is difficult to determine how mortality has already selected the group that has reached or is approaching old age in both countries, and this selection is certainly linked to the level of both past and current biological risk (Crimmins, Kim, and Seeman 2008). Most people who are dying now lived much of their lives in epidemiological and risk-factor regimes different from those experienced by much younger Japanese and Americans.
In addition, we do not know how long any one person has had an indicator of dysregulation at a given age. Cumulative wear and tear on a system may be what leads to mortality, but one cannot conclude this from cross-sectional data. Our data are consistent with the idea that Americans have an earlier onset of conditions and more years of dysregulation by the time they reach ages with high risk of mortality. Perhaps the dysregulation attached to high weight levels over many years among Americans is now being reflected in mortality. On the other hand, Japanese men appear to be getting away with smoking, perhaps because they took it up more recently than men in some other countries. We can only suggest these possibilities, which would have to be examined with panel data.
Notwithstanding these limitations, we think that our analysis points to some of the physiological factors that underlie the relatively low level of American life expectancy. It provides documentation of relatively high incidence of risk factors among Americans across the age range, and the fact that these differences are largest between younger adults in the two countries may be an indication that life expectancy in Japan and the United States will continue to diverge.
Acknowledgments
This work was partially supported in the United States by the National Institute on Aging Grants P30 AG17265 and T32AG0037 and in Japan by MEXT.ACADEMIC FRONTIER (2006-2010).
References
- Anderson Keaven M, Castelli William P, Levy Daniel. Cholesterol and mortality: 30 years of follow-up from the Framingham study. Journal of the American Medical Association. 1987;257(16):2176–2180. doi: 10.1001/jama.257.16.2176. [DOI] [PubMed] [Google Scholar]
- Atherosclerosis Society of Japan. Hyperlipidemia guidelines. [23 July 2008];2008 at « http://www.shukanbyo.com/sub_seikatsu05.htm».
- Banks James, Marmot Michael, Oldfield Zoe, Smith James P. Disease and disadvantage in the United States and in England. Journal of the American Medical Association. 2006;295(17):2037–2045. doi: 10.1001/jama.295.17.2037. [DOI] [PubMed] [Google Scholar]
- Barker M Ryan. Issue Brief: Japan and Massachusetts — A Comparison of Universal Health Care Systems. Missouri Foundation for Health. [23 July 2008];2006 at « http://www.mffh.org/JapanMassachusetts.pdf».
- Bean James R. National healthcare spending in the U.S. and Japan: National economic policy and implications for neurosurgery. Neurologia Medico-Chirurgica. 2005;45(1):18–24. doi: 10.2176/nmc.45.18. [DOI] [PubMed] [Google Scholar]
- Benetos Athanase, Thomas Frédérique, Bean Kathryn E, Guize Louis. Why cardiovascular mortality is higher in treated hypertensives versus subjects of the same age, in the general population. Journal of Hypertension. 2003;21(9):1635–1640. doi: 10.1097/00004872-200309000-00011. [DOI] [PubMed] [Google Scholar]
- Chobanian Aram V, et al. Seventh report of the Joint National Committee on prevention, detection, evaluation, and treatment of high blood pressure. Hypertension. 2003;42:1206–1252. doi: 10.1161/01.HYP.0000107251.49515.c2. [DOI] [PubMed] [Google Scholar]
- Centers for Disease Control and Prevention. CDC Wonder Compressed Mortality, 1999–2005 Request. [23 July 2008]; at « http://wonder.cdc.gov/cmf-icd10.html».
- Crimmins Eileen M, Alley Dawn, Reynolds Sandra L, Johnston Melanie, Karlamangla Arun, Seeman Teresa. Changes in biological markers of health: Older Americans in the 1990s. Journals of Gerontology Series A: Biological Sciences and Medical Sciences. 2005;60(11):1409–1413. doi: 10.1093/gerona/60.11.1409. [DOI] [PubMed] [Google Scholar]
- Crimmins Eileen M, Johnston Melanie L, Hayward Mark, Seeman Teresa. Age differences in allostatic load: An index of frailty. In: Yi Zeng, et al., editors. Longer Life and Healthy Aging. Dordrecht, Netherlands: Springer; 2006. pp. 111–126. [Google Scholar]
- Crimmins Eileen M, Kim Jung Ki, Seeman Teresa. Poverty and biological risk: The earlier ‘aging’ of the poor. Journals of Gerontology Series A: Biological Sciences and Medical Sciences. 2008 doi: 10.1093/gerona/gln010. Forthcoming. [DOI] [PMC free article] [PubMed] [Google Scholar]
- Crimmins Eileen M, Seeman Teresa E. Integrating biology into the study of health disparities. Population and Development Review. 2004;30 Suppl:89–107. [Google Scholar]
- Crimmins Eileen M, Vasunilashorn Sarinnapha, Kim Jung Ki, Alley Dawn. Biomarkers related to aging in human populations. Advances in Clinical Chemistry. 2008;46:161–215. doi: 10.1016/s0065-2423(08)00405-8. [DOI] [PMC free article] [PubMed] [Google Scholar]
- Expert Panel on Detection, Evaluation, and Treatment of High Blood Cholesterol in Adults. Executive summary of the Third Report of The National Cholesterol Education Program (NCEP) Expert Panel on detection, evaluation, and treatment of high blood cholesterol in adults (Adult Treatment Panel III) Journal of the American Medical Association. 2001;285(19):2486–2497. doi: 10.1001/jama.285.19.2486. [DOI] [PubMed] [Google Scholar]
- Flegal Katherine M, Carroll Margaret D, Kuczmarski Robert J, Johnson Clifford L. Overweight and obesity in the United States: Prevalence and trends, 1960–1994. International Journal of Obesity. 1998;22(14):39–47. doi: 10.1038/sj.ijo.0800541. [DOI] [PubMed] [Google Scholar]
- Flegal Katherine M, Graubard Barry I, Williamson David F, Gail Mitchell H. Excess deaths associated with underweight, overweight, and obesity. Journal of the American Medical Association. 2005;293(15):1861–1867. doi: 10.1001/jama.293.15.1861. [DOI] [PubMed] [Google Scholar]
- Goldman Noreen, et al. Predicting mortality from clinical and nonclinical biomarkers. Journal of Gerontology Series A: Biological Sciences and Medical Sciences. 2006;61(10):1070. doi: 10.1093/gerona/61.10.1070. [DOI] [PubMed] [Google Scholar]
- Hagist Christian, Kotlikoff Lauren J. National Bureau of Economic Research Working Paper Series (Paper 11833) Cambridge, MA: 2005. Who's going broke? Comparing healthcare costs in ten OECD countries. [Google Scholar]
- Hayes Sharonne N, Taler Sandra J. Hypertension in women: Current understanding of gender differences. Mayo Clinic Proceedings. 1998;73(2):157–165. doi: 10.1016/S0025-6196(11)63649-5. [DOI] [PubMed] [Google Scholar]
- Hu Peifeng, Wagle Naveed, Goldman Noreen, Weinstein Maxine, Seeman Teresa E. The associations between socioeconomic status, allostatic load and measures of health in older Taiwanese persons: Taiwan Social Environment and Biomarkers of Aging Study. Journal of Biosocial Science. 2007;39(4):545–556. doi: 10.1017/S0021932006001556. [DOI] [PubMed] [Google Scholar]
- Ito Hiroyuki, et al. Detection of cardiovascular risk factors by indices of obesity obtained from anthropometry and dual-energy X-ray absorptiometry in Japanese individuals. International Journal of Obesity and Related Metabolic Disorders. 2003;27(2):232–237. doi: 10.1038/sj.ijo.802226. [DOI] [PubMed] [Google Scholar]
- Japan Society of Hypertension High blood pressure treatment guidelines. [23 July 2008];2008 at « http://www.jhf.or.jp/a&s_info/guideline/kouketuatu.html».
- Kalantar-Zadeh Kamyar, Kopple Joel D, Block Gladys, Humphreys Michael H. A malnutrition-inflammation score is correlated with morbidity and mortality in maintenance hemodialysis patients. American Journal of Kidney Disease. 2001;38(6):1251–1263. doi: 10.1053/ajkd.2001.29222. [DOI] [PubMed] [Google Scholar]
- Karlamangla Arun S, Singer Burton H, McEwen Bruce S, Rowe John W, Seeman Teresa E. Allostatic load as a predictor of functional decline: MacArthur Studies of Successful Aging. Journal of Clinical Epidemiology. 2002;55(7):696–710. doi: 10.1016/s0895-4356(02)00399-2. [DOI] [PubMed] [Google Scholar]
- Karlamangla Arun S, Singer Burton H, Seeman Teresa E. Reduction in allostatic load in older adults is associated with lower all-cause mortality risk: MacArthur Studies of Successful Aging. Psychosomatic Medicine. 2006;68(3):500–507. doi: 10.1097/01.psy.0000221270.93985.82. [DOI] [PubMed] [Google Scholar]
- Katanoda Kota, Nitta Hiroshi, Hayashi Kunihiko, Matsumura Yasuhiro. Is the National Nutrition Survey in Japan representative of the entire Japanese population? Nutrition. 2005;21(9):964–966. doi: 10.1016/j.nut.2005.02.004. [DOI] [PubMed] [Google Scholar]
- Katanoda Kota, Matsumura Yasuhiro. National Nutrition Survey in Japan: Its methodological transition and current findings. Journal of Nutritional Science and Vitaminology. 2002;48(5):423–432. doi: 10.3177/jnsv.48.423. [DOI] [PubMed] [Google Scholar]
- Kim Jung Ki, Alley Dawn, Seeman Teresa, Karlamangla Arun, Crimmins Eileen. Recent changes in cardiovascular risk factors among women and men. Journal of Women's Health. 2006;15(6):734–746. doi: 10.1089/jwh.2006.15.734. [DOI] [PubMed] [Google Scholar]
- Kuriyama Shinichi, et al. Body mass index and mortality in Japan: The Miyagi Cohort Study. Journal of Epidemiology. 2004;14(Suppl 1):S33–S38. doi: 10.2188/jea.14.S33. [DOI] [PMC free article] [PubMed] [Google Scholar]
- Marmot Michael, Smith George Davey. Why are the Japanese living longer? British Medical Journal. 1989;299(6715):1547–1551. doi: 10.1136/bmj.299.6715.1547. [DOI] [PMC free article] [PubMed] [Google Scholar]
- McDade Thomas, Williams Sharon, Snodgrass Josh. What a drop can do: Dried blood spots as a minimally invasive method for integrating biomarkers into population-based research. Demography. 2007;44(4):899–925. doi: 10.1353/dem.2007.0038. [DOI] [PubMed] [Google Scholar]
- Ministry of Health, Labour and Welfare (Japan) Vital Statistics of Japan 2004. Japanese Government (in Japanese); 2006. Published by the. [Google Scholar]
- Mokdad Ali H, et al. Prevalence of obesity, diabetes, and obesity-related health risk factors, 2001. Journal of the American Medical Association. 2003;289(1):76–79. doi: 10.1001/jama.289.1.76. [DOI] [PubMed] [Google Scholar]
- Must Aviva, Spadano Jennifer, Coakley Eugenie H, Field Alison E, Colditz Graham, Dietz William H. The disease burden associated with overweight and obesity. Journal of the American Medical Association. 1999;282(16):1523–1529. doi: 10.1001/jama.282.16.1523. [DOI] [PubMed] [Google Scholar]
- National Heart, Lung, and Blood Institute. Obesity Education Initiative Expert Panel on the Identification, Evaluation, and Treatment of Overweight and Obesity in Adults. Clinical guidelines on the identification, evaluation, and treatment of overweight and obesity in adults: The evidence report. Obesity Research. 1998;8(Suppl 2):51–209. [PubMed] [Google Scholar]
- Ogden Cynthia L, Fryar Cheryl D, Carroll Margaret D, Flegal Katherine M. Mean body weight, height, and body mass index, United States 1960–2002. Centers for Disease Control: Advance Data from Vital and Health Statistics. 2004;347:1–18. [PubMed] [Google Scholar]
- Okamura Tomonori, et al. Lower levels of serum albumin and total cholesterol associated with decline in activities of daily living and excess mortality in a 12-year cohort study of elderly Japanese. Journal of the American Geriatric Society. 2008;56(3):529–535. doi: 10.1111/j.1532-5415.2007.01549.x. [DOI] [PubMed] [Google Scholar]
- Pi-Sunyer F Xavier. Medical hazards of obesity. Annals of Internal Medicine. 1993;119(7):655–660. doi: 10.7326/0003-4819-119-7_part_2-199310011-00006. [DOI] [PubMed] [Google Scholar]
- Population Reference Bureau. Life Expectancy at Birth, Both Sexes (years) [11 March 2008]; at « http://www.prb.org/Datafinder/Topic/Rankings.aspx?sort=r&order=a&variable=13».
- Reuben David B, et al. The prognostic value of serum albumin in healthy older persons with low and high serum interleukin-6 (IL-6) levels. Journal of the American Geriatric Society. 2000;48(11):1404–1407. doi: 10.1111/j.1532-5415.2000.tb02629.x. [DOI] [PubMed] [Google Scholar]
- Reuben David B, et al. Peripheral blood markers of inflammation predict mortality and functional decline in high-functioning community-dwelling older persons. Journal of the American Geriatric Society. 2002;50(4):638–644. doi: 10.1046/j.1532-5415.2002.50157.x. [DOI] [PubMed] [Google Scholar]
- Reynolds Sandra, Hagedorn Aaron, Yeom Jihye, Saito Yasuhiko, Yokoyama Eise, Crimmins Eileen M. A tale of two countries—the United States and Japan: Are differences in health due to differences in overweight? Journal of Epidemiology. 2008 doi: 10.2188/jea.JE2008012. Forthcoming. [DOI] [PMC free article] [PubMed] [Google Scholar]
- Rohlfing Curt L, et al. Use of GHb (HbA1c) in screening for undiagnosed diabetes in the U.S. population. Diabetes Care. 2000;23(2):187–191. doi: 10.2337/diacare.23.2.187. [DOI] [PubMed] [Google Scholar]
- Sarti Cinzia, Rastenyte Daiva, Cepaitis Zygimantas, Tuomilehto Jaakko. International trends in mortality from stroke, 1968 to 1994. Stroke. 2000;31(7):1588–1601. doi: 10.1161/01.str.31.7.1588. [DOI] [PubMed] [Google Scholar]
- Seeman Teresa E, et al. Cumulative biological risk and socio-economic differences in mortality: MacArthur Studies of Successful Aging. Social Science and Medicine. 2004a;58(10):1985–1997. doi: 10.1016/S0277-9536(03)00402-7. [DOI] [PubMed] [Google Scholar]
- Seeman Teresa, Glei Dana, Goldman Noreen, Weinstein Maxine, Singer Burton, Lin Yu Hsuan. Social relationships and allostatic load in Taiwanese elderly and near elderly. Social Science and Medicine. 2004b;59(11):2245–2257. doi: 10.1016/j.socscimed.2004.03.027. [DOI] [PubMed] [Google Scholar]
- Seeman Teresa E, McEwen Bruce S, Rowe John W, Singer Burton H. Allostatic load as a marker of cumulative biological risk: MacArthur Studies of Successful Aging. Proceedings of the National Academy of Sciences USA. 2001;98(8):4770–4775. doi: 10.1073/pnas.081072698. [DOI] [PMC free article] [PubMed] [Google Scholar]
- Seeman Teresa E, Singer Burton H, Rowe John W, Horwitz Ralph I, McEwen Bruce S. Price of adaptation—allostatic load and its health consequences: MacArthur Studies of Successful Aging. Archives of Internal Medicine. 1997;157(19):2259–2268. [PubMed] [Google Scholar]
- Sekikawa Akira, Hayakawa Takehito. Prevalence of hypertension, its awareness and control in adult population in Japan. Journal of Human Hypertension. 2004;18(12):911–912. doi: 10.1038/sj.jhh.1001765. [DOI] [PMC free article] [PubMed] [Google Scholar]
- Seplaki Christopher L, Goldman Noreen, Weinstein Maxine, Lin Yu Hsuan. How are biomarkers related to physical and mental well-being? Journal of Gerontology Series A: Biological Sciences and Medical Sciences. 2004;59(3):201–217. doi: 10.1093/gerona/59.3.b201. [DOI] [PubMed] [Google Scholar]
- Singer Burton H, Ryff Carol D, Seeman Teresa E. Operationalizing allostatic load. In: Schulkin J, editor. Allostasis, Homeostasis, and the Costs of Physiological Adaptation. Cambridge: Cambridge University Press; 2004. pp. 113–149. [Google Scholar]
- Ueshima Hirotsugu. Changes in dietary habits, cardiovascular risk factors and mortality in Japan. Acta Cardiologica. 1990;45(6):475–477. [PubMed] [Google Scholar]
- Ueshima Hirotsugu. Explanation for the Japanese paradox: Prevention of increase in coronary heart disease and reduction in stroke. Journal of Atherosclerosis and Thrombosis. 2007;14(6):278–286. doi: 10.5551/jat.e529. [DOI] [PubMed] [Google Scholar]
- Ueshima Hirotsugu, Tatara Kozo, Asakura Shintaro. Declining mortality from ischemic heart disease and changes in coronary risk factors in Japan, 1956–1980. American Journal of Epidemiology. 1987;125(1):62–72. doi: 10.1093/oxfordjournals.aje.a114512. [DOI] [PubMed] [Google Scholar]
- US National Center for Health Statistics. National Vital Statistics Reports. 2008 April56 no. 10. [Google Scholar]
- Verschuren W M Monique, et al. Serum total cholesterol and long-term coronary heart disease mortality in different cultures. Journal of the American Medical Association. 1995;274(2):131–136. [PubMed] [Google Scholar]
- WHO Expert Consultation Appropriate body-mass index for Asian populations and its implications for policy and intervention strategies. Lancet. 2004;363(9403):157–163. doi: 10.1016/S0140-6736(03)15268-3. [DOI] [PubMed] [Google Scholar]
- Wise David A, Yashiro Naohiro. Healthcare Issues in the United States and Japan. Chicago: University of Chicago Press; 2006. [Google Scholar]
- Wolf-Maier Katharina, et al. Hypertension prevalence and blood pressure levels in 6 European countries, Canada, and the United States. Journal of the American Medical Association. 2003;289(18):2363–2369. doi: 10.1001/jama.289.18.2363. [DOI] [PubMed] [Google Scholar]
- World Health Organization. Life Tables for WHO Member States. [15 September 2007];2005 at « http://www.who.int/whosis/database/life_tables/life_tables.cfm».
- Yoshiike Nobuo, et al. Twenty-year changes in the prevalence of overweight in Japanese adults: The National Nutrition Survey 1976–95. Obesity Reviews. 2002;3(3):183–190. doi: 10.1046/j.1467-789x.2002.00070.x. [DOI] [PubMed] [Google Scholar]
- Yoshiike Nobuo, Matsumura Yasuhiro, Zaman M Mostafa, Yamaguchi Momoko. Descriptive epidemiology of body mass index in Japanese adults in a representative sample from the National Nutrition Survey 1990–1994. International Journal of Obesity. 1998;22(7):684–687. doi: 10.1038/sj.ijo.0800651. [DOI] [PubMed] [Google Scholar]
- Zethelius Björn, et al. Use of multiple biomarkers to improve the prediction of death from cardiovascular causes. New England Journal of Medicine. 2008;358(20):2107–2016. doi: 10.1056/NEJMoa0707064. [DOI] [PubMed] [Google Scholar]


