

Abstract
Evaluation of arterial baroreflex in cardiovascular control is an important topic in cardiology and clinical medicine. In this paper, we present a point process approach to estimate the dynamic baroreflex gain in a closed-loop model of the cardiovascular system. Specifically, the inverse Gaussian probability distribution is used to model the heartbeat interval, whereas the instantaneous mean is modulated by a bivariate autoregressive model that contains the previous R-R intervals and systolic blood pressure (SBP) measures. The instantaneous baroreflex gain is estimated in the feedback loop with a point process filter, while the RR→SBP feedforward frequency response gain can be estimated by a Kalman filter. The proposed estimation approach provides a quantitative assessment of interacting heartbeat dynamics and hemodynamics. We validate our approach with real physiological signals and evaluate the proposed model with established goodness-of-fit tests.
1. Introduction
Sudden changes in arterial blood pressure (ABP) induce a baroreceptor-cardiac reflex (baroreflex) that evokes an inverse change in heart rate (HR). Hence, a measure of baroreflex gain is essential in characterizing cardiovascular control and explaining both heartbeat dynamics and hemodynamics [1,2]. Since the cardiovascular system has a closed-loop interactions between many variables including R-R interval and ABP, research efforts have been devoted to estimating the baroreflex gain with a closed-loop system identification approach, which yields a more accurate assessment compared to open-loop approaches [3].
In our previous work [4-8], we have successfully applied probabilistic point process models for estimating instantaneous measures of HR, HR variability (HRV), as well as respiratory sinus arrhythmia (RSA). The point process framework enabled us to estimate these physiological indices in a dynamic fashion with a fine timescale. This paper expands on the point process approach to model the heartbeat interval, allowing for a dynamical assessment of the baroreflex gain in the feedback loop. In the meanwhile, we also model the feedforward cardiovascular loop and use a Kalman filter to track the parameters for estimating the RR→SBP frequency response. We demonstrate our proposed method with some physiological recordings and present some discussions in cardiovascular control.
2. Heartbeat interval point process model
Given a set of R-wave events detected from the electrocardiogram (ECG), let RRj=uj− uj−1 > 0 denote the jth R-R interval. By treating the R-waves as discrete events, we may develop a probabilistic point process model in the continuous-time domain. Assuming history dependence, the waiting time t − ut (as a continuous random variable) until the next R-wave event can be modeled by an inverse Gaussian model [4]:
where ut denotes the previous R-wave event occurred before time t, θ > 0 denotes the shape parameter, and μt ≡ μRR (t) denotes the instantaneous R-R mean that can be modeled by a time-varying linear predictive model:
| (1) |
where the first two terms represent a linear autoregressive (AR) model of the past R-R intervals, and SBPt−j denotes the previous jth SBP value prior to time t.
2.1. Instantaneous indices of HR and HRV
Heart rate is defined as the reciprocal of the R-R intervals. For RR measured in seconds, r = c(t−ut)−1 (where c = 60 s/min) is a physiological measurement in beats per minute (bpm). By the change-of-variables formula, the HR probability is given by , and the mean and the standard deviation of heart rate r can be derived [4,5]
| (2) |
where μ̀ = c−1 μRR and θ͂ = c−1θ. Essentially, the instantaneous indices of HR and HRV are characterized by the mean μHR and standard deviation σHR, respectively.
It is known from the point process theory that the conditional intensity function (CIF) λ(t) is related to the inter-event probability p(t) by a one-to-one transformation [9]: . The estimated CIF can be used to evaluate the goodness-of-fit of the probabilistic model for the heartbeat dynamics. In addition, the quantity λ(t)Δ yields approximately the probability of observing a beat during the [t,t+Δ] interval.
2.2. Adaptive point process filtering
Let denote the vector that contains all unknown parameters in the probabilistic model, we can recursively estimate them via adaptive point process filtering [5]:
where P and W denote the parameter and noise covariance matrices, respectively; Δ =5 ms denotes the time bin size; and denotes the first- and second-order partial derivatives of the CIF w.r.t. ξ at time t = kΔ, respectively. The indicator variable nk = 1 if a heart beat occurs in time ((k−1)Δ, kΔ] and 0 otherwise.
2.3. Closed-loop cardiovascular control
Baroreflex gain (SBP→RR loop)
First, we aim to model and assess the SBP→RR feedback loop, which is directly related to heart rate baroreflex. Among many methods, baroreflex gain has been estimated based on the coherence between heart rate and blood pressure [10]; alternatively, it has been estimated by a closed-loop bivariate AR model [3]. However, all of these approaches are batch-based with the assumption that the signals are stationary or locally stationary (within a moving window). Consequently, these approaches cannot fully capture the dynamic (non-stationary) nature of the physiological signals due to the drastic cardiovascular control compensatory changes. In contrast, our point process approach offers a way to estimate the instantaneous barorefex gain and to assess the heartbeat dynamics with a fine timescale.
Specifically, in light of (1) we can compute the frequency response for the baroreflex (SBP→RR loop)
| (3) |
where f1 and f2 denote the rate for the R-R and SBP intervals, respectively; here we assume f1 ≈ f2 ≡ f. With the estimated time-varying AR coefficients ai (k) and bj (k) at time t = kΔ, we may evaluate the dynamic baroreflex gain (amplitude) and autospectrum in the frequency domain at different ranges (VLF, 0.01-0.05 Hz; LF, 0.05-0.15 Hz; HF, 0.15-0.5 Hz). The baroreflex gain, characterized by H12 (f), represents the effect of SBP on heart beat, mediated by the neural autonomic reflex.
Modeling RR→SBP feedforward loop
Simultaneous to baroreflex assessment, we aim to model the RR→SBP feedforward loop, which enables us to study quantitatively the hemodynamics and to evaluate the impact of heartbeat on the arterial blood pressure. Similarly, SBP is modeled by a bivariate AR model:
where μRR (k−i) represents the estimated instantaneous R-R mean value at the time when SBP-events occur. The coefficients and will be dynamically tracked by a Kalman filter [11]. Unlike the point process filter, the update occurs only at the time of SBP-events. Similarly, we can also estimate the frequency response of the RR→SBP cardiovascular loop:
| (4) |
where f denotes the sampling rate (beat/sample) for SBP-SBP intervals. Likewise, we can estimate the dynamic gain and phase of H21 (f) at each single SBP-event.
2.2. Goodness-of-fit tests
The goodness-of-fit of the probabilistic model is based on the Kolmogorov-Smirnov (KS) test [9]. Given a point process specified by J discrete events: 0 < u1 < ··· < uj < T, compute . If the model is correct, then the variables vj = 1−exp(−zj) are independent, uniformly distributed within the range [0, 1], and gj = Φ−1(vj) (where Φ(‵) denotes the cumulative density function (cdf) of the standard Gaussian distribution) are independent standard Gaussian random variables. To compute the KS test, the vj s are sorted from the smallest to largest value, and plotted against the cdf of the uniform density defined as . Ideally, the points should lie on the 45° line, and the 95% confidence interval lines are . The KS distance, defined as the maximum distance between the KS plot and the 45° line, is used to measure the lack-of-fit between the model and the data. We also compute the autocorrelation function of gjs: . If the gjs are independent, ACF (m) shall be small (around 0 and within the 95% confidence interval ) for all values of m.
3. Experimental Results
The first heartbeat data set, which was retrieved from Phyisonet (http://www.physionet.org/) [12], consists of multi-parameters including ECG traces, arterial pressure recorded from patients in critical care units (from MGH/MF Waveform Database). Due to space limit, we randomly selected segments of recordings from one subject who had artifact-free calibrated R-R series and arterial pressure measurements. Figure 1 illustrates the signals as well as their power spectra and coherence (magnitude and phase). As seen from the figure, the R-R and SBP signals appear more coherent in the VLF and LF ranges.
Figure 1.
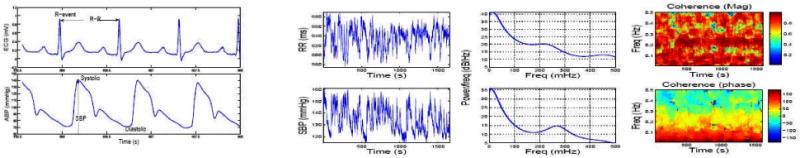
1st column: A snapshot of ECG and ABP signals (systolic and diastolic pressures are measured at the time of ventricular contraction and relaxation, respectively). 2nd column: 20-min recordings of R-R and SBP time series. 3rd column: Parametric AR(8) autospectra. 4th column: Coherence magnitude and phase
The initial parameters are estimated from the first 2-min recordings of the R-R and SBP beat series. Parameters , and are estimated by a bivariate AR model assuming a closed-loop system [3], whereas the shape parameter is estimated by θ = μ3/σ2 from the R-R series. Order selection of the bivariate AR was selected based on the Akaike information criterion (AIC). Order p=8 was used in the current experiment.
For the selected subject, we estimate the instantaneous HR and HRV statistics (Fig. 2), the dynamic baroreflex gain and phase, as well as the mean gains of the frequency responses in both feedback and feedforward loops (Fig. 3). To evaluate the model fit, we examine the resultant KS plot and autocorrelation plot (Fig. 4). The fact that the curves fall almost within the 95% confidence bounds indicates a good fit of the model to the heartbeat events. As a comparison, we also conducted an experiment that does not consider SBP in the point process model and repeated the KS test. The KS distance was found to be 0.092. Therefore, the inclusion of SBP as covariate helps improve the model fit for the data. This result is not surprising considering that in the closed-loop cardiovasular system, heartbeat and blood pressure/volume are directly (or indirectly through other factors) influenced by each other. In addition, the correlation coefficients between the mean baroreflex gain (LF) and μRR (t) and μHR (t) are 0.837 and -0.843, respectively, suggesting that in this case fast dynamic changes of the baroreflex gain reflect reverse changes in HR.
Figure 2.
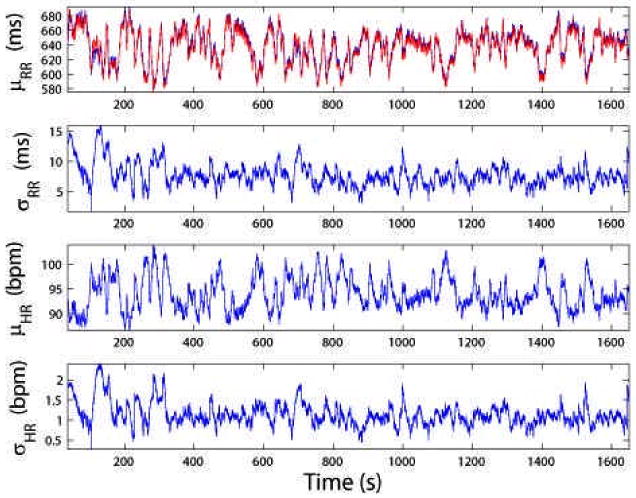
From top to bottom: instantaneous estimates of μRR (superimposed by red trace of R-R time series), σRR, μHR and σHR statistics (MGH/MF database subject 007)
Figure 3.
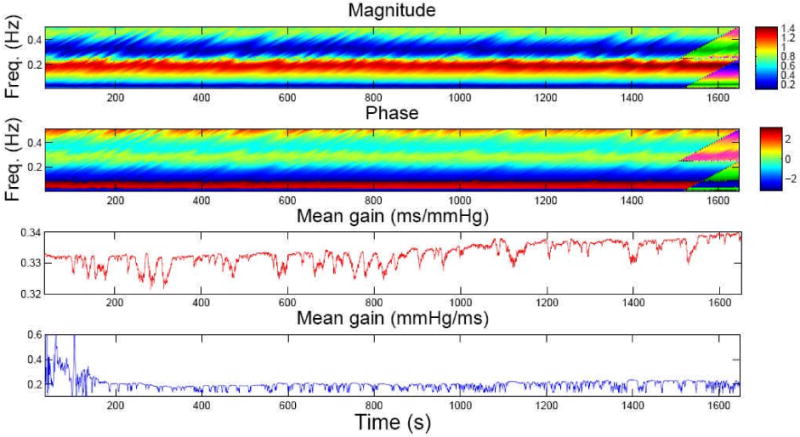
Top two panels: Image visualization of dynamic baroreflex gain and phase (within 0.01-0.5 Hz). Bottom two panels: tracking the mean baroreflex gain (red) and the mean gain of RR→SBP frequency response (blue)
Figure 4.
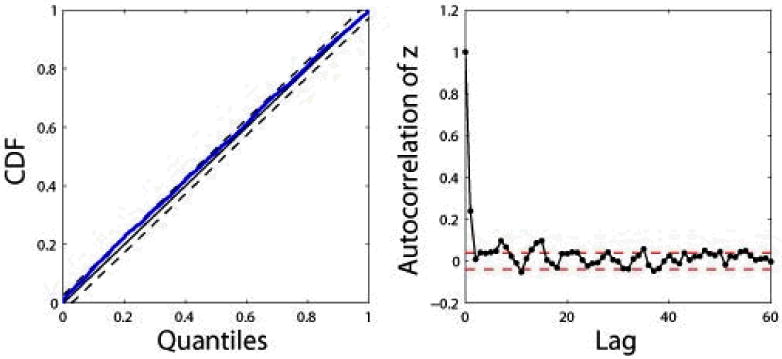
KS plot (KS dist. 0.052) and autocorrelation plot (dashed lines indicate the 95% confidence bounds)
Next, we analyzed a previously studied heartbeat data set (details of the “tilt-table” protocol were given in [4]). For demonstration purpose, in Fig. 5 we plot eight epochs of R-R and SBP recordings when a subject underwent a few cycles of “rest” and “tilt” posture conditions. The instantaneous HR, HRV, and baroreflex gain indices are estimated from the complete time courses (Fig. 5) and then divided into two groups (rest vs. tilt) for statistical comparison. Furthermore, a rank-sum test was applied to evaluate the null hypothesis that the medians of the rest and tilt conditions are equal. The null hypothesis is tested with 95% confidence (P<0.05). As a comparison, the open-loop baroreflex gain (denoted as ) was also computed for each epoch with a standard batch spectral estimation method [10]. As seen in Table 1, the open-loop method tends to overestimate the baroreflex gain (in both LF and HF). Similar results were also found in other subjects (not shown here).
Figure 5.
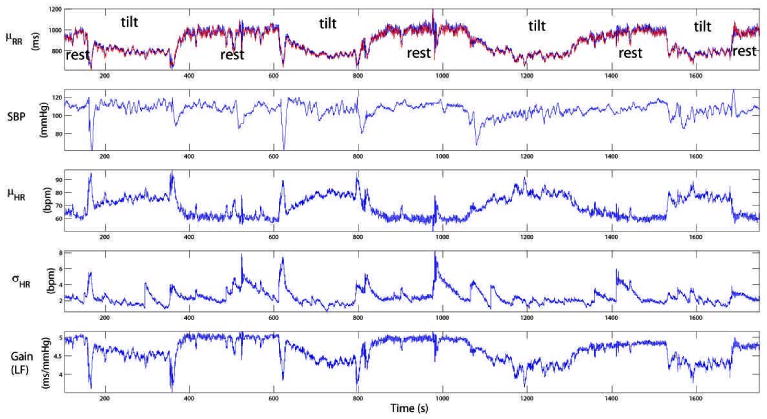
Dynamic tracking of the baroreflex gain in a rest-tilt study
Table I. Comparison of statistical indices between the rest and tilt conditions (in one subject). The baroreflex gains (ms/mmHg) listed here are computed within the LF range.
| RR (ms) | SBP (mmHg) | HRV (bpm) | |H12 (f)| | |||
|---|---|---|---|---|---|---|
| rest | 965±47 | 108.9±4.7 | 2.70±0.87 | 4.91±0.12 | 12.8 ±1.5 | |
| tilt | 773±36 | 105.2±6.4 | 1.96±0.56 | 4.37±0.19 | 5.9±0.9 | |
| P-value | < le-8 | < le-8 | <le-8 | <le-8 | 0.02 |
4. Conclusion
We propose a point process framework to capture the transient dynamics of HR and HRV, and to model the dynamic nature of the baroreflex frequency response in a non-stationary environment.
Our results confirm that the closed-loop identification approach is a more appropriate framework for modeling cardiovascular control dynamics, and that the open-loop approach leads to overestimation of the baroreflex gain. In addition, the instantaneous estimation of baroreflex frequency response produces a dynamic assessment at a fine timescale. Currently, our model is restricted in using only the SBP events. A possible inclusion of the diastolic events, or even the continuous ABP traces, will be the subject of our future investigation. Consideration of continuous-time ABP as covariate could reveal a more accurate description of the complex dependency between heartbeat dynamics and hemodynamics.
To conclude, statistical modeling of the feedforward and feedback loops in cardiovascular control could shed important insights into a large majority of cardiovascular diseases and disorders (e.g., hypertension and congestive heart failure) related to systemic hemodynamic dysfunction. Furthermore, the instantaneous point process indices of HR, HRV, and baroreflex gain can provide a potential real-time noninvasive assessment for ambulatory monitoring in clinical practice.
Acknowledgments
This work was supported by National Institutes of Health (NIH) Grants R01-HL084502, R01-DA015644 and R01-MH59733. We thank Roger G. Mark and Thomas Heldt (MIT) for sharing the tilt-table data in this study.
References
- 1.Bertinieri G, Di Rienzo M, Cavallazzi A, et al. Evaluation of baroreceptor reflex by blood pressure monitoring in unanesthetized cats. Am J Physiol. 1988;254:H377–H383. doi: 10.1152/ajpheart.1988.254.2.H377. [DOI] [PubMed] [Google Scholar]
- 2.Eckberg DL. Arterial baroreflexes and cardiovascular modeling. Cardiovasc Eng. 2008;8:5–13. doi: 10.1007/s10558-007-9042-8. [DOI] [PubMed] [Google Scholar]
- 3.Barbieri R, Parati G, Saul JP. Closed- versus open-loop assessment of heart rate baroreflex. IEEE Eng Med Biol. 2001;20(2):33–42. doi: 10.1109/51.917722. [DOI] [PubMed] [Google Scholar]
- 4.Barbieri R, Matten EC, Alabi AA, Brown EN. A point process model of human heart rate intervals: new definitions of heart rateand heart rate variability. Am J Physio. 2005;288:H424–435. doi: 10.1152/ajpheart.00482.2003. [DOI] [PubMed] [Google Scholar]
- 5.Barbieri R, Brown EN. Analysis of heart dynamics by point process adaptive filtering. IEEE Trans Biomed Eng. 2006;53(1):4–12. doi: 10.1109/tbme.2005.859779. [DOI] [PubMed] [Google Scholar]
- 6.Chen Z, Brown EN, Barbieri R. A study of probabilistic models for characterizing human heart beat dynamics in autonomous blockadecontrol. Proc IEEE ICASSP 2008; IEEE Press; 2008. pp. 481–484. [DOI] [PMC free article] [PubMed] [Google Scholar]
- 7.Chen Z, Brown EN, Barbieri R. Assessment of autonomic control and respiratory sinus arrhythmia using point process models of humanheart beat dynamics. IEEE Trans Biomed Eng. doi: 10.1109/TBME.2009.2016349. submitted. [DOI] [PMC free article] [PubMed] [Google Scholar]
- 8.Chen Z, Brown EN, Barbieri R. Characterizing nonlinear heartbeat ynamics within a point process framework. Proc IEEE EMBC 2008; IEEE Press; 2008. pp. 2781–2784. [DOI] [PMC free article] [PubMed] [Google Scholar]
- 9.Brown EN, Barbieri R, Eden UT, Frank LM. Likelihood methods for neural data analysis. In: Feng J, editor. Computational Neuroscience:A Comprehensive Approach. CRC Press; 2003. pp. 253–286. [Google Scholar]
- 10.Clayton RH, Bowman AJ, Murray A. Measurement of baroreflex gain from heart rate and blood pressure spectra: a comparison ofspectral estimation techniques. Physiol Meas. 1995;16:131–139. doi: 10.1088/0967-3334/16/2/005. [DOI] [PubMed] [Google Scholar]
- 11.Haykin S. Adaptive Filter Theory. 4th. Prentice Hall; 2002. [Google Scholar]
- 12.Goldberger AL, Amaral LAN, et al. PhysioBank, PhysioToolkit, and PhysioNet: Components of a new research resource for complex physiologic signals. Circulation. 2000;101(23):e215–e220. doi: 10.1161/01.cir.101.23.e215. [DOI] [PubMed] [Google Scholar]