Abstract
Just-noticeable differences of physical parameters are often limited by the resolution of the peripheral sensory apparatus. Thus, two-point discrimination in vision is limited by the size of individual photoreceptors. Frequency selectivity is a basic property of neurons in the mammalian auditory pathway1,2. However, just-noticeable differences of frequency are substantially smaller than the bandwidth of the peripheral sensors3. Here we report that frequency tuning in single neurons recorded from human auditory cortex in response to random-chord stimuli is far narrower than that typically described in any other mammalian species (besides bats), and substantially exceeds that attributed to the human auditory periphery. Interestingly, simple spectral filter models failed to predict the neuronal responses to natural stimuli, including speech and music. Thus, natural sounds engage additional processing mechanisms beyond the exquisite frequency tuning probed by the random-chord stimuli.
Sounds are decomposed to different frequency bands by the auditory periphery. Tonotopic (‘by frequency’) organization is kept throughout the auditory pathway, at least up to and including primary auditory cortex. In vision and somatosensation, the resolution of the peripheral sensors to a large degree determines overall behavioural discrimination capabilities. However, in the auditory system, frequency just-noticeable differences in well-trained subjects may be 30 times smaller than the presumed bandwidth of the peripheral filters (‘critical bands’, typically about a sixth of an octave in humans, as measured in psychoacoustical tests). Electrophysiological correlates of critical bands have been suggested4–6, and frequency just-noticeable differences can be derived by integrating information over a large population of neurons7, but there are currently no reports of a significant population of single neurons the bandwidth of which corresponds to the behavioural just-noticeable differences. Does the high-frequency resolution expressed behaviourally have explicit neural representation? If so, can high-frequency resolution explain the response patterns to complex sounds?
Responses of neurons in human auditory cortex were recorded from four patients with intractable epilepsy monitored with intracranial depth electrodes to identify seizure foci for potential surgical treatment8. Using clinical criteria, electrodes were implanted bilaterally in the transverse gyri of Heschl, loci of the auditory cortex (see Methods). Patients were presented with artificial random-chord stimuli at a resolution of six tones per octave (two patients) or 18 tones per octave (one patient), and with segments from the popular English-speaking western film “The Good, the Bad and the Ugly” (three patients, see Methods). Thus, for many neurons, the stimulus ensemble included both artificial stimuli and more structured stimuli. The artificial stimuli were designed to sample evenly the spectral range of the movie soundtrack. Results are based on 95 units recorded in four patients.
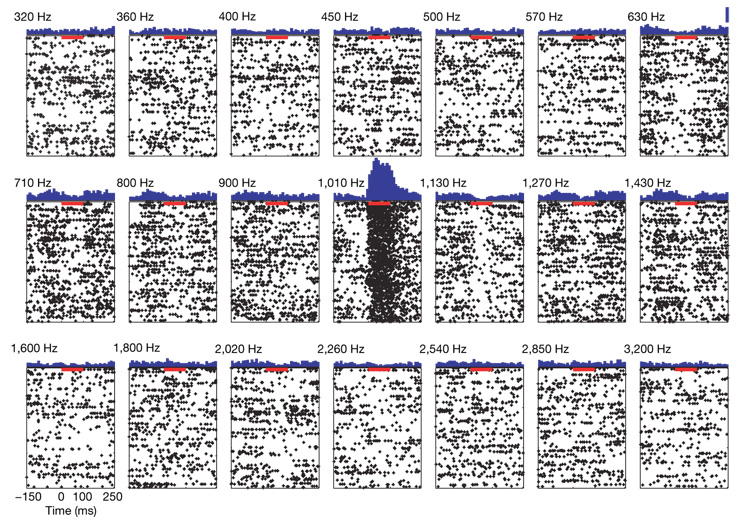
Figure 1 displays raster responses of one unit to the different frequencies in the six-tones-per-octave random-chord stimulus. Each frequency appeared simultaneously with two other frequencies selected essentially randomly. Only one of the 41 possible frequencies elicited excitatory responses in this unit. Furthermore, when a tone burst of that frequency appeared in the stimulus, a sustained response outlasting tone duration was elicited with high reliability. The lack of excitatory response to the two adjacent frequencies implies that this unit was more selective than the frequency resolution of the stimulus (six tones per octave).
Figure 1. Response selectivity.
Raster plots of responses of one unit to chords containing the frequency specified above each panel (270 repetitions in each panel) and peristimulus time histograms (PSTH, blue; bin width 10 ms) based on these raster plots (the scale line at the top right PSTH corresponds to a firing rate of 16 spikes per second; maximum firing rate at, preferred frequency: 47 spikes per second). Red bars mark 100 ms (duration of one chord) from the beginning of the response to the preferred frequency. The frequency table contained 20 additional frequencies (below 320 Hz and above 3,200 Hz); no other frequency elicited significant responses.
Of 31 units from the two patients presented with the six-tones-per-octave random-chord stimulus, 27 had a narrow, well-circumscribed frequency response area. About half (14/31) showed reliable responses to tone bursts at a single frequency, with no consistent excitatory response to any other frequency. Thirteen units responded to two to three adjacent frequencies. The rest (4/31) exhibited more complex responses. The resolution of six tones per octave was thus too coarse directly to measure the spectral bandwidth of most units.
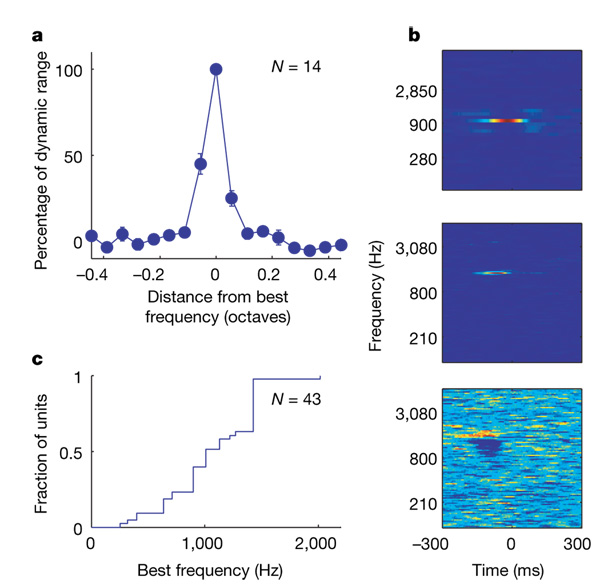
A high-resolution random-chord stimulus with 18tones per octave was presented to a third patient. Of 16 units recorded in this patient, 14 exhibited a highly elevated firing rate in response to a single frequency, with additional weaker, although significant, responses to only one or two adjacent frequencies. The average bandwidth of these units can be conservatively estimated at about a twelfth of an octave, in agreement with the results presented above (Fig. 2a). Figure 2b displays typical spectro-temporal receptive fields (called ‘artificial STRFs’ below) derived from responses to the random-chord stimuli by spike-triggered averaging. The best frequencies, defined as the frequency that elicited maximal response, ranged from 250 to 2kHz in this population (Fig. 2c). It is generally accepted that the frequency tuning curve of the auditory periphery in humans has a width of about a sixth of an octave3. Therefore, when presented with random chords, the great majority of auditory cortical neurons showed substantially better frequency selectivity than the auditory nerve.
Figure 2. Frequency tuning in the responses to the random-chord stimulus.
a, Mean tuning curve (see Methods). Error bars indicate s.e.m. b, STRFs of three units estimated from the responses to the random-chord stimulus. The top panel shows a unit tested with six-tones-per-octave resolution that responded to a single frequency (colour scale saturation: 2.5–39 spikes per second). The middle panel shows a unit tested with 18-tones-per-octave resolution that responded predominantly to a single frequency (colour scale saturation: 1–32 spikes per second). The bottom panel shows a unit with complex tuning (colour scale saturation: 0–3.4 spikes per second). c, Cumulative distribution of the best frequencies of 43 units with a clear excitatory peak.
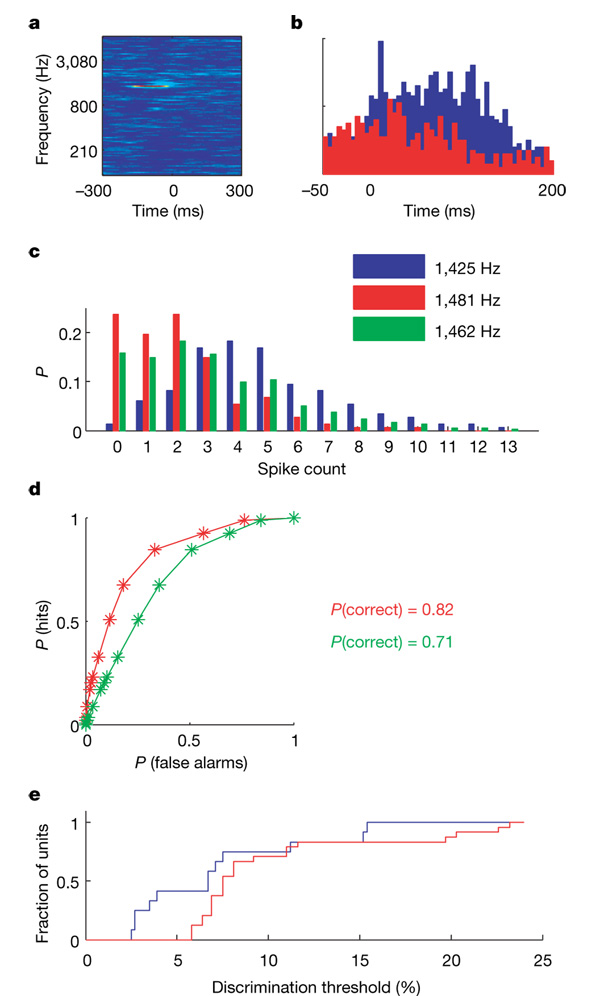
The frequency discrimination performance based on responses in single trials was estimated using receiver operating characteristic (ROC) analysis. We compared the empirical spike count distributions elicited by the different frequencies and determined the lowest discrimination threshold for each of the 47 units tested with the random-chord stimuli. Performance was quantified by the probability of correct decision in a two-interval, two-alternative forced choice test. Discrimination threshold was set at 70.7%, as typically done in auditory psychophysics. In more than 60% of the excitatory cells (25/42) discrimination was above threshold for the smallest possible frequency difference tested, the spectral resolution of the stimulus (20/27 units tested with six tones per octave and 5/15 units tested with 18 tones per octave; see for example Fig. 3).
Figure 3. Frequency discrimination based on single-trial responses.
a, STRF of an excitatory unit estimated from the responses to the high-resolution random-chord stimulus (colour scale saturation: 6–36 spikes per second).b, PSTHs (bin width: 5 ms); blue is the response to the best frequency and red is the response to the adjacent frequency. The ordinate represents firing rate, scale: 0–40 spikes per second. c, Empirical spike count distributions of best-frequency responses (blue), of the responses to the adjacent frequency (red) and an estimated distribution of responses to an intermediate frequency (green). The ordinate represents the probability P of observing each spike count. d, ROC curves generated from pairs of distributions in c. Red: 1,425 and 1,481 Hz (interval: 3.9%). Green: 1,425 and 1,461 Hz (interval: 2.5%). e, Cumulative distribution of just-noticeable differences for units tested with random-chord stimuli at six tones per octave (red, N = 27) and 18 tones per octave (blue, N = 15).
For these units, we linearly interpolated spike count distributions to simulate possible distributions at intermediate frequencies that were not actually tested (see Methods). Thresholds were again estimated by the smallest frequency interval that could be discriminated using these intermediate distributions. These thresholds are under estimates because maximum slopes of frequency response curves are bounded from below by linear interpolation. Even so, this procedure revealed units that had discrimination thresholds that matched and even exceeded the behavioural performance of naive human subjects9(Fig. 3e).
Do units also respond as narrow spectral filters when presented with natural sounds? We analysed responses elicited by nine-minute clips from the soundtrack of the feature film “The Good, the Bad and the Ugly”, shown twice in each recording session. The soundtrack contained approximately equal-duration segments of dialogue, music and background noise. The average firing rate was not significantly different between responses to the random-chord stimuli and responses to the soundtrack (paired t-test, t = 1.04, degrees of freedom d.f. 5 13, not significant), suggesting the soundtrack was, on average, as successful as random chords in driving neuronal responses, with comparable reproducibility (see Supplementary Information).
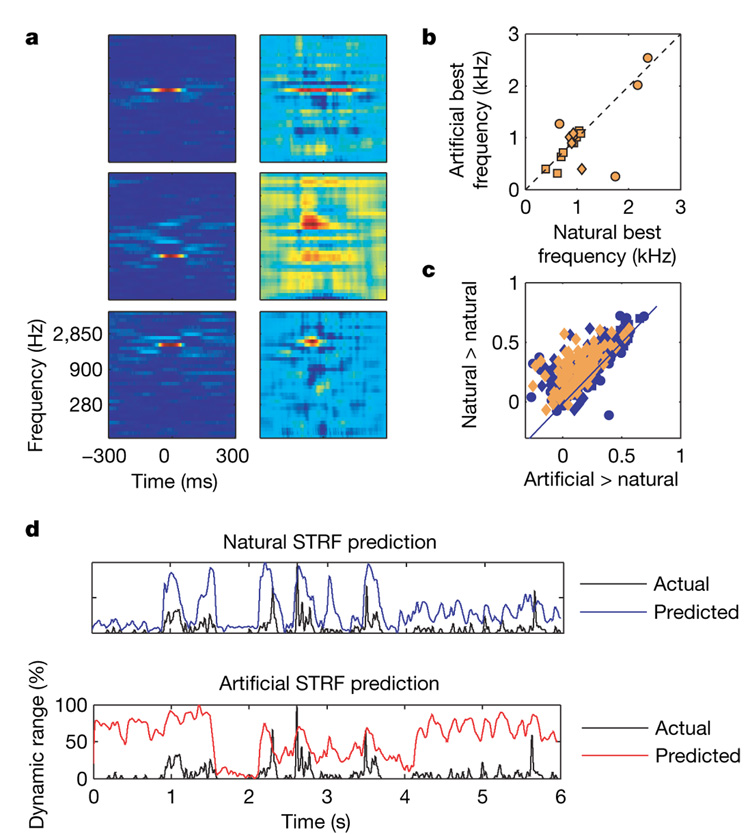
We estimated STRFs from responses to the soundtrack (called ‘natural STRFs’ below) using generalized reverse correlation techniques following ref. 10. The exquisite spectral filtering clearly apparent in the artificial STRFs was partially lost—natural STRFs were noisier and appeared to have richer structure (Fig. 4a). Nevertheless, there were similarities between natural and artificial STRFs estimated for the same unit. For the units recorded with both stimuli, the best frequency of the artificial STRF and the best frequency of the natural STRFs were highly correlated (r=0.7, d.f.=16, P ≪ 0.01; Fig. 4b). This agrees with the general finding that the best frequency is largely independent of auditory context11.
Figure 4. Natural versus artificial responses.
a, STRFs of three units based on responses to the random-chord stimulus (left) and to the soundtrack (right). b, Best frequency of artificial STRFs versus best frequency of natural STRFs (N =16). c, Correlations between predictions and actual responses to one-minute segments from the soundtrack. Abscissa: using artificial STRFs (orange, 14 units) or synthetic STRFs (blue, 31 units). Ordinate: using natural STRFs. d, Predictions and response to one minute of the soundtrack by natural (top) and artificial (bottom) STRFs: 121 ms hamming window. Correlation coefficients are 0.46 and 0.18, respectively.
The first- and second-order statistics characterizing the soundtrack were fully sampled by the random-chord stimuli (verified by comparing the joint distribution of spectral and temporal modulations in the two stimulus ensembles) and the calculation of the natural STRFs corrected for second-order correlations in the stimulus10. Thus, if neurons linearly integrate their spectro-temporal input, natural and artificial STRFs should be essentially equivalent. However, the soundtrack also contained higher-order spectral correlations the effects of which on the STRFs could become apparent if the neurons had significant nonlinearities. These effects could be the reason for the additional structure in the natural STRFs.
We addressed this by comparing the predictive power of the STRFs within and across context (random-chord stimuli or film soundtrack). If artificial STRFs predict responses to the soundtrack as well as (or better than) natural STRFs, or vice versa, we can conclude that the potential nonlinear mechanisms that are not captured by the STRFs have only a small effect on the neuronal responses. Alternatively, if each STRF predicts the responses to new sounds from the ensemble used to estimate the STRF better than does the STRF derived from the other sound ensemble, then it can be inferred that there are significant nonlinearities in the responses, with the natural sounds possibly engaging processing mechanisms different from those engaged by the artificial sounds.
For units recorded with both stimuli, predicted responses to one-minute segments of the soundtrack were generated with both artificial and natural STRFs (the natural STRF was estimated without using the responses to the segment whose responses were predicted). Predictive power was quantified by the correlation coefficient between the prediction and the actual response of the unit. The expected maximum correlation (estimated as the average correlation between responses to two presentations of the soundtrack) was 0.3 (ref. 12). The predictive power of the artificial STRFs on the soundtrack was notably low: 0.136 ± 0.14 (mean ± s.d.), about 40% of the expected maximum. More importantly, correlations were significantly higher within context: a natural STRF typically predicted the actual responses to a soundtrack segment better than did an artificial STRF, with an average correlation coefficient of 0.25 ± 0.14 (Fig. 4c), over 80%of the expected maximum correlation. A three-way analysis of variance (ANOVA) on STRF type x predicted segment x neuron showed a highly significant main effect of STRF type, F1,229 = 72, P≪0.01. The same general result was obtained when we used narrowband filters fitted to each unit instead of the artificial STRFs (see Supplementary Information). Similarly, natural STRFs were substantially less successful in predicting the responses to the random-chord stimuli than artificial STRFs (see Supplementary Information). Thus, stimulus encoding was not entirely determined by frequency selectivity. STRFs exhibited superior predictive power when tested with sounds that belong to the ensemble used to estimate them, suggesting that nonlinear mechanisms participate crucially in shaping the neuronal responses10.
Our results demonstrate that frequency tuning in the human auditory cortex is substantially narrower than that typically found in the auditory cortex of non-human mammals (except bats). Using pure tones under the commonly used barbiturate anaesthesia, the tuning width at suprathreshold levels was found to be about one octave in cats13 and about a third of an octave on average in rats14. Comparisons of tuning between awake and anesthetized animals within the same species have repeatedly shown that bandwidths are wider in the awake preparation (cats15, see review16; rats14). Surveys of tuning in the auditory cortex of the awake macaque reported bandwidths that were typically half to one octave17, and either very narrowly tuned neurons were rare17 or bandwidths were wider than a seventh of an octave18. In the only other report of a unit in human auditory cortex1, the width at half-height was at least one octave. The frequency tuning derived from STRFs is typically somewhat narrower than that derived from pure tone responses, but seems to be wider than the data shown here. For example, in deeply anaesthetized cats, the STRF width was about half an octave19. Thus, in mammalian responses, the typical selectivity of cortical neurons was worse, not better, than that found on the periphery of the same species. With the caution required by the small sample reported here, we propose that in contrast with animal studies, the spectral selectivity of neurons in human auditory cortex is substantially better than that of the auditory periphery.
These results are relevant to the apparent paradox of frequency hyperacuity demonstrated repeatedly in human psychoacoustics. Subjects with normal hearing, even untrained, successfully detect spectral differences substantially narrower than the presumed bandwidth of single auditory nerve fibres. Our results demonstrate that frequency differences smaller than 3% could be reliably detected from single-trial responses of single units in human auditory cortex. This value is comparable to the minimum detection threshold reported in untrained subjects9. Thus, the responses of one of these cortical neurons could, in principle, underlie behavioural performance on a single-trial basis. Tramo et al.20 reported that bilateral lesions of human auditory cortex cause significant elevations in frequency discrimination thresholds, suggesting a functional role for the electrophysiological findings reported here. Remarkably, thresholds (frequency ratios) after the lesions were about 10–20%, matching the peripheral tuning in humans. We therefore suggest that the neural responses we observed in human auditory cortex reflect a readout of information available in the activity of large neuronal ensembles in subcortical stations, and that the auditory cortex is necessary for this readout to be performed, resulting in the behavioural hyperacuity of frequency discrimination in humans.
Previous studies in alert human subjects have shown very selective responses in single neurons from other brain areas. Notably, Quiroga et al.21 reported highly specific responses to individual people or landmarks from a subset of medial temporal lobe neurons, suggesting an invariant, sparse code. The high selectivity reported here may be a counterpart of the same phenomenon, resulting in a sparse coding of frequency in auditory cortex. We can only speculate why a low-level cue such as frequency is represented so explicitly and predominantly in single neurons of human auditory cortex but not in the auditory cortex of other terrestrial mammalian species. There is evidence that frequency discrimination in humans is correlated with a number of cognitive skills, including language abilities22, working memory23 and learning capabilities24, but more research is needed to clarify this puzzle.
METHODS SUMMARY
Extracellular single-unit recordings were obtained from four patients with pharmacologically intractable epilepsy, implanted with intracranial electrodes to identify seizure focus for potential surgical treatment. Electrode location was based solely on clinical criteria. All patients had electrodes placed bilaterally in Heschl’s gyri. In each experimental session, patients 1 to 3 were presented twice in succession with 8:40 min of an audio-visual segment of the film “The Good, the Bad, and the Ugly”. Patients 2, 3 and 4 were presented with random-chord stimuli25,26 accompanied with random visual textures. Each chord had three pure-tone components, selected quasi-randomly out of a frequency table spanning the frequency range of the soundtrack. The tone duration was 100 ms (patients 2 and 3) or 50 ms (patient 4) with 10 ms linear onset and offset ramps. The frequencies were equally spaced along a logarithmic axis from 100 Hz to 10 kHz. The resolution was either a sixth of an octave (41 different frequencies, patients 2 and 3) or 1/18th of an octave (108 frequencies, patient 4). Sequence duration was 3.5 min (patients 2 and 3) or 5 min (patient 4). Data were acquired in ten sessions, all conducted at the patients’ quiet bedside using a standard laptop screen and the laptop’s built-in speakers (patients 1 and 2) or external speakers (patients 3 and 4). Sound intensity was set to a comfortable hearing level but absolute sound level was not measured. The free-field presentation was most probably accompanied by reverberation. Though unlikely to have influenced the results presented here, these factors represent differences from most studies in anesthetized animals. The data consist of 95 units (20 units from patient 1, 21 from patient 2, 38 from patient 3 and 16 from patient 4). The linear approximation to the response function for each unit in response to the soundtrack was computed using the software package STRFpak27. Discrimination thresholds were computed using ROC analysis based on empirical spike count distributions.
Supplementary Material
Supplementary Information is linked to the online version of the paper at www.nature.com/nature.
Full Methods and any associated references are available in the online version of the paper at http://www.nature.com/nature.
Acknowledgements
We thank the patients for their cooperation in participating in the experiments. We thank E. Behnke, T. A. Fields, E. Ho and C. Wilson for technical assistance. This work was supported by an ISF grant (to I.N.), a NINDS grant (to I.F.), the US-Israel BSF fund (R.M. and I.F.) and a European Molecular Biology Organization and Human Frontier Science Program fellowship (R.M.).
Footnotes
Author Information Reprints and permissions information is available at www.nature.com/reprints.
References
- 1.Howard MA, III, et al. A chronic microelectrode investigation of the tonotopic organization of human auditory cortex. Brain Res. 1996;724:260–264. doi: 10.1016/0006-8993(96)00315-0. [DOI] [PubMed] [Google Scholar]
- 2.Nelken I. In: Integrative Functions in the Mammalian Auditory Pathway. Oertel D, Popper AN, Fay RR, editors. New York: Springer; 2002. pp. 358–416. [Google Scholar]
- 3.Moore BCJ. An Introduction to the Psychology of Hearing Ch. Vol. 3. London: Academic Press; 1982. pp. 74–114. [Google Scholar]
- 4.Evans EF. In: Psychophysics and Physiology of Hearing. Evans EF, Wilson JP, editors. London: Academic Press; 1977. pp. 185–196. [Google Scholar]
- 5.Ehret G, Schreiner CE. Frequency resolution and spectral integration (critical band analysis) in single units of the cat primary auditory cortex. J. Comp. Physiol. A. 1997;181:635–650. doi: 10.1007/s003590050146. [DOI] [PubMed] [Google Scholar]
- 6.Ehret G, Merzenich MM. Complex sound analysis (frequency resolution, filtering and spectral integration) by single units of the inferior colliculus of the cat. Brain Res. 1988;472:139–163. doi: 10.1016/0165-0173(88)90018-5. [DOI] [PubMed] [Google Scholar]
- 7.Heinz MG, Colburn HS, Carney LH. Evaluating auditory performance limits: I. One-parameter discrimination using a computational model for the auditory nerve. Neural Comput. 2001;13:2273–2316. doi: 10.1162/089976601750541804. [DOI] [PubMed] [Google Scholar]
- 8.Fried I, et al. Cerebral microdialysis combined with single-neuron and electroencephalographic recording in neurosurgical patients. J. Neurosurg. 1999;91:697–705. doi: 10.3171/jns.1999.91.4.0697. [DOI] [PubMed] [Google Scholar]
- 9.Banai K, Ahissar M. Poor frequency discrimination probes dyslexics with particularly impaired working memory. Audiol. Neurootol. 2004;9:328–340. doi: 10.1159/000081282. [DOI] [PubMed] [Google Scholar]
- 10.Theunissen FE, Sen K, Doupe AJ. Spectral-temporal receptive fields of nonlinear auditory neurons obtained using natural sounds. J. Neurosci. 2000;20:2315–2331. doi: 10.1523/JNEUROSCI.20-06-02315.2000. [DOI] [PMC free article] [PubMed] [Google Scholar]
- 11.Woolley SM, Gill PR, Theunissen FE. Stimulus-dependent auditory tuning results in synchronous population coding of vocalizations in the songbird midbrain. J. Neurosci. 2006;26:2499–2512. doi: 10.1523/JNEUROSCI.3731-05.2006. [DOI] [PMC free article] [PubMed] [Google Scholar]
- 12.Hsu A, Borst A, Theunissen FE. Quantifying variability in neural responses and its application for the validation of model predictions. Network. 2004;15:91–109. [PubMed] [Google Scholar]
- 13.Read HL, Winer JA, Schreiner CE. Modular organization of intrinsic connections associated with spectral tuning in cat auditory cortex. Proc. Natl Acad. Sci. USA. 2001;98:8042–8047. doi: 10.1073/pnas.131591898. [DOI] [PMC free article] [PubMed] [Google Scholar]
- 14.Gaese BH, Ostwald J. Anesthesia changes frequency tuning of neurons in the rat primary auditory cortex. J. Neurophysiol. 2001;86:1062–1066. doi: 10.1152/jn.2001.86.2.1062. [DOI] [PubMed] [Google Scholar]
- 15.Qin L, Kitama T, Chimoto S, Sakayori S, Sato Y. Time course of tonal frequency-response-area of primary auditory cortex neurons in alert cats. Neurosci. Res. 2003;46:145–152. doi: 10.1016/s0168-0102(03)00034-8. [DOI] [PubMed] [Google Scholar]
- 16.Moshitch D, Las L, Ulanovsky N, Bar-Yosef O, Nelken I. Responses of neurons in primary auditory cortex (A1) to pure tones in the halothane-anesthetized cat. J. Neurophysiol. 2006;95:3756–3769. doi: 10.1152/jn.00822.2005. [DOI] [PubMed] [Google Scholar]
- 17.Recanzone GH, Guard DC, Phan ML. Frequency and intensity response properties of single neurons in the auditory cortex of the behaving macaque monkey. J. Neurophysiol. 2000;83:2315–2331. doi: 10.1152/jn.2000.83.4.2315. [DOI] [PubMed] [Google Scholar]
- 18.Schwarz DW, Tomlinson RW. Spectral response patterns of auditory cortex neurons to harmonic complex tones in alert monkey (Macaca mulatta) J. Neurophysiol. 1990;64:282–298. doi: 10.1152/jn.1990.64.1.282. [DOI] [PubMed] [Google Scholar]
- 19.Miller LM, Escabi MA, Read HL, Schreiner CE. Spectrotemporal receptive fields in the lemniscal auditory thalamus and cortex. J. Neurophysiol. 2002;87:516–527. doi: 10.1152/jn.00395.2001. [DOI] [PubMed] [Google Scholar]
- 20.Tramo MJ, Shah GD, Braida LD. Functional role of auditory cortex in frequency processing and pitch perception. J. Neurophysiol. 2002;87:122–139. doi: 10.1152/jn.00104.1999. [DOI] [PubMed] [Google Scholar]
- 21.Quiroga RQ, Reddy L, Kreiman G, Koch C, Fried I. Invariant visual representation by single neurons in the human brain. Nature. 2005;435:1102–1107. doi: 10.1038/nature03687. [DOI] [PubMed] [Google Scholar]
- 22.Benasich AA, Tallal P. Infant discrimination of rapid auditory cues predicts later language impairment. Behav. Brain Res. 2002;136:31–49. doi: 10.1016/s0166-4328(02)00098-0. [DOI] [PubMed] [Google Scholar]
- 23.Banai K, Ahissar M. Auditory processing deficits in dyslexia: task or stimulus related? Cereb. Cortex. 2006;16:1718–1728. doi: 10.1093/cercor/bhj107. [DOI] [PubMed] [Google Scholar]
- 24.McArthur GM, Bishop DV. Speech and non-speech processing in people with specific language impairment: a behavioural and electrophysiological study. Brain Lang. 2005;94:260–273. doi: 10.1016/j.bandl.2005.01.002. [DOI] [PubMed] [Google Scholar]
- 25.deCharms RC, Blake DT, Merzenich MM. Optimizing sound features for cortical neurons. Science. 1998;280:1439–1443. doi: 10.1126/science.280.5368.1439. [DOI] [PubMed] [Google Scholar]
- 26.Schnupp JW, Mrsic-Flogel TD, King AJ. Linear processing of spatial cues in primary auditory cortex. Nature. 2001;414:200–204. doi: 10.1038/35102568. [DOI] [PubMed] [Google Scholar]
- 27.Theunissen FE, et al. Estimating spatio-temporal receptive fields of auditory and visual neurons from their responses to natural stimuli. Network. 2001;12:289–316. [PubMed] [Google Scholar]
- 28.Mukamel R, et al. Coupling between neuronal firing, field potentials, and FMRI in human auditory cortex. Science. 2005;309:951–954. doi: 10.1126/science.1110913. [DOI] [PubMed] [Google Scholar]
- 29.Bleeck S, Ives T, Patterson RD. Aim-mat: the auditory image model in MATLAB. Acta Acustica. 2004;90:781–788. [Google Scholar]
Associated Data
This section collects any data citations, data availability statements, or supplementary materials included in this article.
Supplementary Materials
Supplementary Information is linked to the online version of the paper at www.nature.com/nature.
Full Methods and any associated references are available in the online version of the paper at http://www.nature.com/nature.


