

Abstract
In adults the nonclassical MHC-I molecule, FcRn, binds both IgG and albumin and rescues both from a degradative fate, endowing both proteins with high plasma concentrations. FcRn also transports IgG from mother to young during gestation. Anticipating that a detailed understanding of gestational IgG transport in the mouse may give us a useful model to understand FcRn function in the human placenta, we have studied FcRn in the mouse yolk sac placenta in detail. Analyzing day 19-20 fetuses of the three FcRn genotypes resulting from matings of FcRn+/− parents, we found that FcRn−/− fetuses showed negligible IgG concentrations (1.5 μg/mL) whereas IgG concentrations in FcRn+/− fetuses were about a half (176 μg/mL) that of FcRn+/+ fetuses (336 μg/mL), indicating that FcRn is responsible for virtually all IgG transport from mother to fetus. Immunofluorescence and immunoblotting studies indicated that FcRn is expressed in the endoderm of the yolk sac placenta but not in other cells of the yolk sac placenta or in the chorioallantoic placenta. IgG was found in the endoderm of both FcRn+/+ and FcRn−/− yolk sac placentas and in the mesenchyme of FcRn+/+, but was missing from the mesenchyme of FcRn−/− yolk sac placentas, indicating that IgG enters the endoderm constitutively but is moved out of the endoderm by FcRn. The similarities of these results to human placental FcRn expression and function are striking.
Keywords: IgG, yolk sac, placenta, developmental biology, caveolin
Introduction
IgG is transported across the human placenta from maternal circulation to the fetus, passively immunizing the otherwise immunodeficient neonate with a full complement of its mother's protective antibodies. In its path to the fetus IgG traverses two cellular monolayers of the human terminal villus, the syncytiotrophoblast and the endothelium. The transporter of the syncytiotrophoblast is almost certainly the nonclassical MHC class I protein FcRn that binds IgG with high affinity and is driven by a transcellular endosomal pH gradient (1-4). Presumably, then, IgG negotiates the endothelium by moving along a constitutive endocytic pathway, down an IgG concentration gradient. Whether villus endothelial FcγRIIb2 participates in IgG conveyance across the endothelium is not yet clear (1).
Because of constraints to studying placental transport in human, we have moved to the mouse where many of the essential cellular and molecular elements of the human transport pathway appear to be represented. However, placental anatomy is different between the two species. While all human placental functions are accomplished by a single chorioallantoic placenta, the mouse divides placental functions between two distinctive organs, both called placentas. One is a labyrinthine chorioallantoic placenta not too dissimilar from the human placenta. We refer to this organ as the ‘placenta’. The second placenta in mouse is a yolk sac placenta, which we call simply the yolk sac. In human the yolk sac is present only very early in gestation. Based on analogy with the rat and with other mammals such as rabbit, the yolk sac (but not the placenta) of the mouse is the organ exclusively responsible for IgG maternofetal transport during gestation (2). It is perhaps responsible for the gestational transport of other macromolecules as well (5).
As in the human placenta, two cellular layers of the yolk sac separate maternal from fetal circulations; namely, the endoderm monolayer, which expresses FcRn in the rat and by inference in the mouse (6-8); and the cells of the vitelline vasculature, which are thought to transfer IgG constitutively by transcellular vesicular transport (9). It can be inferred further that the yolk sac expresses FcRn because newborn FcRn−/− mice are IgG deficient (10).
Herein we report our testing of several predictions of the hypothesis that mouse yolk sac FcRn is the maternal-fetal transporter of IgG. We first established that FcRn−/− fetuses taken at gestational day 19-20 have virtually zero plasma IgG concentrations, indicating that FcRn is required for transport of > 99.5% of IgG from mother to fetus. We next found FcRn to be expressed exclusively in the endoderm of the mouse yolk sac and not in yolk sac mesenchyme or vasculature or in the placenta. We further found that while yolk sac endoderm appears to take up IgG constitutively, transfer of endodermal IgG to the fetal circulation requires FcRn. Our results suggest that the IgG transport mechanisms in the mouse yolk sac and the human placenta are similar and parallel.
Materials and Methods
Reagents
Armenian hamster anti-mouse FcRn serum and pre-immune serum were kindly provided by Dr. Andrey Shaw (Washington University, St Louis) (11). A chicken anti-caveolin-1 antibody (anti-CAV1) was produced in house (12,13). Alexa dye-conjugated goat anti-mouse IgG and goat anti-chicken IgG, and Prolong anti-fade mounting media were purchased from Invitrogen (Carlsbad, CA); FITC-conjugated goat anti-hamster IgG from Jackson ImmunoResearch Laboratories (West Grove, PA); and 4′, 6-diamidino-2-phenylindole (DAPI) from Sigma-Aldrich (St. Louis, MO). A rabbit anti-rat FcRn antibody raised against the rat FcRn heavy chain separated by gel electrophoresis was a generous gift from Dr. Pamela Bjorkman (California Institute of Technology, CA). This antiserum in our hands immunoblots a single band of the appropriate mobility from supernatants of cells secreting recombinant soluble forms of rat, human, and mouse FcRn; and from mouse tissue lysates (data not shown).
Animals
Breeders of the FcRn-α-chain-knockout strain (B6.129X1/SvJFcgrtTm1Dcr; FcRn−/−) and its wild-type strain (C57BL/6J; FcRn+/+) were obtained from Dr. Derry C. Roopenian of The Jackson Laboratory (Bar Harbor, Maine) (14). The Ohio State University Institutional Animal Care and Use Committee approved all animal studies.
Breeding
Mice heterozygous for FcRn (FcRn+/−) were produced by mating wild-type (FcRn+/+) and knockout (FcRn−/−) strains. Subsequently, heterozygous female mice were mated with heterozygous male mice, both 5-6 months old, to produce fetuses in litter sizes of 5-10 with three different receptor genotypes: FcRn+/+, FcRn+/−, and FcRn−/−.
Harvesting fetuses
At the gestational age of day 19-20, pregnant heterozygous female mice that had been mated to heterozygous male mice were anesthetized under light isoflurane, bled of ∼30 μL from the retroorbital plexus, and subjected to Cesarean section to obtain near-term conceptuses. Fetal blood (∼10 μL) was taken by cardiac puncture with 28-gauge needle-attached 0.5-mL insulin syringes from the individual fetuses. Sera were harvested and stored at -80°C for determination of concentrations of IgG, albumin, and transferrin. Fetal tail tips and maternal livers were obtained for genotyping. The placenta/yolk sac units were fixed in 4% freshly prepared paraformaldehyde (Sigma-Aldrich, St. Louis, MO) in PBS for 2 hrs at room temperature. The tissue was then washed extensively in PBS, incubated overnight at 4°C in 20% sucrose in PBS, embedded, and frozen at -80°C.
Genotyping
The DNA, isolated from fetal tail tips and maternal liver, was genotyped for FcRn by PCR using primers designed to distinguish the targeted (FcRn null) allele from the FcRn wild-type allele by their different sizes on 2.2% agarose gels. Template DNA (100 ng) was used for a 50 μL PCR reaction containing 200 μM dNTPs (Invitrogen), 1× PCR buffer with 1.5 mM MgCl2 (Qiagen, Valencia, CA), and 1 unit of Taq for each reaction.
We modified a published method (14). Briefly, the oligo pair o393F-GGGATGCC ACTGCCCTG and o394R-CGAGCCT GAGATTGTC AAGTGTATT gave a 248-bp wild-type allele, whereas the targeting vector o395F-GGAATT CCCAGT GAAGGGC vs o394R gave a 378-bp targeted allele. Thermocycler conditions were 95°C for 10.00 min, 40 cycles of 94°C for 45 sec, 60°C for 1 min, 72°C for 1 min, and 72°C for 5 min. The PCR products were resolved on 2.2% agarose gel and genotypes were determined based on the band size, FcRn+/+ giving a band size of 248 bp, the FcRn−/− allele a 378 bp band, and a FcRn+/− giving both.
Determination of serum protein concentrations
Steady-state serum concentrations of IgG, albumin, and transferrin were determined by the sandwich ELISA as described earlier (15-17). Individual serum concentrations of IgG or albumin in the fetuses were normalized to their transferrin concentrations, which did not differ among strains (not shown).
Immunoblot analysis
The relative molecular mass of FcRn from different sources was analyzed by immunoblotting using two different anti-FcRn antibodies. Yolk sac and placenta tissues were obtained from C-section (see above). Intestine pieces, consisting of duodenum and small intestine from 9-10 days old FcRn+/+ or FcRn−/− pups were removed under isoflurane anesthesia and quickly frozen and stored at -80°C until use. The freshly isolated placenta tissues were cut into small pieces with a razor blade and homogenized with tissue homogenizer in the presence of tissue lysis buffer (25 mM HEPES, 20 mM Na4P2O7·10 H2O, 100 mM NaF, 4 mM EDTA, 2 mM Na3VO4, 1% Triton X-100, 0.34 mg/mL PMSF, 0.01 mg/mL aprotinin, and 0.01 mg/mL leupeptin). Yolk sac samples were lysed directly without homogenization. Lysates were incubated on ice for 30 min and centrifuged at 23,000 g for 10 min at 4°C. Post nuclear lysates containing equal amounts of protein were boiled in SDS sample buffer for 5 min, separated by 10% SDS-PAGE, and immunoblotted with rabbit anti-rat FcRn serum. For immunoblot using hamster-anti mouse FcRn serum, intestine pieces were thawed and homogenized in 60 mM octylglucoside buffer pH 7.4 (18). Proteins were then resolved on 8-16% gradient gel, transferred to nitrocellulose membranes (Hybond ECL; Amersham Pharmacia Biotech), blocked in 5% non-fat milk at room temperature for 1 hr, and probed with primary antibodies and relevant control antibodies overnight on a rocker at 4°C. Membranes were washed and incubated in FITC- or peroxidase-conjugated secondary antibodies for 1 hr at room temperature. After several washes FITC signal was collected with a Molecular Imager PharosFX systems (Bio-Rad) instrument and peroxidase conjugates were imaged by chemiluminesence.
Deglycosylation with N-Glycosidase F
N-linked oligosaccharides were removed from FcRn protein using the enzyme N-Glycosidase F (Boehringer Mannheim, Indianapolis, IN). Briefly, protein normalized cell lysates were denatured with 5% SDS for 10 min at 100°C. Denatured lysates were incubated with enzyme diluent alone or with N-glycosidase F (Boehringer Mannheim) in reaction buffer (pH 7.5; 0.5 M sodium phosphate and 10% NP-40) at 37°C for 1 hr. The enzyme reaction was stopped by adding SDS sample buffer (60 mM Tris pH 6.8, 2.3% SDS, 10% glycerol, 0.01% bromophenol blue). The deglycosylated FcRn protein was then analyzed by SDS-PAGE and immunoblotting as above.
Immunofluorescence localization of FcRn
Sections of placenta/yolk sac units were cut at 5 μm thickness in a Shandon cryostat (Global Medical Instrumentation, Inc., Minnesota, MN) and were collected on Superfrost slides (Fisher Scientific, Pittsburgh, PA). For immunolocalization of FcRn, the sections were hydrated, blocked in 5% non-fat dry milk, and incubated overnight with 1:500 hamster anti-mouse FcRn serum plus 1:400 chicken anti-CAV1 (13,19) in blocking buffer at 4°C. Antiserum binding was localized indirectly by FITC-labeled goat anti-hamster IgG secondary antibody and chicken anti-CAV1 binding by Alexa-594 dye-conjugated goat IgG anti-chicken IgY secondary antibody. Nuclei were stained with DAPI for 10 min and mounted under coverslips in ProLong. Controls included sections incubated with hamster pre-immune serum plus secondary antibody as well as hamster anti-mouse IgG secondary antibody alone and goat anti-chicken IgY secondary antibody alone. For IgG distribution studies, hydrated and blocked sections were incubated with 1:400 anti-CAV1 at 4°C overnight in a moist chamber, washed the next morning, and then these same sections were incubated with 1:200 Alexa-594 dye conjugated goat anti-chicken IgG and Alexa-488 dye-conjugated goat IgG anti-mouse IgY at room temperature for 1 hr. The slides were washed and stained with DAPI as described above. Fluorescence and differential interference contrast (DIC) images were collected with a Nikon Optiphot microscope and a Photometrics Cool Snap fx camera (Roper Scientific, Tucson, AZ) and captured with the MetaMorph image analysis system (Universal Imaging/Molecular Device, Downingtown, PA). All images were collected within the linear response range of the camera.
Quantitative analysis of images
Noting visually that the yolk sac endoderm but not placenta showed positive FcRn immunofluorescence in FcRn+/+ but not FcRn−/− strains, we quantified the distribution of FcRn. Using the image analysis system we placed a square outline of 225 pixels (15 × 15) over the apical and basal portions of every 4th endodermal cell, moving longitudinally from base to tip on one side of each symmetrical villus and then back to base on the other side, and scored each enclosed image for fluorescence intensity. The same outline was placed on mesenchyma and mesothelium areas and the included fluorescence intensities were measured. In all we examined basal and apical portions of ∼1,200 endodermal areas, ∼ 650 mesenchyma areas and ∼200 mesothelium areas in each strain (a total of 2,050 imaged areas). 2,050 images were collected from FcRn+/+ (n=3; ∼95 villi) and from FcRn−/− (n=3; ∼95 villi) animals. We then averaged the fluorescence intensity measurements for all three cellular layers for each strain and plotted intensity per unit area as a representation of FcRn distribution.
To quantify the distribution and relative abundance of mouse IgG identified by immunofluorescence, we placed a square outline of 2,000 pixels (50 × 40), approximating the size of an average endodermal cell, over every 4th endodermal cell and scored for the fluorescence intensity. Another smaller outline (225 pixels, 15 × 15), appropriate to the smaller size of the mesenchyma, was used to measure fluorescence intensity in the mesenchyma. We examined ∼500 endodermal cells and ∼500 mesenchyma areas in both strains, each representing ∼75 villi from 3 animals from each group. We then averaged the fluorescence intensity for endoderm or mesenchyma for each strain and plotted the intensity per unit area representing relative IgG distribution.
Quantitative localization of placental IgG to the trophoblast giant cell
To measure the fraction of the trophoblast layer associated with IgG, we superimposed the IgG green on the maternal border of the trophoblast that was morphologically identifiable by DIC, and we superimposed the red CAV1 signal on the luminal edge of the placental fetal endothelium, also morphologically identifiable by DIC. Along a line drawn from maternal blood space lumen to fetal capillary lumen, we then quantified 3 distances; namely, the distance occupied by green (Dgreen), the distance occupied by red (Dred), and the black area in between (Dblack). Choosing tissue areas free of ambiguity, folding, or tearing; and using sections from 3 animals, we made 30 measurements, calculating means ± SD (μm), respectively, of 23 ± 4, 14 ± 2, and 64 ± 6. Then, the ratio of Dgreen / (Dgreen + Dblack) represents the fraction of the total thickness of trophoblast that was occupied by IgG.
Statistical analyses
To compare the steady-state concentrations of proteins in the fetuses, mixed linear models were fitted to assess the fixed effects of fetuses (wild-type, heterozygous, and knockout fetuses) on the fetal concentrations after controlling maternal concentrations. Differences in protein concentration among three strains were considered significant at P < 0.05. Analyses were performed using the SAS (version 9.1, SAS Institute Inc., Cary, NC). Data were presented as mean ± SD, or least-squares means and 95% confidence limits.
Results
FcRn is required for IgG transport to the fetus
To measure the effect of FcRn (expressed in the conceptus) on maternofetal transmission of IgG, we compared IgG concentrations day 19-20 fetuses of the three different FcRn genotypes. Conceptuses of FcRn+/− mothers mated with FcRn+/− fathers were delivered by Cesarean section on gestational day 19-20. The fetuses were genotyped for FcRn, and IgG concentrations of cardiac blood were measured. Figure 1A shows that while IgG concentrations averaged about 300 μg/mL in the FcRn+/+ fetuses, IgG concentrations were meager (1.5 μg/mL) in FcRn−/− fetuses (P < 10-4). Therefore, the lack of FcRn expression in the conceptus results in a dramatic decrease in fetal IgG concentration (>200-fold). FcRn+/− fetuses manifested IgG concentrations about one-half that of the FcRn+/+ fetuses (P < 10-4) and significantly higher than FcRn−/− fetuses (P < 10-4).
Figure 1. FcRn is required for IgG transport to fetus.
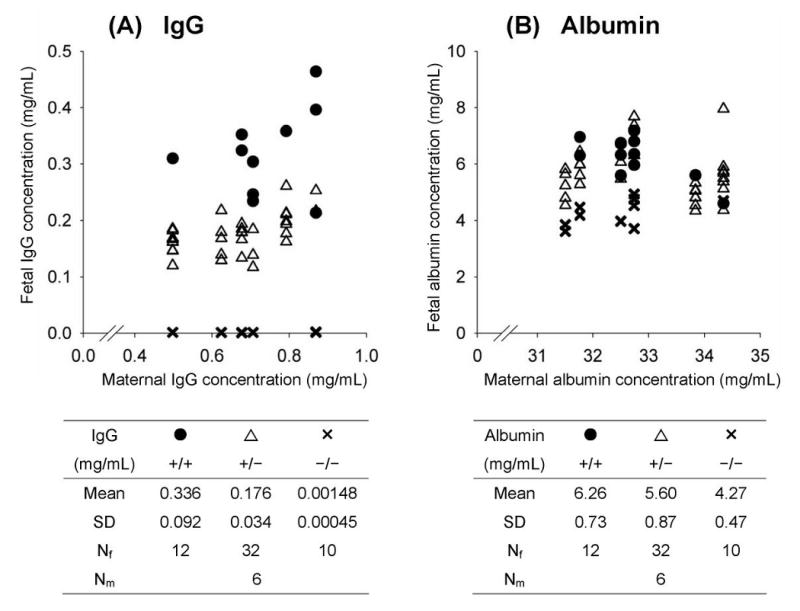
Serum concentrations, determined by ELISA, of IgG (Panel A) and albumin (Panel B) were normalized to transferrin levels to minimize inter-animal variation. Each point represents the fetal serum concentration of an individual pre-term fetus plotted against its maternal serum concentration. Mean values with SD and the number of fetuses in each strain (Nf) and mothers (Nm) are shown. Panel A: The mean fetal IgG concentration was significantly lower in FcRn−/− fetuses (✕) compared with both FcRn+/+ (●) and FcRn+/− (∆) fetuses. Also, the IgG level in FcRn+/− fetuses was about half that of FcRn+/+ fetuses. Panel B: Albumin concentrations of FcRn−/− fetuses were also significantly lower than in both FcRn+/− and FcRn+/+ strains.
Albumin concentrations are also decreased in FcRn−/− fetuses
While it is clear that FcRn binds and prolongs lifespan of both IgG and albumin (1), evidence is scant that albumin is transported by FcRn from mother to fetus (2). Considering that our experimental protocol might lend evidence to the question of albumin transport, we measured albumin concentrations in these same fetuses. Figure 1B shows that albumin concentrations in FcRn−/− fetuses were significantly lower (32%) than both FcRn+/+ (P = 0.0017) and FcRn+/− (P = 0.0032) fetuses. Albumin concentrations in FcRn+/+ and FcRn+/− fetuses were not different (P = 0.4432). Serum concentrations of transferrin, which is not a ligand for FcRn, did not differ among fetuses of the three genotypes (not shown).
FcRn is expressed in the endoderm of the mouse yolk sac but not in the placenta
We assessed the whereabouts of FcRn expression in the yolk sac and placenta of the mouse using a hamster anti-mouse FcRn antibody (11). In immunoblotting studies this antibody recognized a band of ∼50 kDa, characteristic of FcRn, in lysates of neonatal intestine from FcRn+/+ but not FcRn−/− pups (Figure 2A). Immunoblots with hamster pre-immune serum gave no such band, but did give the same bands at the buffer front seen on the Figure 2A blot (data not shown).
Figure 2. FcRn distribution in yolk sac and placenta.
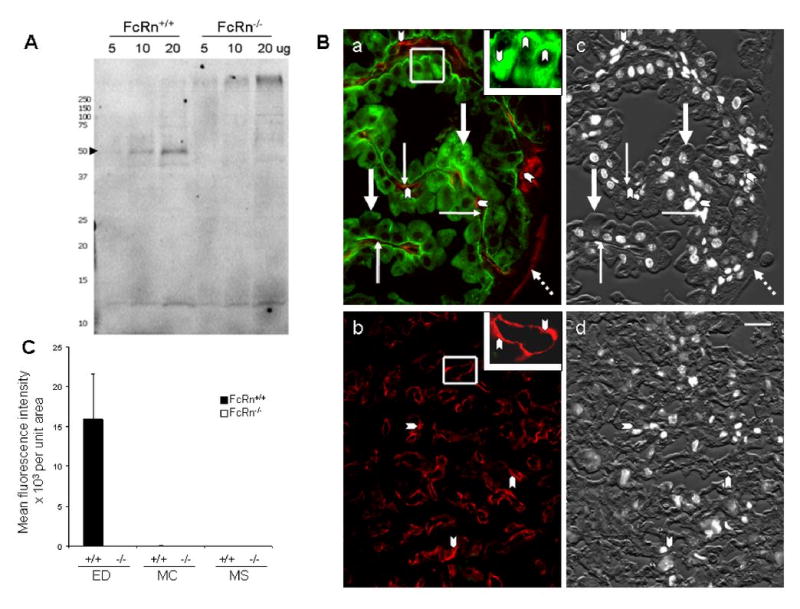
Panel A: Immunoblot of FcRn protein from mouse intestine. Three different amounts of lysate from FcRn+/+ (lane 1, 2 and 3) and FcRn−/− pups (lane 4, 5 and 6) were subjected to SDS-PAGE electrophoresis and immunoblotting with hamster anti-mouse FcRn serum. FcRn is marked with an arrowhead. Replicate samples from 3 FcRn+/+ and 3 FcRn−/− animals gave identical results. Panel B: Localization of FcRn in yolk sac and placenta. Sections of fixed yolk sac (a) and placenta (b) from day 19-20 FcRn+/+ conceptuses were stained simultaneously with hamster anti-mFcRn antiserum (green) and with chicken anti-CAV1 antibody (red) for endothelium. FcRn was restricted to the apical and basal portions of endodermal cells (thick arrows) in the yolk sac (a). No FcRn signal can be found in yolk sac mesenchyma (thin arrows), in endothelium marked by CAV1 labeling (arrow heads), or in mesothelium (broken arrows), also marked by CAV1 labeling (a). The inset of panel (a), containing a higher magnified view of an outlined area of yolk sac, illustrates the dense green labeling in apical and basal areas of endodermal cells (arrowheads). The lack of green in panel (b) indicates that no FcRn is expressed in the placental labyrinth. Arrowheads point to the endothelium marked by CAV1 labeling (red). The inset of panel (b) shows a higher magnified view of a CAV1-labeled area. Panels c and d are black and white renditions of the corresponding DIC and DAPI stained images of a and b merged to illustrate the morphology of the tissue. Hamster pre-immune serum showed nothing more intense than the nonspecific staining seen with the secondary antibody alone (not shown). Bar = 20 μm. Panel C: Quantification of immunofluorescence images. Yolk sac sections from FcRn+/+ and FcRn−/− animals were stained with hamster anti-mFcRn antiserum and FITC-goat anti-hamster IgG. Fluorescence images were collected from representative sites of the three major cellular areas of the yolk sac; i.e., endodermal (ED), mesenchyma (MC), and mesothelium areas (MS). The images were quantified, the numbers averaged for each area (mean fluorescence intensity), and the areas compared by normogram. We noted a very faint patchy green fluorescence in the ED of FcRn−/− yolk sacs far below the intensity of the FcRn+/+ yolk sacs (mean fluorescence intensities of 6,000 ± 6 in FcRn+/+ ED, while mean fluorescence intensities of MS and MS areas were < 30). This patchiness may indicate cross-reactivity of the antibody with another component of the ED, perhaps similar to that described by the originator of the hamster anti-mFcRn antibody (11).
Using this same antibody for immunofluorescence studies on tissue sections of placenta/yolk sac units, we found that the distribution of FcRn in the mouse yolk sac was restricted to endodermal cells; no FcRn was detected in the cells of the mesenchyme including the vitelline vasculature (Figure 2Ba) or in cells of the placenta labyrinth (Figure 2Bb). Within endodermal cells, FcRn predominated in the apical and basal regions of these cells (Figure 2Ba).
Quantifying the FcRn fluorescence signal by analyzing over 4000 data points from several animals, we document that the average intensity per unit area of endoderm is significantly higher (∼4,000×) in FcRn+/+ than FcRn−/− yolk sacs (P < 0.05) (Figure 2C). The distribution of FcRn in FcRn+/+ yolk sac was restricted to the endodermal layers; only background levels of fluorescence were detected in the mesenchyma or mesothelial layers (P < 0.05).
FcRn from mouse yolk sac is more heavily glycosylated than intestinal FcRn
We measured the mobility by SDS-PAGE and immunoblotting of mouse FcRn in mouse placenta, yolk sac, and neonatal intestine (Figure 3). A predominant band approximating the mobility of FcRn, about 45-55 kDa, appears in samples of yolk sac and neonatal intestine from FcRn+/+ mice, but not in placenta and intestine from FcRn−/− mice (Figure 3A). However, FcRn from yolk sac migrates more slowly than the FcRn of neonatal intestine, suggesting perhaps a difference in glycosylation between the two. Removing N-linked oligosaccharides with N-Glycosidase F, we found that FcRn from both sources, yolk sac and intestine, moved with near-identical mobilities (Figure 3B).
Figure 3.

Panel A: Immunoblot of FcRn protein in the mouse yolk sac. Tissue lysates of equal protein concentration from samples of yolk sac (YS), placenta (Plac), neonatal intestine (Int) from FcRn+/+ and FcRn−/− conceptuses were analyzed by SDS-PAGE and immunoblot (IB) with rabbit anti-rat FcRn antibody. Panel B: Mobility of de-glycosylated FcRn from yolk sac and neonatal intestine. The lysates were equilibrated with the appropriate buffer, incubated with or without N-glycosidase F(+/− N-gly F), and analyzed by immunoblotting with the rabbit anti-rat FcRn antibody. Numbers are MW markers in kDa.
Endodermal FcRn is responsible for exocytosis but not uptake of IgG
Attempting to localize the IgG transport defect between mother and FcRn−/− fetuses we compared, by localizing and quantifying, mouse IgG in sections of yolk sac from FcRn+/+ and FcRn−/− conceptuses by immunofluorescence microscopy (Figure 4). We found IgG to be present in the endoderm of both strains (Figure 4A and 4B, heavy arrows) indicating that cellular uptake of IgG is not blocked in the absence of FcRn. However, while IgG is abundant in the mesenchyma of FcRn+/+ yolk sac, it is almost completely absent in the mesenchymal region of the FcRn−/− yolk sac (Figure 4A and 4B, thin arrows).
Figure 4. IgG distribution in mouse visceral yolk sac.
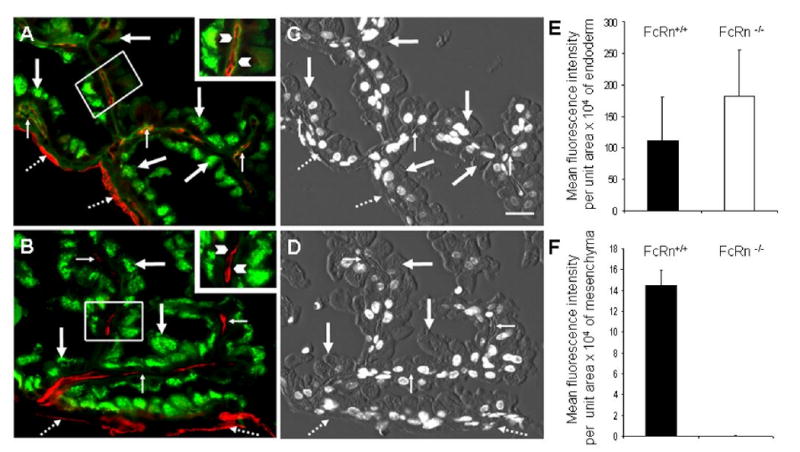
Photomicrographs of representative tissue sections dual labeled with (green) Alexa-488 goat IgG anti-mouse IgG and chicken anti-CAV1 antibody followed by (red) Alexa-594 goat IgG anti-chicken IgY secondary antibody. Panel A: FcRn+/+ yolk sac in which green signal is seen in endodermal cells (thick arrows) as well in mesenchymal areas (thin arrows). Anti-CAV1 labels both the endothelium in mesenchyma and the mesothelium (broken arrows). The inset, which contains a higher magnification view of the small outlined area of yolk sac, shows labeling of IgG in mesenchyma, indicated by arrowheads. Panel B: FcRn−/− yolk sac showing bright green staining of the endodermal cells (thick arrow) but no IgG staining in the mesenchyma (thin arrow). The mesothelium (red) is marked with broken arrows. The inset, containing a higher magnification view of the outlined area of yolk sac, shows with arrowheads the lack of IgG in the mesenchyma. For orientation of arrows with histologic features, the center two panels show combined DIC and DAPI images of yolk sac from FcRn+/+ (C) and FcRn−/− (D) conceptuses. Bar = 20 μm. Panels E and F: Quantification of immunofluorescence images. Multiple images such as those in panels A and B were quantified as in Figure 2C. The relative morphologic distribution and the fluorescence intensity of IgG staining in yolk sac cells were quantified and compared (expressed as mean fluorescence intensity ± SD) from recorded fluorescence intensity measurements of both endodermal (E) and mesenchymal (F) areas of tissue sections. Matched yolk sacs from 3 FcRn+/+ and 3 FcRn−/− conceptuses were studied simultaneously. In panel F, the average intensity per unit area for FcRn−/− is 0.0193 with SD of 0.023.
Quantifying the fluorescence data from images of 150 villi from a total of 6 animals using MetaMorph software, we compared the intensity of the IgG signal in endodermal cells (Figure 4E) and the mesenchyme (Figure 4F) of both FcRn+/+ and FcRn−/− yolk sac (Figure 4E). While there was a trend for the FcRn−/− endoderm to contain more IgG than the FcRn+/+ endoderm (Figure 4E), this difference was not statistically significant (P > 0.45). However, it is easily demonstrable that IgG was present in the mesenchymal layers of FcRn+/+ yolk sac but was undetectable in the same mesenchymal layers of FcRn−/− yolk sac (P < 0.003) (Figure 4F).
IgG cannot be detected in the placental endothelium
In a fashion identical to our assessment of IgG distribution in the yolk sac, we examined the placenta at gestational day 19-20 for the whereabouts of IgG by two-color immunofluorescence identifying both mIgG (green) and endothelium (red) using the CAV1 marker, superimposing both color images on DIC and DAPI images for histological correlation. We found the maternal blood spaces of the FcRn+/+ placental labyrinth to be lined by patchy deposits of IgG (Figure 5A, green). Superimposition of both red and green images with DIC plus DAPI images (Figure 5B) of 30 trophoblast cross sections from 3 placentas indicates that the green color is associated with the luminal one-fourth (26 %) of the distance from the lumen of the maternal blood space to the lumen defined by the fetal endothelium. This result would suggest that IgG is associated with the trophoblast giant cell alone and likely not the underlying two layers of syncytiotrophoblast (I and II)(20,21). The placental endothelium, identified by CAV1 (red) appears virtually free of IgG (Figure 5A and 5C). Quantifying our visual impression by measuring red and green signal from 3 FcRn+/+ placentas, we document that IgG is not present in the endothelium of the placenta (Figure 5C).
Figure 5. Lack of IgG in labyrinth endothelium.
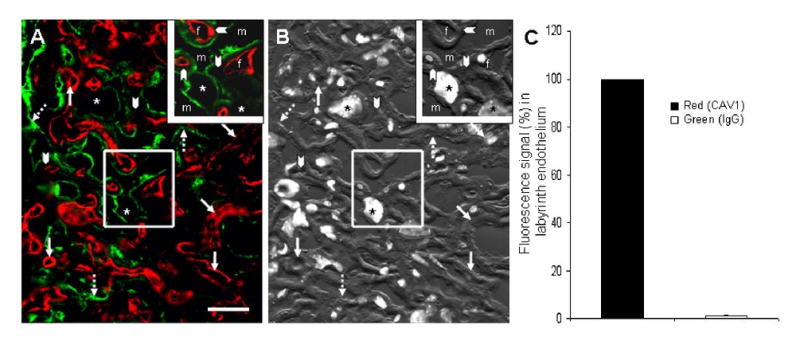
Panel A: A two-color immunfluorescence photomicrograph of the labyrinth region of a chorioallantoic placenta showing the presence of mIgG (green) and illustrating the dearth of maternal IgG in the fetal endothelium as defined by CAV1 labeling (red). The maternal blood spaces are defined by green IgG (broken arrows). Arrowheads point to trophoblast layer I & II which lack any green fluorescence signal. Asterisks are placed on the characteristically large nuclei of sinusoidal trophoblast giant cells. Bar = 30 μm. Panel B: Superimposed DAPI and DIC images are provided for orientation. Panel C: Assessing 27 mm of linear endothelium from 3 FcRn+/+ placentas (∼250 images) by 2-color immunofluorescence, we quantified the amount of IgG associated with endothelial cells (green with red). The histograms show that compared with the amount of red signal identifying endothelium (arbitrarily set at 100%), only a trace of IgG (green) colocalizes with red (≪ 1%) (P = 3 × 10⁻⁶).
Discussion
We have shown here in mice that FcRn−/− fetuses at the end of gestation have virtually no IgG in their blood; that FcRn is expressed in the yolk sac endoderm, and not in the chorioallantoic placenta; that in the course of moving through the yolk sac maternal IgG appears to enter the endoderm in the absence of FcRn but fails to reach the mesenchyme and the vitelline vasculature; and that abundant IgG can be found associated with the trophoblast giant cells of the placenta, but none appears to traverse to the endothelium of fetal placenta. We elaborate several conclusions from these core findings:
These findings in all affirm our hypothesis that the yolk sac FcRn is the maternal-fetal IgG transporter in the mouse. The virtual absence of IgG in blood of the FcRn−/− fetuses at gestational day 19-20 (Figure 1A) would seem strong evidence that FcRn is the essential transporter, but we realize that two physiologic processes govern the IgG concentration in the fetus, so some discussion is necessary. We must consider both the rate of IgG transport from mother across the yolk sac and the rate of IgG degradation within the fetus. If we assume that the rate of IgG degradation in the fetus approximates that of the adult where the ratio of plasma IgG concentrations in FcRn+/+ to FcRn−/− strains is 5:1 – 10:1 (15,22), then the fetal IgG concentration ratio of 200:1 for FcRn+/+ to FcRn−/− in the present study indicates that much more IgG is present in the FcRn+/+ fetuses, 20-40 fold more, than can be accounted for by degradation alone. This calculation demands that we conclude that FcRn is near completely necessary for IgG transport across the yolk sac of the mouse. We can conclude more generally, therefore, that FcRn mediates IgG concentrations throughout the lifespan of the individual at three different anatomic sites; protecting IgG from degradation systemically throughout life; transporting IgG across the gut of the neonate; and, as we affirm here, transporting IgG in utero.
We found also that FcRn+/− fetuses manifest 48% lower IgG concentration than FcRn+/+ fetuses, indicating that two FcRn alleles are required for normal IgG concentrations in the fetus, whether from FcRn-transport across the yolk sac or from FcRn-recycling within the fetus. This finding is at odds with the conclusion of others that IgG concentrations of β2m+/+ and β2m+/− newborns are indistinguishable (10), but it is consistent with our evaluation of β2m+/− humans who manifested 75% normal IgG concentrations attributed to a partial lack of FcRn (23). We have reflected that the wide range of normal values of IgG concentrations in human may in part result from FcRn heterozygotes harboring an otherwise silent single null mutation (23).
The obvious distinction in fetal IgG concentrations among the fetuses of three different genotypes from the same mother (Figure 1) indicates that mixing of fetal circulations between adjacent fetal/placental units is nil, allowing us directly to compare IgG concentrations among different genotypes in the same litter. Furthermore, it should be noted that we have minimized maternal effects on fetal IgG concentrations by assessing fetuses of all three genotypes that are the products of heterozygous, genetically identical parents.
Our immunofluorescence microscopy and immunoblotting experiments affirm our hypothesis that FcRn is expressed in the yolk sac but not in the placenta (Figures 2 and 3). The immunofluorescence experiments were made possible by a new hamster anti-mFcRn antiserum that recognizes only a single band of the appropriate mobility in samples from both neonatal intestine and yolk sac of FcRn+/+ animals (Figure 2). This result, along with an understanding of how the antiserum was made and first characterized (11), would indicate that the antiserum is specific for FcRn. The immunoblotting studies utilized two different polyclonal antibodies, optimizing immunologic specificity of detection, and resolved a difference in relative molecular mass of FcRn from different tissues by showing that the deglycosylated molecules moved identically (Figure 3). The functional significance of the difference in molecular size of mouse FcRn depending on its tissue source is unknown. We note that others have made the same observation in the rat (8).
Thus, we affirm what has long been implied that the yolk sac, and not the chorioallantoic placenta, is the IgG transporting organ of the mouse. With such a critical function being delegated to the yolk sac, we find it remarkable that no systematic study has been done of the division of labor between the two mouse placentas.
Within the yolk sac we find FcRn expressed exclusively in the endodermal cells and not in the cells of the mesenchyme and vitelline vasculature (Figure 2). Thus, the pattern of FcRn expression is fully consistent with observations in the rat (8). Further, these data underscore similarities between human and mouse. FcRn expression in the endoderm of the mouse yolk sac and in the syncytiotrophoblast of the human placenta (18,24) extends the functional parallel of these two organs in these two species and suggests that study of the mouse yolk sac may be a useful model for dissection of the mechanism of IgG transport in the human placenta.
We noted that whereas the endoderm of both FcRn+/+ and FcRn−/− yolk sacs contained about equal amounts of IgG, by contrast IgG was found in the mesenchyme of only the FcRn+/+ and not the FcRn−/− yolk sacs (Figure 4). Thus, in the absence of FcRn, IgG appears to be stalled in transit from mother to fetus. IgG clearly enters the endoderm regardless of the presence of FcRn, but it seems unable to exit the endoderm and move to the mesenchyme in the absence of endodermal FcRn; i.e., in the FcRn−/− yolk sac. Failing to reach the mesenchyme, IgG would also fail to enter the fetal circulation, as we measured in the data of Figure 1. This interpretation leads us to affirm a hypothesis originally formulated by Brambell, the father of this field, in the 1950s (2). Brambell would have said that IgG is endocytosed nonspecifically and constitutively at the apical surface of endoderm from yolk sacs of both strains. Within the intracellular vesicles of endoderm, IgG encounters and binds to FcRn which, in complex, move to the basolateral surface of the cell where IgG is exocytosed into the mesenchyme tissue and eventually into the fetal vitelline circulation. Further studies of this endoderm will show us the detailed mechanism of the transport process.
Our observations about the chorioallantoic placenta, that FcRn is not expressed and that maternal IgG seems not to move any closer to the fetal circulation than the trophoblast giant cell (Figure 5), are compatible with general notion that in rodents and rabbits the yolk sac placenta but not the chorioallantoic placenta is the site of IgG transport to the fetus (2,25).
Our finding that albumin concentrations are 32% lower in FcRn−/− than FcRn+/+ fetuses (Figure 1B) is noteworthy in light of our recent discovery that FcRn binds albumin and governs its catabolic rate (1). The lower albumin concentrations in FcRn−/− fetuses likely result from some combination of two possible effects. First, if FcRn is expressed systemically in the albumin-producing fetus and protects albumin from degradation, then the FcRn−/− fetus would show a diminished albumin concentration compared with the FcRn+/+ fetus as was seen in adult mice (1). The only data relevant to fetal FcRn expression is a single study showing no FcRn mRNA in the fetal proximal gut; other tissues were not sampled (26). Second, since IgG appears to be transported by FcRn to the fetus (argument above) and since FcRn binds albumin, then FcRn may be transporting maternal albumin to the fetal circulation. We have no direct data relevant to albumin transport by FcRn. At the present time we are unable to distinguish between FcRn-mediated albumin recycling and transport in the conceptus.
Acknowledgments
The authors are grateful to Dr. Derry C. Roopenian for FcRn-deficient mouse strain breeders, to Dr. C. L. Bronson for helpful comments, to Ms. Sarah McAllister for technical assistance, to Dr. Pamela Bjorkman for the rabbit anti-rat FcRn heavy chain antibody, to Dr. Andrey Shaw for the hamster anti-mFcRn antiserum, and to Dr. Richard Burry and the staff of at the OSU Campus Microscopy & Imaging Facility for helpful information relating to imaging.
Abbreviations
- FcRn
Fc receptor (neonatal)
- placenta
mouse chorioallantoic placenta or the human placenta
- yolk sac
mouse yolk sac placenta
- CAV1
caveolin 1
- DAPI
4′,6-diamidino-2-phenylindole
- DIC
differential interference contrast
- ED
endoderm
- MC
mesenchyme
- MS
mesothelium
Footnotes
This work was supported in part by grants HD38764, CA88053, and AI57530 from the NIH.
References
- 1.Anderson CL, Chaudhury C, Kim J, Bronson CL, Wani MA, Mohanty S. Perspective-- FcRn transports albumin: relevance to immunology and medicine. Trends Immunol. 2006;27:343–348. doi: 10.1016/j.it.2006.05.004. [DOI] [PubMed] [Google Scholar]
- 2.Brambell FWR. The Transmission of Passive Immunity from Mother to Young. North Holland Publishing Company; Amsterdam: 1970. [Google Scholar]
- 3.Burmeister WP, Gastinel LN, Simister NE, Blum ML, Bjorkman PJ. Crystal structure at 2.2 A resolution of the MHC-related neonatal Fc receptor. Nature. 1994;372:336–343. doi: 10.1038/372336a0. [DOI] [PubMed] [Google Scholar]
- 4.Ghetie V, Ward ES. Multiple roles for the major histocompatibility complex class I- related receptor FcRn. Annu Rev Immunol. 2000;18:739–766. doi: 10.1146/annurev.immunol.18.1.739. [DOI] [PubMed] [Google Scholar]
- 5.Christensen EI, Verroust PJ. Megalin and cubilin, role in proximal tubule function and during development. Pediatr Nephrol. 2002;17:993–999. doi: 10.1007/s00467-002-0956-5. [DOI] [PubMed] [Google Scholar]
- 6.Carpenter SJ, Ferm VH. Uptake and storage of Thorotrast by the rodent yolk sac placenta: an electron microscopic study. Am J Anat. 1969;125:429–456. doi: 10.1002/aja.1001250405. [DOI] [PubMed] [Google Scholar]
- 7.Jollie WP. Development, morphology, and function of the yolk-sac placenta of laboratory rodents. Teratology. 1990;41:361–381. doi: 10.1002/tera.1420410403. [DOI] [PubMed] [Google Scholar]
- 8.Roberts DM, Guenthert M, Rodewald R. Isolation and characterization of the Fc receptor from the fetal yolk sac of the rat. J Cell Biol. 1990;111:1867–1876. doi: 10.1083/jcb.111.5.1867. [DOI] [PMC free article] [PubMed] [Google Scholar]
- 9.Lin CT. Immunoelectron microscopy localization of immunoglobulin G in human placenta. J Histochem Cytochem. 1980;28:339–346. doi: 10.1177/28.4.6768794. [DOI] [PubMed] [Google Scholar]
- 10.Israel EJ, Wilsker DF, Hayes KC, Schoenfeld D, Simister NE. Increased clearance of IgG in mice that lack beta 2-microglobulin: possible protective role of FcRn. Immunology. 1996;89:573–578. doi: 10.1046/j.1365-2567.1996.d01-775.x. [DOI] [PMC free article] [PubMed] [Google Scholar]
- 11.Akilesh S, Christianson GJ, Roopenian DC, Shaw AS. Neonatal FcR expression in bone marrow-derived cells functions to protect serum IgG from catabolism. J Immunol. 2007;179:4580–4588. doi: 10.4049/jimmunol.179.7.4580. [DOI] [PubMed] [Google Scholar]
- 12.Lyden TW, Anderson CL, Robinson JM. The endothelium but not the syncytiotrophoblast of human placenta expresses caveolae. Placenta. 2002;23:640–652. doi: 10.1053/plac.2002.0847. [DOI] [PubMed] [Google Scholar]
- 13.Takizawa T, Anderson CL, Robinson JM. A novel Fc gamma R-defined, IgG-containing organelle in placental endothelium. J Immunol. 2005;175:2331–2339. doi: 10.4049/jimmunol.175.4.2331. [DOI] [PubMed] [Google Scholar]
- 14.Roopenian DC, Christianson GJ, Sproule TJ, Brown AC, Akilesh S, Jung N, Petkova S, Avanessian L, Choi EY, Shaffer DJ, Eden PA, Anderson CL. The MHC class I-like IgG receptor controls perinatal IgG transport, IgG homeostasis, and fate of IgG-Fc-coupled drugs. J Immunol. 2003;170:3528–3533. doi: 10.4049/jimmunol.170.7.3528. [DOI] [PubMed] [Google Scholar]
- 15.Chaudhury C, Mehnaz S, Robinson JM, Hayton WL, Pearl DK, Roopenian DC, Anderson CL. The major histocompatibility complex-related Fc receptor for IgG (FcRn) binds albumin and prolongs its lifespan. J Exp Med. 2003;197:315–322. doi: 10.1084/jem.20021829. [DOI] [PMC free article] [PubMed] [Google Scholar]
- 16.Chaudhury C, Kim J, Mehnaz S, Wani MA, Oberyszyn TM, Bronson CL, Mohanty S, Hayton WL, Robinson JM, Anderson CL. Accelerated transferrin degradation in HFE-deficient mice is associated with increased transferrin saturation. J Nutr. 2006;136:2993–2998. doi: 10.1093/jn/136.12.2993. [DOI] [PubMed] [Google Scholar]
- 17.Kim J, Bronson CL, Hayton WL, Radmacher MD, Roopenian DC, Robinson JM, Anderson CL. Albumin turnover: FcRn-mediated recycling saves as much albumin from degradation as the liver produces. Am J Physiol Gastrointest Liver Physiol. 2006;290:G352–G360. doi: 10.1152/ajpgi.00286.2005. [DOI] [PubMed] [Google Scholar]
- 18.Leach JL, Sedmak DD, Osborne JM, Rahill B, Lairmore MD, Anderson CL. Isolation from human placenta of the IgG transporter, FcRn, and localization to the syncytiotrophoblast: implications for maternal-fetal antibody transport. J Immunol. 1996;157:3317–3322. [PubMed] [Google Scholar]
- 19.Lyden TW, Robinson JM, Tridandapani S, Teillaud JL, Garber SA, Osborne JM, Frey J, Budde P, Anderson CL. The Fc receptor for IgG expressed in the villus endothelium of human placenta is Fc gamma RIIb2. J Immunol. 2001;166:3882–3889. doi: 10.4049/jimmunol.166.6.3882. [DOI] [PubMed] [Google Scholar]
- 20.Rawn SM, Cross JC. The Evolution, Regulation, and Function of Placenta-Specific Genes. Annu Rev Cell Dev Biol. 2008 doi: 10.1146/annurev.cellbio.24.110707.175418. In Press. [DOI] [PubMed] [Google Scholar]
- 21.Takata K, Fujikura K, Shin BC. Ultrastructure of the rodent placental labyrinth: A site of barrier and transport. J Reprod Dev. 1997;43:13–24. [Google Scholar]
- 22.Junghans RP, Anderson CL. The protection receptor for IgG catabolism is the beta2-microglobulin-containing neonatal intestinal transport receptor. Proc Natl Acad Sci U S A. 1996;93:5512–5516. doi: 10.1073/pnas.93.11.5512. [DOI] [PMC free article] [PubMed] [Google Scholar]
- 23.Wani MA, Haynes LD, Kim J, Bronson CL, Chaudhury C, Mohanty S, Waldmann TA, Robinson JM, Anderson CL. Familial hypercatabolic hypoproteinemia caused by deficiency of the neonatal Fc receptor, FcRn, due to a mutant beta2-microglobulin gene. Proc Natl Acad Sci U S A. 2006;103:5084–5089. doi: 10.1073/pnas.0600548103. [DOI] [PMC free article] [PubMed] [Google Scholar]
- 24.Simister NE, Story CM, Chen HL, Hunt JS. An IgG-transporting Fc receptor expressed in the syncytiotrophoblast of human placenta. Eur J Immunol. 1996;26:1527–1531. doi: 10.1002/eji.1830260718. [DOI] [PubMed] [Google Scholar]
- 25.Parr EL, Parr MB. Localization of immunoglobulins in the mouse uterus, embryo, and placenta during the second half of pregnancy. J Reprod Immunol. 1985;8:153–171. doi: 10.1016/0165-0378(85)90038-5. [DOI] [PubMed] [Google Scholar]
- 26.Martin MG, Wu SV, Walsh JH. Ontogenetic development and distribution of antibody transport and Fc receptor mRNA expression in rat intestine. Dig Dis Sci. 1997;42:1062–1069. doi: 10.1023/a:1018853506830. [DOI] [PubMed] [Google Scholar]