

Abstract
High intensity pulsed ultrasound can produce significant mechanical tissue fractionation with sharp boundaries (“histotripsy”). At a tissue-fluid interface, histotripsy produces clearly demarcated tissue erosion and the erosion efficiency depends on pulse parameters. Acoustic cavitation is believed to be the primary mechanism for the histotripsy process. To investigate the physical basis of the dependence of tissue erosion on pulse parameters, an optical method was used to monitor the effects of pulse parameters on the cavitating bubble cloud generated by histotripsy pulses at a tissue-water interface. The pulse parameters studied include pulse duration, peak rarefactional pressure, and pulse repetition frequency (PRF). Results show that the duration of growth and collapse (collapse cycle) of the bubble cloud increased with increasing pulse duration, peak rarefactional pressure, and PRF when the next pulse arrived after the collapse of the previous bubble cloud. When the PRF was too high such that the next pulse arrived before the collapse of the previous bubble cloud, only a portion of histotripsy pulses could effectively create and collapse the bubble cloud. The collapse cycle of the bubble cloud also increased with increasing gas concentration. These results may explain previous in vitro results on effects of pulse parameters on tissue erosion.
I. INTRODUCTION
Tissue disintegration using ultrasound induced cavitation1–9 and shockwave generated tissue destruction10,11 have been observed by many researchers. Our recent studies have shown that short, high-intensity pulses delivered at certain pulse repetition frequencies (PRF) can achieve complete mechanical tissue fragmentation.12–15 This technique can be considered a form of soft tissue lithotripsy, which we call “histotripsy.” At a tissue-fluid interface, histotripsy results in tissue erosion with sharply demarcated boundaries.12 Histotripsy induced tissue erosion may be applied to many clinical applications where tissue removal is needed. For example, we are currently developing the technique as a noninvasive procedure to perforate the atrial septum (the tissue separating the two atria of the heart) in the treatment of a congenital heart disease called hypoplastic left heart syndrome.12,15
Acoustic cavitation is believed to be the primary mechanism for the histotripsy process. Our previous studies have shown that histotripsy pulses can generate a dynamically changing bubble cluster, which has been observed by high speed imaging.16 The bubbles appear to behave as one dynamic unit, growing and shrinking together,17 and therefore this bubble cluster can be called a “bubble cloud” as previously defined by cavitation researchers.18–21 The bubble cloud formation corresponds to the initiation of a temporally changing acoustic backscatter,16 which is an excellent indicator of tissue erosion.22 These concordant results suggest that the cavitating bubble cloud is essential for the erosion process.
The acoustic pressures effective for histotripsy are similar to those found in lithotripter shockwave pulses. In comparison to the one cycle pulses commonly used in lithotripsy, the histotripsy pulses are several acoustic cycles in duration. Shockwave lithotripsy studies have shown that positive pressure can compress existing bubbles, while following negative pressure can cause bubble growth and collapse. The durations of growth and collapse are long (hundreds of microseconds) compared to the lithotripsy pulse length (several microseconds). The bubble radius-time curve has been modeled for lithotripsy23 and confirmed experimentally in vitro24–26 and in vivo.27–29 In this paper, we used transmitted light signals to trace the growth and collapse of the bubble cloud generated by histotripsy pulses. As this optical method detects bubbles by monitoring the attenuation of the transmitted light intensity, we refer to it as an optical attenuation method. Our previous studies have shown that the optical attenuation was only detected when a bubble cloud was observed using high speed imaging.16
The selection of pulse parameters including pressure amplitude or intensity levels, pulse duration, and PRF affects the extent and efficiency of the mechanical tissue disruption induced by histotripsy.12,13,30,31 For example, the axial erosion rate is almost an order of magnitude greater using shorter pulses (three cycles) as opposed to longer pulses (twenty-four cycles) with the same energy.12 Erosion also appears more energy efficient at certain PRFs than others.12 The axial erosion rate is slower and the erosion area is significantly larger at high intensity (ISPPA > 5000 W/cm2).30 Furthermore, the erosion rate depends on the gas content of the fluid in which the tissue is submerged. Erosion is harder to initiate at lower dissolved gas concentrations, but the erosion rate is faster.12 The dependence of other cavitational effects on pulse parameters and gas content has also been observed by many other researchers.8,32–37
In this paper, we used the optical attenuation method to study the effects of pulse parameters and dissolved gas concentration on the dynamics of a bubble cloud generated by histotripsy pulses at a tissue-water interface. Pulse parameters studied include pulse duration, peak rarefactional pressure, and PRF. Furthermore, we compared bubble cloud dynamics at a tissue-water interface to that in free water to evaluate the influence of a soft tissue boundary on the bubble cloud. We report the duration of growth and collapse (collapse cycle) of the bubble cloud, as measured by the duration of the light attenuation. The results may explain the effects of pulse parameters on tissue erosion and serve as a guide for future parameter optimization.
II. METHODS
A. Ultrasound generation and calibration
Ultrasound pulses were generated by an 18-element piezocomposite spherical-shell therapeutic array (Imasonic, S.A., Besançon, France) with a center frequency of 750 kHz and a geometric focal length of 100 mm. The therapy array had an annular configuration with outer and inner diameters of 145 and 68 mm, respectively. All the array elements were excited together in phase. The array driving system, maintained under PC control, consists of channel driving circuitry, associated power supplies (Model 6030A, HP, Palo Alto, CA), and a software platform to synthesize driving patterns. A PC console also provided control of a motorized three-dimensional positioning system (Parker Hannifin, Rohnert Park, CA) to position the array at each exposure site.
The pressure wave form at the focus of the 18-element array in the acoustic field was measured in degassed water (12%–25% of normal saturation) (i.e., free-field conditions) using a fiber-optic probe hydrophone developed in-house.38 The lateral and axial pressure profiles of the focused beam were measured to be 2.2 mm × 12.6 mm in width (full width at half maximum) at peak rarefactional pressure of 14 MPa and 1.8 × 11.9 mm at 19 MPa. The beam width decreased with increasing pressure. The peak rarefactional and compressional pressures and spatial-peak pulse-average intensity (ISPPA)39 used in experiments were measured for free-field conditions and reported in Table I. In Fig. 1, multiple pulses were used to generate a bubble cloud. While in other figures (Figs. 2 and 3; Tables II and III), a single pulse was used to create a bubble cloud. The pressure levels in the single pulse experiments could not be calibrated successfully due to the instantaneous cavitation. A peak rarefactional pressure of 21 MPa and a peak compressional pressure of 76 MPa were measured at a lower power level without generation of bubbles during measurement. This pressure wave form is shown in Fig. 4.
TABLE I.
Pulse parameters used in Fig. 1 and corresponding light attenuation results at a tissue-water interface.
| Acoustic parameters |
Light attenuation results (initiated) |
Number of pulses |
||||||||
|---|---|---|---|---|---|---|---|---|---|---|
| Row number in Fig. 4 | Gas (PO2) | PD (cycles) | P−(MPa) | P+ (MPa) | ISPPA (W/cm2) | PRF (kHz) | Attenuation duration (mean±s.d.) (μs) | Peak attenuation level (mean±s.d.) | Total | Initiated |
| First | 33%–40% | 3 (4 μs) | 13.9 | 25.1 | 9.5 k | 2 | 23.8±13.1 | 0.18±0.12 | 910 | 267 |
| 6 (8μs) | 32.2±11.9 | 0.30±0.13 | 910 | 622 | ||||||
| 12 (16μs) | 37.3±9.4 | 0.48±0.18 | 910 | 754 | ||||||
| Second | 33%–40% | 3 | 13.9 | 25.1 | 9.5 k | 2 | 23.8±13.1 | 0.18±0.12 | 910 | 267 |
| 15.5 | 31.9 | 12.4 k | 42.5±13.5 | 0.40±0.20 | 910 | 746 | ||||
| 17.1 | 39.7 | 15.6 k | 64.4±11.5 | 0.74±0.17 | 910 | 902 | ||||
| Third | 22%–24% | 3 | 15.5 | 31.9 | 12.4 k | 0.5 | N/A | N/A | 200 | None |
| 2 | 42.9±6.0 | 0.68±0.15 | 200 | 171 | ||||||
| 5 | 80.4±24.3 | 0.76±0.21 | 98 | 90 | ||||||
| Fourth | 10 | 67.6±11.1 | 0.71±0.23 | 98 | 90 | |||||
| Fifth | 20 | 82.2±20.1a | 0.82±0.13a | 98 | 90 | |||||
At PRF of 20 kHz, there was a consistent pattern between pairs of pulses with one pulse producing a bubble cloud and the subsequent pulse prolonging and collapsing it. So the attenuation duration was calculated by the duration of light attenuation generated by every two pulses.
FIG. 1.

Examples of light attenuation signals caused by the bubble cloud generated by histotripsy pulses using different pulse parameters. The axes for the wave form are the same for each row and shown on the right. Arrows indicate the arrival of the pulse. The pulse parameters and corresponding light attenuation results are listed in Table I.
FIG. 2.

Images of the bubble cloud generated in free water created by a single histotripsy pulse at different pulse durations. The histotripsy pulse was delivered from the left to the right of each image. The overall size of the bubble cloud increased with increasing pulse duration. The ruler on the top of each image has markings of 1 mm on the right side and 0.5 mm on the left.
FIG. 3.
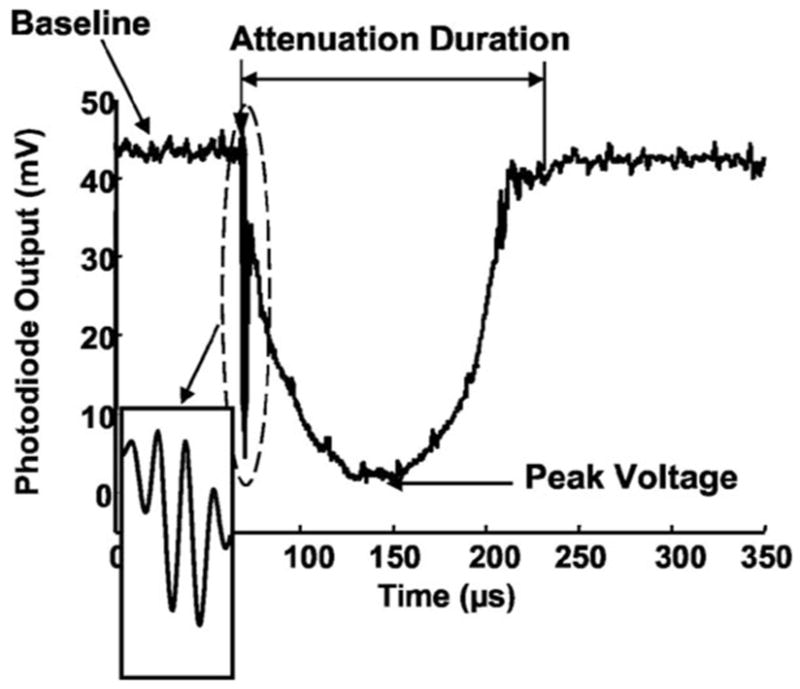
Example of the light attenuation signal caused by a bubble cloud, recorded as the photodiode voltage output. The bubble cloud was generated by a three-cycle (4-μs) pulse at a tissue-water interface with 98%–100% gas concentration. The left arrow below “Attenuation Duration” indicates the arrival of the histotripsy pulse at the transducer focus where the laser beam was projected. The insert is an expanded view (expanded in the horizontal direction and compressed in the vertical) of the artifact in the light attenuation signal during the histotripsy pulse, which tracks the pulse wave form.
TABLE II.
Attenuation durations (mean±s.d.) generated by a single pulse to study the effects of the gas concentrations and a tissue boundary.
| Pulse Duration |
|||||
|---|---|---|---|---|---|
| Environment | Gas concentration | Three cycles (μs) | Six cycles (μm) | Twelve cycles (μs) | Twenty four cycles (μs) |
| Free water | 24%–26% | Nonea | 139±66 | 173±33 | 219±60 |
| 98%–100% | 76±55 | 173±53 | 744±243 | 936±375 | |
| Tissue-water interface | 24%–26% | 111±34 | 148±69 | 210±15 | 226±14 |
| 98%–100% | 149±48 | 409±172 | 1066±400 | 2017±276 | |
Only the artifact during the histotripsy pulse was observed, no light attenuation was detected after the pulse.
TABLE III.
Peak attenuation levels (mean±s.d.) generated by a single pulse to study the effects of the gas concentrations and a tissue boundary.
| Pulse duration |
|||||
|---|---|---|---|---|---|
| Environment | Gas concentration | Three cycles | Six cycles | Twelve cycles | Twenty cycles |
| Free water | 24%–26% | None | 0.58±0.41 | 0.81±0.21 | 0.93±0.13 |
| 98%–100% | 0.16±0.09 | 0.79±0.27 | 1±0 | 0.96±0.06 | |
| Tissue-water interface | 24%–26% | 0.40±0.29 | 0.70±0.24 | 0.96±0.05 | 0.99±0.02 |
| 98%–100% | 0.84±0.22 | 1±0a | 0.98±0.04 | 1±0a | |
A peak attenuation level of 1 corresponds to the complete blockage of the light beam by bubbles.
FIG. 4.
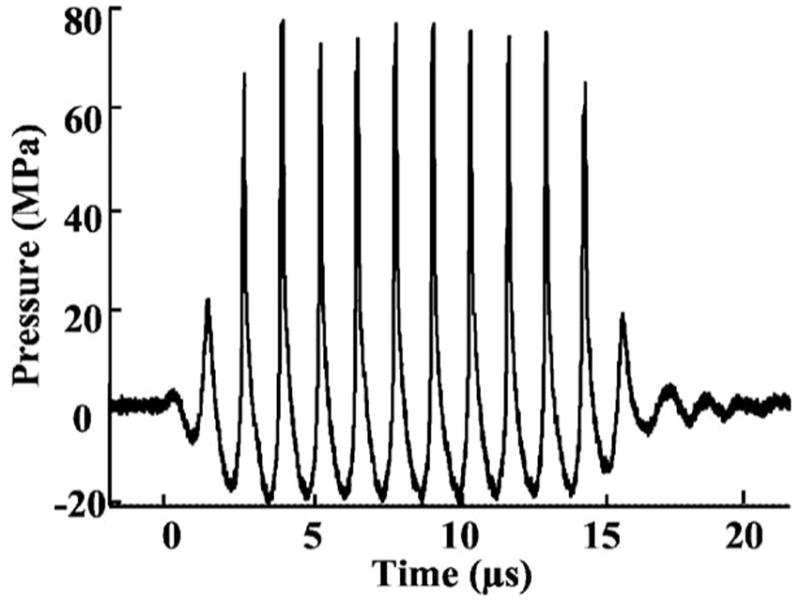
Acoustic pressure wave form of a ten-cycle (14-μs) histotripsy pulse in water at the transducer focus. For this pulse, the peak rarefactional pressure was 21 MPa and the peak compressional pressure was 76 MPa.
B. Tissue sample preparation
Fresh porcine atrial wall tissue (1 to 2 mm thick) was obtained from a local abattoir and used within 24 h of harvesting. All tissue specimens were preserved in a 0.9% sodium chloride solution at 4 °C. Tissue was wrapped over ring-shaped tube fitting (2 cm in diameter), so that no tissue interfered with the laser beam. The tissue was submerged in water of desired gas concentration in room temperature (~22 °C) for an hour prior to experimentation. The partial pressure of oxygen (PO2) in the water was used as our metric for gas concentration and was measured with an YSI dissolved oxygen meter (Model 5000, YSI, Yellow Springs, OH).
C. Optical attenuation detection
The optical attenuation method monitors the light transmission and detects the light beam reduction caused by bubbles. The schematic diagram of the experimental setup is shown in Fig. 5. Bubble clouds were produced in a 30-cm-wide × 60-cm-long × 30-cm-high water tank designed to enable optical observations. A 1-mW helium-neon gas laser (Model. 79245, Oriel, Stratford, CT) was placed on one side of the tank to emit a laser beam which traveled through the ultrasound focus (and in front of the tissue at a tissue-water interface). The light intensity was monitored continuously by a photodiode (Model DET100, ThorLabs, Newton, NJ) aligned with the laser beam at the other side of the tank.
FIG. 5.

Diagram of the experimental arrangement for bubble cloud monitoring at a tissue-water interface using an optical attenuation method. Light source and camera (in dashed circle) are setup for high speed imaging in water. However, at a tissue-water interface, the light source was blocked by the tissue, and the imaging could not be used with the optical attenuation detection system.
To align the laser beam through the ultrasound focus, the therapy transducer was first pulsed in free water to create a visible bubble cloud at its focus. Photos of the bubble cloud taken by a high speed camera are shown in Fig. 2. The position of the transducer was adjusted to direct the laser beam through the center of the bubble cloud by visual alignment. To form a tissue-water interface, a piece of porcine atrial wall was placed parallel and immediately behind (<1 mm) the laser beam. The laser beam width (0.48 mm at 1/e2) was smaller than the bubble cloud, so the photodiode measured the light transmitted through a portion of the bubble cloud and not the whole cloud. However, since the bubbles within the cloud appeared to grow and shrink together,17 the dynamics of a portion of the bubble cloud is considered here as indicative of the dynamics of the overall bubble cloud.
The attenuated light signal was recorded as the voltage output of the photodiode. The photodiode output was connected to a digital oscilloscope (Model 9384L, LeCroy Chestnut, NY) using a 1-MΩ dc coupling in parallel with a 250-Ω resistor. An impedance of 250 Ω was chosen to achieve a good signal to noise ratio (30–35 dB) and a wide enough dynamic range (60 dB) for attenuation detection, while still maintaining good temporal resolution (−3-dB width response time of 15 ns). The acquisition of the optical signals was synchronized with the acoustic therapy pulse.
An example of a light attenuation signal is demonstrated in Fig. 3, in which the light intensity began to decrease at the arrival of a single 4-μs histotripsy pulse (produced by a three-cycle pulse driving signal at 750 kHz) at a tissue-water interface. The light intensity continued to decrease for 78 μs after the end of the histotripsy pulse before it recovered to the baseline (164 μs after the arrival of the histotripsy pulse). During the time window when the histotripsy pulse propagated through the laser beam, the light attenuation signal seemed to track the ultrasound pulse wave form (insert in Fig. 3). This acousto-optic effect is most likely due to changes in the index of refraction of water during the histotripsy pulse. It provides a convenient timing indicator for locating the histotripsy pulse with respect to the generated bubble cloud and was discussed in detail in our previous paper on optical monitoring of histotripsy generated bubbles.16
Researchers have used optical scattering and reflection signals from bubbles to effectively trace radius-time curves generated by a lithotripsy pulse.25,27,40 Based on these studies, duration of the light attenuation (attenuation duration) is believed to indicate the duration of growth and collapse of a bubble cloud. The attenuation duration is defined as the period of time when the light intensity (photodiode output) falls below a threshold of baseline minus 3 times the noise level. The baseline and noise level are mean and standard deviation (s.d.) values, respectively, of the photodiode output receiving the laser light before the arrival of the histotripsy pulse (i.e., when no bubbles are present). The peak amplitude of the light attenuation signal is affected by the size and number of the bubbles within the laser beam. The peak attenuation level is defined as the difference between the baseline and the peak voltage divided by the baseline level, ranging between 0 and 1. The peak voltage is calculated excluding the light attenuation signal which tracks the ultrasound wave form during the histotripsy pulse.
Our previous optical monitoring and high speed imaging results have shown that initiation and extinction of the light attenuation correspond well to formation and disappearance of the bubble cloud.16 Therefore, the light attenuation duration and peak attenuation level were only calculated when the light attenuation was initiated, i.e., when the bubbles were generated. Initiation of light attenuation occurs when the light attenuation duration exceeds the pulse duration for five consecutive pulses. Extinction of light attenuation occurs when, after initiation, the light attenuation duration drops below the pulse duration for five consecutive pulses. The purpose of using pulse duration as a threshold is to overcome the light attenuation increase due to the ultrasound induced water index of refraction change.
D. Optical imaging
Images of bubble clouds were taken by a high speed digital imaging system (Model Phantom V9, Vision Research, Wayne, NJ) at a frame rate of 7 kHz and a shutter speed of 10 μs. The imaging system was placed outside the water tank approximately 100 mm away from the bubble cloud. The bubble cloud was illuminated by a strong light source (Carousel 4400 Projector light, Kodak, Rochester NY) at a ~30° angle with respect to the camera (Fig. 5). An optical lens with a focal length of 50–100 mm (Zoom Nikkor, Nikon, Japan)was mounted in front of the imaging system to increase the magnification. The imaging system was only used to image the bubble cloud in free water. At a tissue-water interface, the light source was blocked by the tissue and the imaging could not be used with the optical attenuation detection system (Fig. 5).
E. Specific studies
We investigated the dependence of the bubble cloud dynamics on pulse parameters and dissolved gas concentration in the fluid where tissue erosion occurs. Pulse parameters studied included pulse duration, peak rarefactional pressure, and PRF. We also compared the dynamics of the bubble cloud created at a tissue-water interface and in free water to determine the influence of the soft tissue boundary on bubble activity.
To investigate the dependence of the bubble cloud on pulse duration, peak rarefactional pressure, and PRF, multiple (100–910) pulses were used. We recorded optical light attenuation signals and calculated the attenuation duration and peak attenuation levels of initiated optical attenuation signals. Table I lists the pulse parameters and gas concentration ranges used in each specific study and corresponding light attenuation duration and peak attenuation level results (mean±s.d.). Pulse duration in the following refers to the number of cycles in the pulse driving signal applied to the transducer at 750 kHz.
To study the dependence of the bubble cloud on gas concentration and tissue boundary, a single pulse was used to generate the bubble cloud. The bubble cloud was created in free water and at a tissue-water interface. The purpose of using a single pulse was to monitor the bubble cloud without the influence from adjacent pulses. Gas concentration ranges of 24%–26% and 98%–100% were tested. The same peak rarefactional pressure was used, but the focal pressure field could not be successfully measured due to the rapid onset of cavitation. Between three and eight data points made up the sample for each combination of parameters.
III. RESULTS
A. Effects of pulse duration
The duration of light attenuation results show that the collapse cycle of bubble clouds generated by histotripsy pulses was much longer than the pulse duration itself. The attenuation duration increased with increasing pulse duration at a tissue-water interface (Table I and the first row of Fig. 1) such that the attenuation durations (mean±s.d.) were 23.8±13.1, 32.2±11.9, and 37.3±9.4 μs for pulse duration of three cycles, six cycles, and twelve cycles, respectively (T-test p value<0.001 for each pair). A peak rarefactional pressure of 13.9 MPa, a PRF of 2 kHz, a total of 910 pulses, and a gas concentration of 33%–40% were used for all pulse durations. Out of the 910 pulses, the number of pulses which initiated the optical attenuation signal also increased with increasing pulse duration (Table I).
The increasing trend of attenuation duration with pulse duration was even more evident in bubble clouds produced at a higher peak rarefactional pressure (>21 MPa) and higher gas concentration (98%–100%) (Table II). The attenuation durations (mean±s.d.) were 149±48 and 1066±400 μs for pulse durations of three cycles and twelve cycles, respectively (T-test p value<0.001). This indicates a seven-fold increase in the attenuation duration for a four-fold increase in pulse duration.
The peak attenuation level is affected by the size and number of the bubbles within the laser beam and this attenuation measure increased with increasing pulse durations (Table I, the first row of Fig. 1). The mean±s.d. of the peak attenuation level was 0.18±0.12 for three-cycle pulses, 0.30±0.13 for six-cycle pulses, and 0.48±0.18 for twelve-cycle pulses (T-test p value<0.001 for each pair).
Figure 2 depicts the high-speed camera images of bubble clouds created by a single histotripsy pulse at different pulse durations in gas saturated water. Images of bubble clouds showed that the bubble cloud dimensions were larger with longer pulse duration. The bubble cloud diameters along the lateral/axial acoustic beam direction were approximately 1.1/5.5, 2.7/6.9, 4.5/7.9, and 4.6/8.2 mm for pulse durations of three cycles, ten cycles, thirty cycles, and one-hundred cycles, respectively. This finding is consistent with the optical attenuation result showing that the peak attenuation level increased with increasing pulse duration (Table III).
B. Effects of peak rarefactional pressure
The attenuation duration lengthened as the peak rarefactional pressure increased (Table I and the second row of Fig. 1). The resulting increase in the attenuation duration was greater than the increase in peak rarefactional pressure. The attenuation durations (mean±s.d.) were 23.8±13.1, 42.5±13.5, and 64.4±11.5 μs for peak rarefactional pressures of 13.9, 15.5, and 17.1 MPa, respectively (T-test p value<0.001 for each pair). A nearly three-fold increase in attenuation duration resulted from a 23% increase in peak rarefactional pressure (e.g., at peak rarefactional pressures of 13.9 and 17.1 MPa). A pulse duration of three cycles, a PRF of 2 kHz and a total of 910 pulses, and a gas concentration of 33%–40% were used for all variations of peak rarefactional pressures. The number of initiated pulses also increased with increasing peak rarefactional pressure (Table I).
The peak attenuation level was greater with higher peak rarefactional pressure (Table I and the second row of Fig. 1). The peak attenuation levels (mean±s.d.) were 0.18±0.12, 0.40±0.20, and 0.74±0.17 for peak rarefactional pressures of 13.9, 15.5, and 17.1 MPa, respectively (T-test p value <0.001 for each pair). Again this is approximately three-fold increase in peak attenuation level when changing peak rarefactional pressure by only 23%.
C. Effects of PRF
PRF values ranging from 500 Hz to 20 kHz were tested. A pulse duration of three cycles, a peak rarefactional pressure of 15.5 MPa, and gas concentration of 22%–24% were used for all PRFs. When the PRF was too low, the light attenuation could not be initiated and the light attenuation was never initiated at the 500-Hz PRF (Table I and Fig. 1).
When the PRF was above the threshold to initiate the light attenuation signal, the attenuation duration increased with increasing PRF. The attenuation durations (mean±s.d.) were 42.9±6.0 μs for PRF of 2 kHz and 80.4±24.3 μs for PRF of 5 kHz (Table I and the third row of Fig. 1; T-test p value <0.001). This remained true when the pulse repetition period was longer than the attenuation duration, i.e., when the next pulse arrived after the collapse of the bubble cloud created by the previous pulse. After the primary light attenuation, rebounds of the bubble cloud were detected as additional light attenuation for some pulses. The number of pulses that produced rebounds was greater with higher PRF.
When the PRF was too high and the next pulse arrived before the collapse of the previous bubble cloud or the rebound of the previous cloud, the collapse of the previous cloud was disrupted, and the generation of the new cloud was also inhibited. As a result, only a portion of the pulses effectively generated and collapsed the bubble cloud. At a PRF of 10 kHz, approximately one-quarter of the pulses arrived before the collapse of the previous bubble cloud or the previous cloud rebound. In these cases, the light attenuation signals never fully recovered to the baseline (i.e., the collapse of previous bubble cloud did not occur completely or did not occur at all) (the fourth row of Fig. 1). The light attenuation did increase again after the arrival of the next pulse. At a PRF of 20 kHz, the next pulse always arrived before the collapse of the previous bubble cloud. There was a relatively consistent pattern within pairs of pulses with one pulse producing a bubble cloud and the subsequent pulse prolonging and collapsing it (the fifth row of Fig. 1).
There was no discernible trend of the peak attenuation level with PRF when the bubble cloud was initiated. No significant statistical difference was observed in the initiated attenuation level at PRFs of 2, 5, 10, and 20 kHz (T-test p value>0.05 for each peak attenuation level pair).
D. Effects of gas concentration
The light attenuation duration increased with increasing gas concentration. This trend was observed in free water and at a tissue-water interface (Table II). At a tissue-water interface, the attenuation durations (mean±s.d.) generated by the same single twenty-four-cycle pulse were 226±14 μs and 2017±276 at gas concentration ranges of 24%–26% and 98%–100%, respectively (Table II). This shows almost a full order of magnitude difference (T-test p value=0.003).
The peak attenuation level was also greater with higher gas concentration. This observation was consistent in free water and at a tissue-water interface (Table III). At a tissue-water interface, peak attenuation levels (mean±s.d.) generated by a single three-cycle pulse were 0.40±0.29 and 0.84±0.22 for gas concentration ranges of 24%–26% and 98%–100%, respectively (T-test p value=0.005).
E. Effects of tissue boundary tissue-water interface versus free water
The attenuation duration increased with increasing pulse duration and gas concentration both at a tissue-water interface and in free water using a single pulse (Table II). However, the collapse cycle of the bubble cloud was longer at a tissue-water interface than in free water, as indicated by the longer attenuation duration (Table II). For example, the attenuation durations (mean±s.d.) produced by a single six-cycle pulse with a gas concentration of 98%–100% was 173±53 μs in free water and 409±172 μs at a tissue-water interface (T-test p value=0.009).
The peak attenuation level also increased with increasing pulse duration and gas concentration both at a tissue-water interface and in free water (Table III). The peak attenuation level was greater at a tissue-water interface than in free water (Table III). The peak attenuation levels (mean±s.d.) produced by a single three-cycle pulse with a gas concentration of 98%–100% were 0.16±0.09 and 0.84±0.22 in free water and at a tissue-water interface, respectively (T-test p value=0.0001).
IV. DISCUSSION
The optical monitoring results show that the dynamics of the bubble cloud generated by histotripsy pulses depend on the pulse parameters. The light attenuation duration results suggest that the collapse cycle of the bubble cloud increased with increasing pulse duration and peak rarefactional pressure. The collapse cycle of the bubble cloud was greater with higher PRF when the next pulse arrived after the collapse of the previous bubble cloud. When the PRF was too high and the next pulse arrived before the collapse of the previous cloud, only a portion of the pulses effectively generated and collapsed the bubble cloud. Further, the peak attenuation level results suggest that the size and number of the bubbles in the cloud increased with increasing pulse duration and peak rarefactional pressure.
These results shed light on the dependence of histotripsy induced tissue erosion on pulse parameters observed in our in vitro tissue experiments.12,22,30 One important observation is that erosion is more energy efficient at a certain PRF12 than others. Based on the optical monitoring results, when the pulse repetition period is longer than the bubble cloud collapse cycle, the collapse cycle of the bubble cloud increased with increasing PRF. Consequently, at higher PRF, more cavitational nuclei from the previous collapse are available to provide seeds for the next pulse, resulting in greater erosion efficiency. When the PRF is too high and the next pulse arrives before the collapse of the previous bubble cloud, the collapse of the cloud is adversely affected, leading to reduced erosion efficiency. Therefore, the most energy efficient erosion only occurs when the timing of the next pulse (i.e., PRF) is “just right.” Based on results from this paper, the most efficient PRF should be between 5 and 10 kHz at a pulse duration of three cycles and a peak rarefactional pressure of 15.5 MPa. However, the most energy efficient PRF from our previous in vitro experiment12 at a pulse duration of three cycles is ~14 kHz. This difference could be attributed to the lower peak rarefactional pressure (11.6 MPa) used in the in vitro experiment. As the collapse cycle of the bubble cloud decreases with decreasing peak rarefactional pressure, the most efficient PRF is expected to be higher at a lower pressure. We used a greater peak rarefactional pressure for optical monitoring as the pressure level used in the in vitro study could not generate a large enough bubble cloud to be detected by the optical system with a good signal-to-noise ratio.
Another in vitro result shows that the axial erosion rate is slower and the erosion area is significantly larger at high pulse intensity (ISPPA>5000 W/cm2).30 This may be explained by the effects of pulse pressure/intensity on the optical attenuation signals. The peak attenuation level increases with increasing peak rarefactional pressure, which suggests a greater number and/or size of bubbles in the cloud. The cloud may induce a “shadowing” effect where ultrasound energy is scattered by bubbles, slowing down the erosion in the center. But more and/or larger bubbles may increase local scattering, thereby increasing the peripheral erosion.
Our optical monitoring results of the dynamics of bubble clouds generated by histotripsy pulses are generally consistent with published studies on bubble clouds generated by lithotripsy pulses. Researchers have shown an increasing dependence of the bubble cloud collapse cycle on peak rarefactional pressure in water41 and in tissue.27 Previous PRF studies42,43 have demonstrated that the number of cavitation bubbles increases with increasing PRF (below 1 kHz), as more residual bubbles from the previous pulse can serve as cavitation nuclei for the subsequent pulse.
In addition to pulse parameters, the dissolved gas content in the fluid also affects the bubble cloud dynamics. At higher gas concentration, the collapse cycle of the bubble cloud is longer and the number and/or size of bubbles are greater, which is likely due to the greater availability of gas to form bubbles. This result is consistent with our in vitro observation of a shorter time to initiate the bubble cloud at higher gas concentration.22 When the gas concentration is high with pulse duration ⩾6 cycles, the peak attenuation levels were close to 1 and the standard deviations were low (close to zero). The peak attenuation level is the fractional value of the maximum light attenuation. A peak attenuation level of 1 indicated the complete blockage of light beam transmission by bubbles. When high gas concentration and long pulses were used, the size and number of bubbles within the generated bubble cloud could be high enough to block most of the light beam or the entire light beam.
The tissue boundary also affects the bubble cloud dynamics. For a bubble cloud generated by a single histotripsy pulse, the collapse cycle is longer at a tissue-water interface than in free water. The soft tissue boundary restricted the movement, expansion, and other dynamic changes of the bubbles, which may explain the collapse cycle difference. When multiple pulses are used, some additional factors also need to be considered. The tissue could reduce the effects of acoustic streaming and micro-streaming caused by the bubbles. The tissue surface may trap microbubbles and provide additional cavitation nuclei for subsequent pulses. The influence of a tissue boundary on bubble cloud dynamics using multiple pulses is more relevant to tissue erosion and needs further investigation.
In our current optical attenuation system, the laser beam only covered a portion of the cloud. However, since the bubbles within the cloud appeared to grow and shrink together,17 the dynamics of a portion of the bubble cloud may be generalizable to the whole bubble cloud. Future use of high speed photography will be necessary to confirm the assumption. In addition, the current optical system is not sensitive enough to detect small individual bubbles. The current optical system may be improved by widening the laser beam width using optical lenses, increasing laser power, using a photodetector array, and increasing the sensitivity of the photodetector. High-speed imaging is the most direct means to resolve the absolute sizes and spatial distribution of bubbles in the bubble cloud and will be used in a future study.
V. CONCLUSIONS
To investigate the mechanism of histotripsy induced tissue erosion, we used an optical method to monitor the dynamics of a bubble cloud generated by histotripsy pulses at a tissue-water interface. The optical results show that the bubble cloud dynamics depend on pulse parameters and dissolved gas content in water where the erosion occurs. The collapse cycle of the bubble cloud increased with increasing pulse duration, peak rarefactional pressure, and gas concentration. The collapse cycle of the bubble cloud also increased with PRF when the next pulse arrived after the collapse of the previous bubble cloud. When the PRF was too high such that the next pulse arrived before the collapse of the previous bubble cloud, the previous cloud could not collapse effectively. Furthermore, the collapse cycle of the bubble cloud was longer at a tissue-water interface than in free water. These effects of pulse parameters on bubble cloud dynamics may explain our previous in vitro results which demonstrated the dependence of tissue erosion on pulse parameters. The cavitating bubble cloud is sensitive to pulse parameters, allowing a huge parameter space for optimization.
Acknowledgments
The authors thank Dr. Steve Ceccio for generously providing his lab resources to this work. We want to thank Jessica Parsons for her help on calibration. We also would like to thank Dr. Xueding Wang for his support. This research has been funded by grants from the National Institutes of Health R01-HL077629 and Hitachi.
Contributor Information
Zhen Xu, Department of Biomedical Engineering, University of Michigan, Ann Arbor, Michigan 48109.
Timothy L. Hall, Department of Biomedical Engineering, University of Michigan, Ann Arbor, Michigan 48109
J. Brian Fowlkes, Department of Radiology and Department of Biomedical Engineering, University of Michigan, Ann Arbor, Michigan 48109.
Charles A. Cain, Department of Biomedical Engineering and Department of Electrical Engineering and Computer Science, University of Michigan, Ann Arbor, Michigan 48109
References
- 1.Fry FJ, Kossoff G, Eggleton RC, Dunn F. Threshold ultrasound dosages for structural changes in the mammalian brain. J Acoust Soc Am. 1970;48:1413–1417. doi: 10.1121/1.1912301. [DOI] [PubMed] [Google Scholar]
- 2.Dunn F, Fry FJ. Ultrasonic threshold dosages for the mammalian central nervous system. IEEE Trans Biomed Eng. 1971;18:253–256. doi: 10.1109/tbme.1971.4502847. [DOI] [PubMed] [Google Scholar]
- 3.Frizzell LA, Lee CS, Aschenbach PD, Borrelli MJ, Morimoto RS, Dunn F. Involvement of ultrasonically induced cavitation in hind limb paralysis of the mouse neonate. J Acoust Soc Am. 1983;74:1062–1065. doi: 10.1121/1.389941. [DOI] [PubMed] [Google Scholar]
- 4.ter Haar GR, Daniels S, Morton K. Evidence for acoustic cavitation in vivo: Threshold for bubble formation with 0.75-MHz continuous-wave and pulsed beam. IEEE Trans Ultrason Ferroelectr Freq Control. 1986;33:162–164. doi: 10.1109/t-uffc.1986.26809. [DOI] [PubMed] [Google Scholar]
- 5.Fowlkes JB, Carson PL, Chiang EH, Rubin JM. Acoustic generation of bubbles in excised canine urinary bladders. J Acoust Soc Am. 1991;89:2740–2744. doi: 10.1121/1.400713. [DOI] [PubMed] [Google Scholar]
- 6.Hynynen K. Threshold for thermally significant cavitation in dog’s thigh muscle in vivo. Ultrasound Med Biol. 1991;17:157–169. doi: 10.1016/0301-5629(91)90123-e. [DOI] [PubMed] [Google Scholar]
- 7.Chapelon JY, Margonari J, Vernier F, Gorry F, Ecochard R, Gelet A. In vivo effects of high-intensity ultrasound on prostatic adenocarcinoma Dunning R3327. Cancer Res. 1992;52:6353–6357. [PubMed] [Google Scholar]
- 8.Smith NB, Hynynen K. The feasibility of using focused ultrasound for transmyocardial revascularization. Ultrasound Med Biol. 1998;24:1045–1054. doi: 10.1016/s0301-5629(98)00086-6. [DOI] [PubMed] [Google Scholar]
- 9.Tran BC, Seo J, Hall TL, Fowlkes JB, Cain CA. Microbubble-enhanced cavitation for noninvasive ultrasound surgery. IEEE Trans Ultrason Ferroelectr Freq Control. 2003;50:1296–1304. doi: 10.1109/tuffc.2003.1244746. [DOI] [PubMed] [Google Scholar]
- 10.Debus J, Peschke P, Hahn EW, Lorenz WJ, Lorenz A, Ifflaender H, Zabel HJG, van Kaick G, Pfeiler M. Treatment of the Dunning prostate rat tumor R3327-AT1 with pulsed high energy ultrasound shock waves (PHEUS): Growth delay and histomorphologic changes. J Urol (Baltimore) 1991;146:1143–1146. doi: 10.1016/s0022-5347(17)38027-8. [DOI] [PubMed] [Google Scholar]
- 11.Coleman AJ, Kodama T, Choi MJ, Adams T, Saunders JE. The cavitation threshold of human tissue exposed to 0.2-MHz pulsed ultrasound: Preliminary measurements based on a study of clinical lithotripsy. Ultrasound Med Biol. 1995;21:405–417. doi: 10.1016/0301-5629(94)00116-u. [DOI] [PubMed] [Google Scholar]
- 12.Xu Z, Ludomirsky A, Eun LY, Hall TL, Tran BC, Fowlkes JB, Cain CA. Controlled ultrasound tissue erosion. IEEE Trans Ultrason Ferroelectr Freq Control. 2004;51:726–736. doi: 10.1109/tuffc.2004.1308731. [DOI] [PMC free article] [PubMed] [Google Scholar]
- 13.Parsons JE, Cain CA, Abrams GD, Fowlkes JB. Pulsed cavitational ultrasound therapy for controlled tissue homogenization. Ultrasound Med Biol. 2006;32:115–129. doi: 10.1016/j.ultrasmedbio.2005.09.005. [DOI] [PubMed] [Google Scholar]
- 14.Roberts WW, Hall TJ, Ives K, Wolf JJS, Fowlkes JB, Cain CA. Pulsed cavitational ultrasound: A noninvasive technology for controlled tissue ablation (histotripsy) in the rabbit kidney. J Urol (Baltimore) 2006;175:734–738. doi: 10.1016/S0022-5347(05)00141-2. [DOI] [PubMed] [Google Scholar]
- 15.Vlahos AP, Lock JE, McElhinney DB, van der Velde ME. Hypoplastic left heart syndrome with intact or highly restrictive atrial septum: Outcome after neonatal transcatheter atrial septostomy. Circulation. 2004;109:2326–2330. doi: 10.1161/01.CIR.0000128690.35860.C5. [DOI] [PubMed] [Google Scholar]
- 16.Xu Z, Fowlkes JB, Cain CA. Optical and acoustic monitoring of bubble cloud dynamics at a tissue-fluid interface in ultrasound tissue erosion. J Acoust Soc Am. 2007;121:2421–2430. doi: 10.1121/1.2710079. [DOI] [PMC free article] [PubMed] [Google Scholar]
- 17.Xu Z, Raghavan M, Hall TL, Chang C-H, Mycek M-A, Fowlkes JB, Cain CA. High speed imaging of bubble cloud in pulsed cavitational ultrasound therapy—Histotripsy. Proceedings of the IEEE International Ultrasonics Symposium; Vancouver, Canada. 3–6 October 2006. [Google Scholar]
- 18.Pishchalnikov YA, Sapozhnikov OA, Bailey MR, Williams JCJ, Cleveland RO, Colonius T, Crum LA, Evan AP, McAteer JA. Cavitation bubble cluster activity in the breakage of kidney stones by lithotripter shockwaves. J Endourol. 2003;17:435–446. doi: 10.1089/089277903769013568. [DOI] [PMC free article] [PubMed] [Google Scholar]
- 19.Zabolotskaya EA, Ilinskii YA, Meegan GD, Hamilton MF. Bubble interactions in clouds produced during shock wave lithotripsy. IEEE Ultrasonics Symposium; Montreal, Quebec, Canada. 23–27 August 2004; pp. 890–893. [Google Scholar]
- 20.Arora M, Junge L, Ohl CD. Cavitation cluster dynamics in shock-wave lithotripsy. 1. Free field. Ultrasound Med Biol. 2005;31:827–839. doi: 10.1016/j.ultrasmedbio.2005.02.007. [DOI] [PubMed] [Google Scholar]
- 21.Matsumoto Y. Bubble and bubble cloud dynamics. 15th International Symposium on Nonlinear Acoustics; Gottingen, Germany. 1–4 September 1999; pp. 65–74. [Google Scholar]
- 22.Xu Z, Fowlkes JB, Rothman ED, Levin AM, Cain CA. Controlled ultrasound tissue erosion: The role of dynamic interaction between insonation and microbubble activity. J Acoust Soc Am. 2005;117:424–435. doi: 10.1121/1.1828551. [DOI] [PMC free article] [PubMed] [Google Scholar]
- 23.Church CC. A theoretical study of cavitation generated by an extracorporeal shock wave lithotripter. J Acoust Soc Am. 1989;86:215–227. doi: 10.1121/1.398328. [DOI] [PubMed] [Google Scholar]
- 24.Coleman AJ, Whitlock M, Leighton T, Saunders JE. The spatial distribution of cavitation induced acoustic emission, sonoluminescence and cell lysis in the field of a shock wave lithotripter. Phys Med Biol. 1993;38:1545–1560. doi: 10.1088/0031-9155/38/11/001. [DOI] [PubMed] [Google Scholar]
- 25.Jochle K, Debus J, Lorenz WJ, Huber P. A new method of quantitative cavitation assessment in the field of a lithotripter. Ultrasound Med Biol. 1996;22:329–338. doi: 10.1016/0301-5629(96)00031-2. [DOI] [PubMed] [Google Scholar]
- 26.Matula TJ, Hilmo PR, Bailey MR, Crum LA. In vitro sonoluminescence and sonochemistry studies with an electrohydraulic shock-wave lithotripter. Ultrasound Med Biol. 2002;28:1199–1207. doi: 10.1016/s0301-5629(02)00568-9. [DOI] [PubMed] [Google Scholar]
- 27.Huber P, Debus J, Peschke P, Hahn EW, Lorenz WJ. In vivo detection of ultrasonically induced cavitation by a fibre-optic technique. Ultrasound Med Biol. 1994;20:811–825. doi: 10.1016/0301-5629(94)90038-8. [DOI] [PubMed] [Google Scholar]
- 28.Coleman AJ, Choi MJ, Saunders JE. Detection of acoustic emission from cavitation in tissue during clinical extracorporeal lithotripsy. Ultrasound Med Biol. 1996;22:1079–1087. doi: 10.1016/s0301-5629(96)00118-4. [DOI] [PubMed] [Google Scholar]
- 29.Zhong P, Cioanta I, Cocks FH, Preminger GM. Inertial cavitation and associated acoustic emission produced during electrohydraulic shock wave lithotripsy. J Acoust Soc Am. 1997;101:2940–2950. doi: 10.1121/1.418522. [DOI] [PubMed] [Google Scholar]
- 30.Xu Z, Fowlkes JB, Ludomirsky A, Cain CA. Investigation of intensity threshold for ultrasound tissue erosion. Ultrasound Med Biol. 2005;31:1673–1682. doi: 10.1016/j.ultrasmedbio.2005.07.016. [DOI] [PMC free article] [PubMed] [Google Scholar]
- 31.Kieran K, Hall TL, Parsons JE, Wolf JS, Fowlkes JB, Cain CA, Roberts WW. Exploring the acoustic parameter space in ultrasound therapy: Defining the threshold for cavitational effects. Sixth International Symposium on Therapeutic Ultrasound; Oxford, UK. 30 August–2 September 2006; p. S01. [Google Scholar]
- 32.Ciaravino V, Flynn HG, Miller MW. Pulsed enhancement of acoustic cavitation: A postulated model. Ultrasound Med Biol. 1981;7:159–166. doi: 10.1016/0301-5629(81)90005-3. [DOI] [PubMed] [Google Scholar]
- 33.Atchley AA, Frizzell LA, Apfel RE, Holland CK, Madanshetty S, Roy RA. Thresholds for cavitation produced in water by pulsed ultrasound. Ultrasonics. 1988;26:280–285. doi: 10.1016/0041-624x(88)90018-2. [DOI] [PubMed] [Google Scholar]
- 34.Child SZ, Hartman CL, Schery LA, Carstensen EL. Lung damage from exposure to pulsed ultrasound. Ultrasound Med Biol. 1990;16:817–825. doi: 10.1016/0301-5629(90)90046-f. [DOI] [PubMed] [Google Scholar]
- 35.Holland CK, Apfel RE. Thresholds for transient cavitation produced by pulsed ultrasound in a controlled nuclei enviroment. J Acoust Soc Am. 1990;88:2059–2069. doi: 10.1121/1.400102. [DOI] [PubMed] [Google Scholar]
- 36.Huber P, Debus J, Jochle K, Siamiantonakis I, Jenne J, Rastert R, Spoo J, Lorenz WJ, Wannenmacher M. Control of cavitation activity by different shockwave pulsing regimes. Phys Med Biol. 1999;44:1427–1437. doi: 10.1088/0031-9155/44/6/301. [DOI] [PubMed] [Google Scholar]
- 37.Chang PP, Chen WS, Mourad PD, Poliachik SL, Crum LA. Thresholds for inertial cavitation in albunex suspensions under pulsed ultrasound conditions. IEEE Trans Ultrason Ferroelectr Freq Control. 2001;48:161–170. doi: 10.1109/58.895927. [DOI] [PubMed] [Google Scholar]
- 38.Parsons JE, Cain CA, Fowlkes JB. Cost-effective assembly of a basic fiber-optic hydrophone for measurement of high-amplitude therapeutic ultrasound fields. J Acoust Soc Am. 2006;119:1432–1440. doi: 10.1121/1.2166708. [DOI] [PubMed] [Google Scholar]
- 39.AIUM, Acoustic Output Measurement Standard for Diagnostic Ultrasound Equipment, UD2–98 (AIUM/NEMA, 1998).
- 40.Matula TJ, Hilmo PR, Storey BD, Szeri AJ. Radial response of individual bubbles subjected to shock wave lithotripsy pulses in vitro. Phys Fluids. 2002;14:913–921. [Google Scholar]
- 41.Choi MJ, Coleman AJ, Saunders JE. The influence of fluid properties and pulse amplitude on bubble dynamics in the field of a shock wave lithotripter. Phys Med Biol. 1993;38:1561–1573. doi: 10.1088/0031-9155/38/11/002. [DOI] [PubMed] [Google Scholar]
- 42.Huber P, Jochle K, Debuss J. Influence of shock wave pressure amplitude and pulse repetition frequency on the lifespan, size and number of transient cavities in the field of an electromagnetic lithotripter. Phys Med Biol. 1998;43:3113–3128. doi: 10.1088/0031-9155/43/10/029. [DOI] [PubMed] [Google Scholar]
- 43.Sapozhnikov OA, Khokhlova VA, Bailey MR, Williams JC, Jr, McAteer JA, Cleveland RO, Crum LA. Effect of overpressure and pulse repetition frequency on cavitation in shock wave lithotripsy. J Acoust Soc Am. 2002;112:1183–1195. doi: 10.1121/1.1500754. [DOI] [PubMed] [Google Scholar]