

Abstract
Short, high-intensity ultrasound pulses have the ability to achieve localized, clearly demarcated erosion in soft tissue at a tissue-fluid interface. The primary mechanism for ultrasound tissue erosion is believed to be acoustic cavitation. To monitor the cavitating bubble cloud generated at a tissue-fluid interface, an optical attenuation method was used to record the intensity loss of transmitted light through bubbles. Optical attenuation was only detected when a bubble cloud was seen using high speed imaging. The light attenuation signals correlated well with a temporally changing acoustic backscatter which is an excellent indicator for tissue erosion. This correlation provides additional evidence that the cavitating bubble cloud is essential for ultrasound tissue erosion. The bubble cloud collapse cycle and bubble dissolution time were studied using the optical attenuation signals. The collapse cycle of the bubble cloud generated by a high intensity ultrasound pulse of 4–14 μs was ~40–300 μs depending on the acoustic parameters. The dissolution time of the residual bubbles was tens of ms long. This study of bubble dynamics may provide further insight into previous ultrasound tissue erosion results.
I. INTRODUCTION
Tissue disintegration using ultrasound induced cavitation1–9 and shockwave generated tissue destruction10,11 have been observed by many researchers. Our recent studies have shown that short, high-intensity pulses delivered at certain pulse repetition frequencies (PRFs) can achieve complete mechanical tissue fragmentation.12–14 This technique can be considered as a form of soft tissue lithotripsy (“histotripsy”). At a tissue-fluid interface, histotripsy results in tissue erosion with sharply demarcated boundaries.12 Acoustic cavitation is the hypothesized primary mechanism for the erosion process, which is supported by a high amplitude and temporally changing acoustic backscatter observed during erosion. This highly variable backscatter is likely due to the sound reflection from a dynamically changing bubble cluster generated by high intensity ultrasound pulses. The bubbles behave as one dynamic unit, growing and shrinking together, and therefore this bubble cluster can be called a “bubble cloud” as defined by previous cavitation researchers.15–18
The temporally varying acoustic backscatter does not occur immediately at the onset of the ultrasound exposure. It takes a certain period of time (or certain number of pulses) to initiate this backscatter pattern, depending on the acoustic pulse parameters.19 The time to initiation is shorter at higher pressures. Initiation of this backscatter pattern is an excellent indicator of erosion (98% positive predication rate).19 After initiation, sometimes when the ultrasound pulses are still being delivered, the variable backscatter stops, which we label as extinction.19 When extinction occurs, tissue erosion ceases. The variable backscatter can be re-initiated again without changing the pulse parameters.19 The extinction and the re-initiation are both stochastic events. In this paper, we study the initiation and extinction by recording an optical attenuation signal and correlating it to the acoustic backscatter. The optical attenuation method detects intensity loss of the transmitted light through the bubble cloud. Further, we study the bubble cloud dynamics including cloud collapse cycle and bubble dissolution time using the optical attenuation method and high speed imaging.
The acoustic pressures effective for histotripsy are similar to those found in lithotripter shockwave pulses. Our histotripsy pulses are several acoustic cycles in duration instead of the one cycle pulses sometimes used in lithotripsy. The selection of pulse pressure, pulse duration and PRF affects the extent and efficiency of the mechanical tissue disruption induced by histotripsy.12,13,20,21 Shockwave lithotripsy studies have shown that positive pressure can compress existing bubbles, while following negative pressure can cause bubble growth and collapse. The growth and collapse cycles are long (hundreds of μs) compared to the lithotripsy pulse length (several μs). The bubble radius-time curve has been modeled22 and confirmed experimentally in vitro23–25 and in vivo.26–28 In this paper, we used the transmitted light signals to trace the growth and collapse cycle of the bubble cloud generated by histotripsy pulses.
The dissolution time of residual bubbles from the collapse has also been of great interest in cavitation studies.24,29 The residual bubbles can provide seeds for subsequent cavitation events.30,31 Therefore, the bubble dissolution time can be critical for the timing of the next pulse for controlling cavitational effects. We studied the bubble dissolution time by delaying a lower amplitude pulse which follows the high amplitude histotripsy pulse. The lower amplitude pulse generates a bubble cloud only when residual bubbles remained from the previous pulse to serve as cavitation nuclei. Dissolution time of residual bubble cavitation nuclei generated by the histotripsy pulse was determined by changing the delay time between the two pulses and monitoring subsequent bubble generation by the lower amplitude pulse.
II. METHODS
A. Ultrasound generation and calibration
Ultrasound pulses were generated by an 18-element pi-ezocomposite spherical-shell therapeutic array (Imasonic, S.A., Besançon, France) with a center frequency of 750 kHz and a geometric focal length of 100 mm. The therapy array has an annular configuration with outer and inner diameters of 145 and 68 mm, respectively, yielding a radiating area of ~129 cm2. All the array elements were excited together in phase. The array driving system, maintained under PC control, consists of channel driving circuitry, associated power supplies (Model 6030A, HP, Palo Alto, CA), and a software platform to synthesize driving patterns. A PC console also provided control of a motorized three-dimensional positioning system (Parker Hannifin, Rohnert Park, CA) to position the array at each exposure site.
The pressure wave form at the focus of the 18-element array in the acoustic field was measured in degassed water (12–25% concentration) (i.e., free-field conditions) using a fiber-optic probe hydrophone developed in house.32 The lateral and axial pressure profiles of the focused beam were measured to be 2.2 mm×12.6 mm in width (full width at half maximum), at peak negative pressure of 14 MPa and 1.8×11.9 mm at 19 MPa. The beam width decreased with increasing pressure. The peak negative and positive pressures and spatial-peak pulse-average intensity (ISPPA)33 used in experiments depicted in Figs. 4–10 were measured for free-field conditions and reported in Table I. The pressure levels used in other experiments (Figs. 2, 3, 11, and 12) could not be calibrated successfully due to the instantaneous cavitation. However, we were able to measure a peak negative pressure of 21 MPa and a peak positive pressure of 76 MPa at a lower power level without generation of bubbles during measurement.
FIG. 4.

Light attenuation, variable acoustic backscatter and corresponding bubble cloud imaging in water. (a) Light attenuation. Each vertical line is a light intensity signal corresponding to one ultrasound pulse, with light intensity encoded in gray color. Dark color indicates a decrease in the light intensity. The horizontal axis is pulse number. (b) The light attenuation duration for each pulse vs pulse number. (c) Acoustic backscatter in fast time-slow time display. Each vertical line is an A-line acoustic backscatter signal where the signal amplitude is encoded in gray color. (d) The normalized backscatter power moving SD vs pulse number. (e) Example bubble cloud image. Each image was taken 10 μs after the arrival of a 14 μs pulse. (f) Bubble cloud cross-sectional area vs pulse number. Horizontal arrows indicate the arrival of the histotripsy pulse.
FIG. 10.

Bubble cloud rebounds detected as the additional light attenuations (pointed by arrows) after the main light attenuation signal. The durations of the main light attenuation and the second peak are longer with higher pressure. Interestingly, the additional light attenuation peak in dashed circle always occurred at ~134 μs after the ultrasound pulse even as the pulse pressure increased.
TABLE I.
Acoustic parameters used in all figures.
| Fig. No. | Pulse duration | P−a (MPa) | P+b (MPa) | ISPPA (W/cm2) | PRF (Hz) | No. Pulse | PO2 | W/O Tissue | Att.d Duration (μs) |
|---|---|---|---|---|---|---|---|---|---|
| 2 | 4 μs (3 cycles) | >21c | >76c | >29.3 kc | N/A | 1 | 98–100% | Water | N/A |
| 3 | 8 μs (6 cycles) | >21c | >76c | >29.3 kc | N/A | 1 | 98–100% | Water | 187 |
| 4,5 | 14 μs (10 cycles) | 21 | 76 | 29.3 k | 10 | 200 | 98–100% | Water | 243.2±153.3 |
| 6 | 4 μs (3 cycles) | 17.1 | 52.9 | 19.3 k | 2 k | 910 | 33–40% | Water | N/A |
| 21 | 76 | 29.3 k | |||||||
| 7 | 4 μs (3 cycles) | 15.5 | 28.4 | 10.9 k | 2 k | 200 | 22–24% | Tissue | 40.1±6.1 |
| 8,9 | 4 μs (3 cycles) | 13.9 | 25.1 | 9.5 k | 200 | 910 | 98–100% | Tissue | 53.3±24.8 |
| 10 | 4 μs (3 cycles) | 13.9 | 25.1 | 9.5 k | 200 | 910 | 98–100% | Tissue | 87.0 |
| 15.5 | 28.4 | 10.9 k | 95.4 | ||||||
| 17.1 | 52.9 | 19.3 k | 113.1 | ||||||
| 11,12 | 8 μs (6 cycles) | >21c | >76c | >29.3 kc | N/A | 1 | 22–24% | Tissue | 288.2 |
| 5.2 | 6.6 | 1.1 k |
FIG. 2.

An image of the bubble cloud taken by a high speed camera. The bubble cloud was generated by a single pulse of three cycles in gas saturated free water. It was used for the laser beam alignment. The ultrasound pulse propagated from the left to the right side of the image.
FIG. 3.

Light attenuation signal caused by a bubble cloud recorded as a photodetector output. The bubble cloud was generated by a 6-cycle (8 μs) histotripsy pulse in water. The top left arrow indicates the arrival of the histotripsy pulse at the therapy transducer focus where the laser beam is projected. The inset is an expanded view (compressed in vertical direction and expanded in horizontal direction) of the optical signal tracking the ultrasound pulse wave form.
FIG. 11.

A bubble cloud was first generated by a high amplitude histotripsy pulse (p− >21 MPa, p+ >76 MPa) which caused the light attenuation. One ms after the onset of the histotripsy pulse, a lower amplitude pulse (p−=5.2 MPa, p+ =6.6 MPa) was delivered. The lower amplitude pulse, which could not produce a bubble cloud by itself, regenerated the bubble cloud resulting in another light attenuation. A pulse duration of 6 cycles and a gas concentration of 22–24% were employed.
FIG. 12.
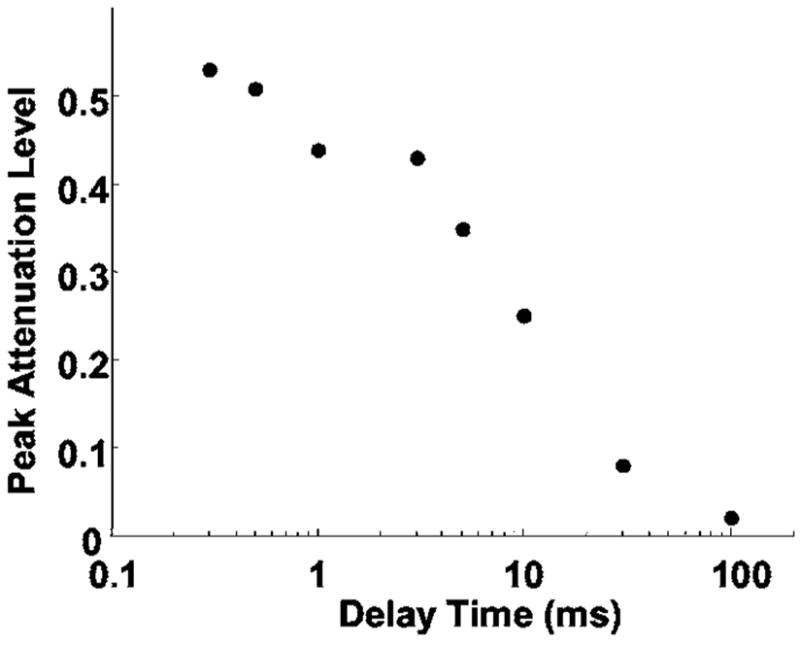
The peak attenuation level of the light attenuation caused by the lower amplitude pulse as a function of the delay time. The peak attenuation level has a linearly decreasing trend on a log scale x axis. On a linear scale, the peak attenuation level displayed an exponential-like decay.
B. Tissue sample preparation
Fresh porcine atrial wall tissue (1–2 mm thick) was obtained from a local abattoir and used within 24 h of harvesting. All tissue specimens were preserved in a 0.9% sodium chloride solution at 4 °C. Tissue was wrapped over ring-shaped tube fitting (2 cm in diameter), so that no tissue interfered with the laser beam. The tissue was degassed by submerging in degassed water for 1 h prior to experimentation.
C. Optical attenuation detection
The optical attenuation method monitors the light transmission and detects the light beam reduction caused by bubbles. The schematic diagram of the experimental setup is shown in Fig. 1. Bubble clouds were produced in a 30-cm-wide×60-cm-long×30-cm-high water tank designed to enable optical observations. A 1 mW helium-neon gas laser (Model. 79245, Oriel, Stratford, CT) was placed on one side of the tank to pass a laser beam through the ultrasound focus (and in front of the tissue at a tissue-water interface). The light intensity was monitored continuously by a photodiode (Model DET100, ThorLabs, Newton, NJ) aligned with the laser beam at the other side of the tank.
FIG. 1.

Experimental setup for bubble cloud monitoring at a tissue-water interface using optical attenuation and acoustic backscatter methods. Light source and CCD camera in dashed circle are set up for high speed imaging in water. However, at a tissue-water interface, the light source was blocked by the tissue and the imaging could not be used with the optical attenuation detection.
To direct the laser beam through the ultrasound focus, the therapy transducer was first pulsed in free water to create a visible bubble cloud at its focus. A photo of the bubble cloud taken by a high speed camera is shown in Fig. 2. The position of the transducer was adjusted to direct the laser beam through the center of the bubble cloud. To form a tissue-water interface, a piece of porcine atrial wall was placed parallel and right behind the laser beam. The laser beam width (0.48 mm @ 1/e2) was smaller than the bubble cloud, so the photodiode measured the light transmitted through a portion of the bubble cloud and not the whole cloud.
The attenuated light signal was recorded as the voltage output of the photodiode. The photodiode output was connected to a digital oscilloscope (Model 9384L, LeCroy Chestnut, NY) using a 1 MΩ dc coupling in parallel with a 250 Ω resistor. An impedance of 250 Ω was chosen to achieve a good signal to noise ratio (30–35 dB) and a wide enough dynamic range (60 dB) for attenuation detection, while still maintaining good temporal resolution (−3 dB width response time of 15 ns). The acquisition of the optical signals was synchronized with the acoustic therapy pulse.
An example of a light attenuation signal is demonstrated in Fig. 3, in which the light intensity began to decrease at the arrival of a single 8 μs histotripsy pulse (produced by a driving signal of 6 cycle pulse at 750 kHz) in water. During the time window when the ultrasound pulse propagated through the laser beam, the light attenuation signal seemed to track the ultrasound therapy pulse wave form (inset in Fig. 3). This acousto-optic “artifact” is most likely due to changing in the index of refraction of water during the therapy pulse. It provides a convenient timing indicator locating the therapy pulse with respect to the generated bubble cloud and will be discussed further in Results and Discussion.
Researchers have used optical scattering and reflection signals from bubbles to effectively trace radius-time curves generated by the lithotripsy pulse.24,26,34 Based on these studies, duration of the light attenuation (attenuation duration) is believed to indicate the bubble cloud collapse time. Attenuation duration is defined as the period of time when the light intensity (photodiode output) falls below a threshold of base line −3 times the noise level. The base line and noise level are mean and standard deviation (SD) values, respectively, of the photodiode output receiving the laser light when no bubbles are present. Initiation of light attenuation occurs when the light attenuation duration exceeds the pulse duration for five consecutive pulses. Extinction of light attenuation occurs when the light attenuation duration drops below the pulse duration for five consecutive pulses. The purpose of using pulse duration as a threshold is to overcome the light attenuation increase due to the ultrasound induced water index of refraction change. Although the threshold for attenuation reestablishing base line is arbitrary, varying the threshold slightly did not affect the detection of initiation and extinction events.
D. Acoustic backscatter
To receive the acoustic backscatter of therapy pulses, a 5 MHz, 2.5-cm-diam single element focused transducer (Valpey Fisher Corporation, Hopkinton, MA) with a 10 cm focal length was mounted confocally with the therapy array inside its inner hole. Acoustic backscatter signals were recorded and displayed as range-gated temporal voltage traces by a digital oscilloscope (Model 9384L, LeCroy, Chestnut Ridge, NY). The recorded wave forms were then transferred through general purpose interface bus and processed by the MATLAB program (Mathworks, Natick, MA).
Normalized acoustic backscatter power moving standard deviation (SD) was used to characterize the variability of backscatter which is described in our previous paper.19 As the acoustic backscatter was due to reflected therapy pulses, the backscatter power was first normalized to a reference proportional to the therapy pulse power, which was determined by reflection from a stainless steel reflector.35 Normalized backscatter power moving SD (moving window size=3) at a time point i was calculated as the standard deviation of backscatter power at point i, i−1, and i−2. The initiation and extinction of the temporally variable acoustic backscatter, relating to the beginning and suspension of erosion, were detected when the moving SD exceeds and falls below a threshold for five consecutive pulses, respectively.19
E. High-speed imaging
Images of a bubble cloud were captured by a fast gated, intensified 640×480 pixel, 12 bit, 11 frame/s charge coupled device (ICCD) camera (Picostar HR, La Vision, Goettingen, Germany).36 A shutter speed of 100 ns was used. The imaging system could store up to 200 images at one time. The bubble cloud image was taken when the ultrasound pulse was propagating through the transducer focus. The bubble cloud was illuminated at a forward 30° angle using a xenon arc lamp (Model. 60069 Q Series, Oriel, Stratford, CT). We were able to use high speed imaging and optical attenuation monitoring simultaneously in water. However, at a tissue-water interface, the imaging setup could not be used simultaneously with the optical attenuation setup, because the light illumination for imaging was blocked by tissue as indicated in Fig. 1.
The ICCD camera captured images by detecting and recording a count proportional to the photon number at each pixel. The bubble presence at each pixel was determined when the photon count exceeded a threshold of mean +3 SD of the photon count at this pixel with no bubbles. The camera captured the image of the bubble cloud along the axial direction of the ultrasound beam (Figs. 4 and 5). We estimated the axial cross-sectional area of the bubble cloud by integrating the area of pixels with bubbles.
FIG. 5.

Wave forms of synchronized light attenuation, acoustic backscatter signals and corresponding bubble cloud images from Fig. 4. The ultrasound pulse propagated from the left to the right side of the image. The short arrows in the top two rows indicate the arrival of the histotripsy pulse at the focus of the therapy transducer. The light attenuation (after the pulse) and variable acoustic backscatter signals were only detected when a bubble cloud was observed using high speed imaging. The insets in the top row are expanded views of the optical signal tracking ultrasound pulse wave form during the pulse.
III. RESULTS
A. Light attenuation signals and bubble cloud imaging
Figures 4 and 5 show light attenuation signals synchronized with images of bubble clouds generated by histotripsy pulses in water. Each bubble cloud image was captured when an ultrasound pulse was propagating through its focus. When a bubble cloud was observed using high speed imaging, the light attenuation was also observed during and after the ultrasound pulse propagated through the laser beam. When no bubble cloud was seen, no light attenuation was observed after the ultrasound pulse, although the light intensity signal tracked the ultrasound pulse wave form during the pulse. The correspondence between light attenuation signals and bubble clouds observed by high speed imaging suggests that the light attenuation was caused by the bubble cloud.
The imaged bubble clouds all appear to consist of multiple bubbles. The sizes of bubble clouds generated in water varied from pulse to pulse. In Fig. 4, the short diameter of the bubble cloud (along the lateral beam of the transducer) was 2–6 mm, and the long diameter (along the axial beam of the transducer) was 3–13 mm. The total cross-sectional area of bubble cloud ranged from 15 to 30 mm2.
In the absence of an observable bubble cloud, the light attenuation signal tracked the ultrasound wave form during the ultrasound pulse (Figs. 5 and 6). This signal was relatively constant for a given pulse pressure (Fig. 5) and its peak amplitude increased with increasing pressure (Fig. 6). These observations suggest that this signal is due to the water index of refraction change caused by pulse pressure fluctuations. The light signal which tracked the ultrasound wave form was also observed when a bubble cloud was seen (Fig. 5). In the presence of bubbles, it varied from pulse to pulse, even under the same pulse parameters (Fig. 5).
FIG. 6.

Optical attenuation signal tracking the ultrasound pulse wave form without the formation of a bubble cloud. The peak amplitude of the signal increased with increasing pressure.
B. Initiation and extinction
Initiation of a temporally varying acoustic backscatter signal corresponded well to initiation of light attenuation both in water (Fig. 4) and at a tissue-water interface (Fig. 7). As light attenuation was only detected when the bubble cloud was generated, this result provides evidence that initiation of the variable acoustic backscatter was due to bubble cloud formation. Figure 4 shows an example of the initiation of the variable acoustic backscatter and light attenuation signals in water. The variable backscatter was initiated at 1.1 s (12th pulse) after the onset of insonation and the light attenuation was initiated at 1.2 s (13th pulse). Figure 7 presents an example of initiations of both signals at a tissue-water interface. The variable backscatter was initiated at 10.5 ms (21st pulse) after the onset of insonation, while light attenuation began at 18 ms (36th pulse). The slight difference between the two initiations could be due to: (1) the acoustic backscatter being more sensitive for bubble detection than the light attenuation; and/or (2) the cavitating bubble cloud initiated outside the laser beam first and later grew larger or moved into the laser beam. The latter is supported by the temporal shift of the acoustic backscatter in Fig. 7(c) showing the bubble cloud growing or moving towards the source transducer after the initiation of the variable backscatter.
FIG. 7.

Initiations of the light attenuation and the variable acoustic backscatter at a tissue-water interface. Panels (a)–(d) display the light attenuation and acoustic backscatter signals in the format described in Fig. 4. Initiation of the variable backscatter corresponded well to initiation of the light attenuation.
The timing of extinction and re-initiation of the variable backscatter also corresponded well to the extinction and re-initiation of light attenuation. An example of extinction and re-initiation of the variable acoustic backscatter signal and light attenuation at a tissue-water interface is shown in Fig. 8. The corresponding wave forms are shown in Fig. 9. The light attenuation was only detected when the acoustic backscatter was of high amplitude and temporally, spatially changing. Parsons, Fowlkes, and Cain37 have shown that temporal, spatial variation in the backscatter pattern was required for producing significant mechanical breakdown of bulk tissue using high-intensity pulsed ultrasound. Sometimes a relatively high amplitude but temporally spatially constant acoustic backscatter was detected when no light attenuation was observed at a tissue-water interface (Fig. 8). This high amplitude but static backscatter was likely the reflection from bubbles trapped on the uneven surface of the tissue and not actively cavitating. The optical system could not detect these bubbles due to their position on the tissue surface where the light beam could not reach them, or alternatively, the optical beam was not aligned close enough to the tissue to detect them.
FIG. 8.

Extinctions and re-initiations of the light attenuation and the variable acoustic backscatter at a tissue-water interface. Panels (a)–(d) display the light attenuation and acoustic backscatter signals in the format described in Fig. 4.
FIG. 9.

Wave forms of light attenuation and acoustic backscatter signals in Fig. 8. The short arrows indicate the arrival of the histotrispy pulse at the focus of the therapy transducer. Variable backscatter was observed with light attenuation. Without light attenuation, a high amplitude but stable backscatter was observed.
We used a lower acoustic intensity for the tissue-water interface than in water alone, as the intensity threshold to initiate a bubble cloud detectable by the optical attenuation method appears to be lower at a tissue-water interface. The arrival of each therapy pulse at the transducer focus is indicated by an arrow in figures of optical attenuation and acoustic backscatter signals (Figs. 4–9). As the focal length of the therapy transducer was 100 mm, it took ~67 μs for the ultrasound therapy pulse to reach the laser beam and ~134 μs for acoustic backscatter detection.
C. Bubble cloud collapse cycle
The bubble cloud collapse cycle was detected by the duration of light attenuation (attenuation duration). The attenuation duration calculated from Figs. 3–12 ranged from 40–300 μs (Table I) which was 10–40× the ultrasound pulse duration (4–14 μs). In Fig. 3, a bubble cloud started to form at the arrival of a 6-cycle (8 μs) histotripsy pulse. It grew for over 100 μs as indicated by the light intensity decrease and collapsed when the light intensity returned to the base line level. The bubble cloud lasted for 187 μs before it collapsed to below the sensitivity level of the optical attenuation system (~20 times the duration of the histotripsy pulse). The pressure levels used in Fig. 3 could not be calibrated successfully due to the instantaneous cavitation. We measured a peak negative pressure of 21 MPa and a peak positive pressure of 76 MPa at a lower power level. The attenuation duration varied with different pulse parameters (e.g., pressure, pulse duration and PRF) and gas content in the fluid. For example, the attenuation duration was longer with higher pressure (Fig. 10), indicating a longer collapse cycle.
D. Bubble dissolution time
Although the optical attenuation method was not sensitive enough to detect the presence of bubbles following the collapse of the bubble cloud, residual bubbles survived long after the collapse. We measured the bubble dissolution time by delaying a lower amplitude pulse following the initial high amplitude histotripsy pulse. The lower amplitude pulse could not generate a bubble cloud itself. It had to use the residual bubbles produced by the previous high amplitude histotripsy pulse to recreate a bubble cloud. The dissolution time was determined by changing the delay time between the two pulses and monitoring the light attenuation caused by the subsequent lower amplitude pulse.
In Fig. 11, a high amplitude histotripsy pulse first created a bubble cloud at a tissue-water interface, causing light attenuation. The pressure levels of the high amplitude histotripsy pulse could not be calibrated successfully due to the instantaneous cavitation. The lower amplitude pulse (p− =5.2 MPa, p+ =6.6 MPa) was delivered 1 ms later and regenerated the bubble cloud using the residual cavitation nuclei from the previous pulse (Fig. 11).
The delay time between the two pulses was varied from 300 μs to 100 ms. Results show that the lower amplitude pulse caused the light attenuation up to 30 ms, suggesting an approximately 30 ms dissolution time of the residual bubbles after the cloud collapse. The peak light attenuation level produced by the lower amplitude pulse showed an exponential-like decrease versus delay time (Fig. 12). This decrease is probably the result of an overall decreasing number and/or size of residual bubbles (resulting cavitation nuclei) over time due to dissolution.
E. Bubble cloud rebounds
Besides the primary light attenuation following the arrival of ultrasound pulses, additional drops in the light intensity were detected. Indicated by arrows in Fig. 10, there were two additional attenuation peaks immediately following the primary peak. The duration of the second peak was longer at higher pulse pressure, as was the third. These subsequent light intensity peaks were likely due to bubble cloud rebounds. The number of rebounds changed with acoustic parameters (e.g., pressure, PRF, pulse duration).
However, the light intensity peak marked by dashed circle in Fig. 10 always arrived at ~134 μs after the ultrasound pulse, and remained the same even as the pressure increased. The value of 134 μs was the round trip travel time between the source transducer and its focus, which suggests that these peaks were caused by the bubble cloud being driven by the sound reverberation between the source transducer surface and the initial cloud.
IV. DISCUSSION
In this paper, we monitored the intensity attenuation of light transmitted through cavitating bubble clouds both at a tissue-fluid interface and in water. The light attenuation was only detected when a bubble cloud was observed using high speed imaging. There were two types of bubbles studied: large macroscale bubbles and small microscale bubbles. The optical attenuation signals recorded activity of macroscale bubbles or bubble clouds large enough to cause light intensity loss. However, it was not sensitive enough to detect microscale bubbles including cavitation nuclei and bubble fragments following the collapse of the bubble cloud. Therefore, we used the optical signal to measure the cloud collapse cycle, and delayed a second pulse for bubble regeneration to indirectly measure the microscale bubble dissolution time. Based on the bubble cloud images (Figs. 2, 4, and 5), the optical signal was most likely measuring light through multiple bubbles along the laser beam, not the whole cloud (the laser beam was covering part of the whole cloud). However, since the bubbles within the cloud were growing and shrinking together, the dynamics of a portion of the bubble cloud may indicate the dynamics of the overall bubble cloud.
Our previous studies have shown tissue erosion was only seen with initiation of the variable acoustic backscatter signal.19 The time to initiation is shorter at higher pressures. After initiation, sometimes extinction of the variable acoustic backscatter occurs with the presence the ultrasound pulses, and correspondingly, erosion ceases.19 The initiation and extinction of the variable acoustic backscatter correlated well with initiation and extinction of the light attenuation. This result suggests that initiation of the variable backscatter is due to the formation of a cavitating bubble cloud. This provides additional evidence that the cavitating bubble cloud is essential for histotripsy induced tissue erosion. Though the acoustic backscatter here only observed the sound reflection of the therapy pulses, it is possible to detect acoustic emission at the collapse of the bubble cloud. However, it requires an acoustic detector of higher sensitivity and lower frequency than the one used in this study.
The collapse cycle of the bubble cloud was measured by the duration of the light attenuation. The collapse cycle of a bubble cloud produced by a histotripsy pulse of 4–14 μs was ~40–300 μs. The bubble cloud underwent growth and collapse long after the ultrasound pulse ended and the collapse cycle varied with different acoustic parameters. These results are consistent with collapse cycles of bubble clouds generated by lithotripsy shockwave pulses, where pressure levels are similar to those produced by histotripsy pulses. Previous passive acoustic detection studies23,28 and optical monitoring24–26 have shown the bubbles generated by a lithotripter pulse collapsing several hundred μsed after the pulse. Church’s model22 predicted the same trend.
Our results also show that residual bubbles (resulting cavitation nuclei) survived long (~30 ms) after the bubble cloud collapse. The number of residual cavitation nuclei decreased over time due to the dissolution of bubbles. Using the residual cavitation nuclei from the previous pulse as seeds, the bubble cloud can be re-initiated at a much lower pressure than what is required to initiate it. This result provides an explanation for our previous observations that erosion can be maintained at intensities significantly lower than the intensity threshold required to initiate erosion.20 The reduction in the cavitation threshold after the initial sonication pulse has been shown in vivo.38 Similarly, Parsons et al.13 found that higher amplitude pulses interleaved with lower amplitude pulses (applied several ms after) can maintain sufficient cavitation activity to generate significant mechanical tissue disruption, while higher-amplitude pulses alone mainly formed thermally mediated lesions. Moreover, previous PRF studies26,31 have demonstrated residual bubbles generated by a lithotripter pulse can last for several ms. The number of cavitation bubbles generated was greater with higher PRF, as residual bubbles from the previous pulse can serve as cavitation nuclei for the subsequent pulse. We do not exclude the possibility that tissue fragments from erosion may also serve as cavitation nuclei39 for subsequent pulses.
The long dissolution of residual cavitation nuclei is consistent with our working hypothesis for the histotripsy mechanism. Namely, each pulse generates a bubble cloud with two functions: (1) a subset of bubbles of the right size (cavitation nuclei) collapses to remove a portion of tissue fragments; and (2) the residual bubbles and bubble fragments from the collapse undergo dynamic changes between pulses and provide cavitation nuclei for subsequent pulses. We hypothesize that if the next pulse arrives at the tissue interface when the population and/or density of the cavitation nuclei is “just right,” optimal tissue erosion occurs. The timing, pressure, and duration of acoustic pulses are all expected to affect the dynamics of the bubble cloud and, subsequently, the erosion produced. We have achieved almost an order of magnitude faster erosion rate with the same amount of energy only by adjusting pulse duration.12 Further studies on monitoring of the bubble cloud dynamics are needed, especially on how acoustic parameters affect the bubble cloud.
The optical attenuation signals also detected the bubble cloud rebounds following the primary collapse cycle of the bubble cloud. The time interval between the main cycles and the duration and number of subsequent rebounds increased with increasing pressure, which has been consistently observed in radius-time curve measurements of bubble clouds generated by lithotripsy pulses.34 Interestingly, an additional attenuation peak always occurred at ~134 μs after the histotripsy pulse, which was the round trip travel time between the transducer and its focus. The timing of this additional light attenuation remained the same even at different pressures. A possible explanation for this peak is that the sound reverberation pressure from the source transducer surface was sufficient to drive the bubble cloud. This illustrates the greatly increased sensitivity of bubble cloud generation some time after a proceeding bubble cloud. This effect has important consequences for initiation and maintenance of the histotripsy treatment process and was studied previously.40
Optical signal tracking the ultrasound pulse wave form is another interesting observation. It is known that acoustic pressure fluctuations in the sound field can cause spatial-temporal variations in water density, resulting in changes to the water’s index of refraction and the light intensity pattern transmitted through the water, which is called the “Schlieren effect.”41 The observed optical signal at the instance of acoustic exposure was most likely caused by the Schlieren effect because it was observed when no bubbles were generated, and its peak amplitude increased with increasing acoustic pressure. When a bubble cloud was generated, this optical signal tracking ultrasound wave form varied widely even with the same acoustic parameters. In this case, we do not exclude the effect of bubble oscillation, but we were not able to extract the bubble oscillation effect from the optical signal mixed with the Schlieren effect.
The current optical system is not sensitive enough to detect small individual bubbles. In addition, the laser beam was not wide enough to cover a whole bubble cloud and bubbles outside the laser beam were not detected. The sensitivity of the current optical system can be improved by widening the laser beam width using optical lenses, higher laser power, use of the photodetector array, and increasing the sensitivity of the photodetector. High speed imaging is the most direct means to resolve the absolute sizes and spatial distribution of bubbles in the bubble cloud, and will be used in a future study.
V. CONCLUSIONS
We monitored the loss of light transmitted through bubble clouds generated by histotripsy pulses (4–14 μs long). The light attenuation correlated well to the bubble cloud formation observed by high speed imaging. The collapse cycle of a bubble cloud was detected to be 40–300 μs in duration. Residual bubbles survived 30 mes after the bubble cloud collapse. The number of the residual bubbles decreased over time due to bubble dissolution. Using the residual bubbles, the intensity threshold to regenerate bubble cloud is lower than that required to originally generate bubble cloud.
Acknowledgments
The authors thank Dr. Mary-Ann Mycek and Dr. Steve Ceccio for generously providing their lab resources to this work. We would like to thank Mekhala Raghavan, Ching-Wei Chang and Dhruv Sud for their help with high speed imaging. We want to thank Jessica Parsons for her help with acoustic calibration. This research has been funded in part by grants from the National Institutes of Health R01-HL077629, and Hitachi Central Research laboratory.
Footnotes
PACS number(s): 43.80.Gx, 43.35.Ei, 43.80.Sh [FD] Pages: 2421–2430
Contributor Information
Zhen Xu, Department of Biomedical Engineering, University of Michigan, Ann Arbor, Michigan 48109.
Timothy L. Hall, Department of Biomedical Engineering, University of Michigan, Ann Arbor, Michigan 48109
J. Brian Fowlkes, Department of Radiology and Biomedical Engineering, University of Michigan, Ann Arbor, Michigan 48109.
Charles A. Cain, Department of Biomedical Engineering and Electrical Engineering and Computer Science, University of Michigan, Ann Arbor, Michigan 48109
References
- 1.Fry FJ, Kossoff G, Eggleton RC, Dunn F. Threshold ultrasound dosages for structural changes in the mammalian brain. J Acoust Soc Am. 1970;48:1413–1417. doi: 10.1121/1.1912301. [DOI] [PubMed] [Google Scholar]
- 2.Dunn F, Fry FJ. Ultrasonic threshold dosages for the mammalian central nervous system. IEEE Trans Biomed Eng. 1971;18:253–256. doi: 10.1109/tbme.1971.4502847. [DOI] [PubMed] [Google Scholar]
- 3.Frizzell LA, Lee CS, Aschenbach PD, Borrelli MJ, Morimoto RS, Dunn F. Involvement of ultrasonically induced cavitation in hind limb paralysis of the mouse neonate. J Acoust Soc Am. 1983;74:1062–1065. doi: 10.1121/1.389941. [DOI] [PubMed] [Google Scholar]
- 4.ter Haar GR, Daniels S, Morton K. Evidence for acoustic cavitation in vivo: threshold for bubble formation with 0.75 MHz continuous-wave and pulsed beam. IEEE Trans Ultrason Ferroelectr Freq Control. 1986;33:162–164. doi: 10.1109/t-uffc.1986.26809. [DOI] [PubMed] [Google Scholar]
- 5.Fowlkes JB, Carson PL, Chiang EH, Rubin JM. Acoustic generation of bubbles in excised canine urinary bladders. J Acoust Soc Am. 1991;89:2740–2744. doi: 10.1121/1.400713. [DOI] [PubMed] [Google Scholar]
- 6.Hynynen K. Threshold for thermally significant cavitation in dog’s thigh muscle in vivo. Ultrasound Med Biol. 1991;17:157–169. doi: 10.1016/0301-5629(91)90123-e. [DOI] [PubMed] [Google Scholar]
- 7.Chapelon JY, Margonari J, Vernier F, Gorry F, Ecochard R, Gelet A. In vivo effects of high-intensity ultrasound on prostatic adenocarcinoma Dunning R3327. Cancer Res. 1992;52:6353–6357. [PubMed] [Google Scholar]
- 8.Smith NB, Hynynen K. The feasibility of using focused ultrasound for transmyocardial revascularization. Ultrasound Med Biol. 1998;24:1045–1054. doi: 10.1016/s0301-5629(98)00086-6. [DOI] [PubMed] [Google Scholar]
- 9.Tran BC, Seo J, Hall TL, Fowlkes JB, Cain CA. Microbubble-enhanced cavitation for noninvasive ultrasound surgery. IEEE Trans Ultrason Ferroelectr Freq Control. 2003;50:1296–1304. doi: 10.1109/tuffc.2003.1244746. [DOI] [PubMed] [Google Scholar]
- 10.Debus J, Peschke P, Hahn EW, Lorenz WJ, Lorenz A, Ifflaender H, Zabel HJ, Van Kaick G, Pfeiler M. Treatment of the Dunning prostate rat tumor R3327-AT1 with pulsed high energy ultrasound shock waves (PHEUS): Growth delay and histomorphologic changes. J Urol (Baltimore) 1991;146:1143–1146. doi: 10.1016/s0022-5347(17)38027-8. [DOI] [PubMed] [Google Scholar]
- 11.Coleman AJ, Kodama T, Choi MJ, Adams T, Saunders JE. The cavitation threshold of human tissue exposed to 0.2 MHz pulsed ultrasound: Preliminary measurements based on a study of clinical lithotripsy. Ultrasound Med Biol. 1995;21:405–417. doi: 10.1016/0301-5629(94)00116-u. [DOI] [PubMed] [Google Scholar]
- 12.Xu Z, Ludomirsky A, Eun LY, Hall TL, Tran BC, Fowlkes JB, Cain CA. Controlled ultrasound tissue erosion. IEEE Trans Ultrason Ferroelectr Freq Control. 2004;51:726–736. doi: 10.1109/tuffc.2004.1308731. [DOI] [PMC free article] [PubMed] [Google Scholar]
- 13.Parsons JE, Cain CA, Abrams GD, Fowlkes JB. Pulsed cavitational ultrasound therapy for controlled tissue homogenization. Ultrasound Med Biol. 2006;32:115–129. doi: 10.1016/j.ultrasmedbio.2005.09.005. [DOI] [PubMed] [Google Scholar]
- 14.Roberts WW, Hall TJ, Ives K, Wolf JJS, Fowlkes JB, Cain CA. Pulsed cavitational ultrasound: A noninvasive technology for controlled tissue ablation (histotripsy) in the rabbit kidney. J Urol (Baltimore) 2006;175:734–738. doi: 10.1016/S0022-5347(05)00141-2. [DOI] [PubMed] [Google Scholar]
- 15.Pishchalnikov YA, Sapozhnikov OA, Bailey MR, Williams JCJ, Cleveland RO, Colonius T, Crum LA, Evan AP, McAteer JA. Cavitation bubble cluster activity in the breakage of kidney stones by lithotripter shockwaves. 2003;17:435–446. doi: 10.1089/089277903769013568. [DOI] [PMC free article] [PubMed] [Google Scholar]
- 16.Zabolotskaya EA, Ilinskii YA, Meegan GD, Hamilton MF. Bubble interactions in clouds produced during shock wave lithotripsy. 2004 IEEE Ultrasonics Symposium; Montreal, Canada. 23–27 Aug; 2004. pp. 890–893. BN - 890 7803 8412 7801. [Google Scholar]
- 17.Arora M, Junge L, Ohl CD. Cavitation cluster dynamics in shock-wave lithotripsy: Part 1. Free field. Ultrasound Med Biol. 2005;31:827–839. doi: 10.1016/j.ultrasmedbio.2005.02.007. [DOI] [PubMed] [Google Scholar]
- 18.Matsumoto Y. Bubble and bubble cloud dynamics. 15th International Symposium on Nonlinear Acoustics; Gottingen, Germany. 1999. pp. 65–74. [Google Scholar]
- 19.Xu Z, Fowlkes JB, Rothman ED, Levin AM, Cain C. Controlled ultrasound tissue erosion: The role of dynamic interaction between insonation and microbubble activity. J Acoust Soc Am. 2005;117:424–435. doi: 10.1121/1.1828551. [DOI] [PMC free article] [PubMed] [Google Scholar]
- 20.Xu Z, Fowlkes JB, Ludomirsky A, Cain CA. Investigation of intensity threshold for ultrasound tissue erosion. Ultrasound Med Biol. 2005;31:1673–1682. doi: 10.1016/j.ultrasmedbio.2005.07.016. [DOI] [PMC free article] [PubMed] [Google Scholar]
- 21.Kieran K, Hall TL, Parsons JE, Wolf JS, Fowlkes JB, Cain CA, Roberts WW. Exploring the acoustic parameter space in ultrasound therapy: Defining the threshold for cavitational effects. Sixth International Symposium on Therapeutic Ultrasound; Oxford, UK. 2006. p. S01. [Google Scholar]
- 22.Church CC. A theoretical study of cavitation generated by an extracorporeal shock wave lithotripter. J Acoust Soc Am. 1989;86:215–227. doi: 10.1121/1.398328. [DOI] [PubMed] [Google Scholar]
- 23.Coleman AJ, Whitlock M, Leighton T, Saunders JE. The spatial distribution of cavitation induced acoustic emission, sonoluminescence and cell lysis in the field of a shock wave lithotripter. Phys Med Biol. 1993;38:1545–1560. doi: 10.1088/0031-9155/38/11/001. [DOI] [PubMed] [Google Scholar]
- 24.Jochle K, Debus J, Lorenz WJ, Huber P. A new method of quantitative cavitation assessment in the field of a lithotripter. Ultrasound Med Biol. 1996;22:329–338. doi: 10.1016/0301-5629(96)00031-2. [DOI] [PubMed] [Google Scholar]
- 25.Matula TJ, Hilmo PR, Bailey MR, Crum LA. In vitro sonoluminescence and sonochemistry studies with an electrohydraulic shock-wave lithotripter. Ultrasound Med Biol. 2002;28:1199–1207. doi: 10.1016/s0301-5629(02)00568-9. [DOI] [PubMed] [Google Scholar]
- 26.Huber P, Debus J, Peschke P, Hahn EW, Lorenz WJ. In vivo detection of ultrasonically induced cavitation by a fibre-optic technique. Ultrasound Med Biol. 1994;20:811–825. doi: 10.1016/0301-5629(94)90038-8. [DOI] [PubMed] [Google Scholar]
- 27.Coleman AJ, Choi MJ, Saunders JE. Detection of acoustic emission from cavitation in tissue during clinical extracorporeal lithotripsy. Ultrasound Med Biol. 1996;22:1079–1087. doi: 10.1016/s0301-5629(96)00118-4. [DOI] [PubMed] [Google Scholar]
- 28.Zhong P, Cioanta I, Cocks FH, Preminger GM. Inertial cavitation and associated acoustic emission produced during electrohydraulic shock wave lithotripsy. J Acoust Soc Am. 1997;101:2940–2950. doi: 10.1121/1.418522. [DOI] [PubMed] [Google Scholar]
- 29.Chen WS, Matula TJ, Crum LA. The disappearance of ultrasound contrast bubbles: Observations of bubble dissolution and cavitation nucleation. Ultrasound Med Biol. 2002;28:793–803. doi: 10.1016/s0301-5629(02)00517-3. [DOI] [PubMed] [Google Scholar]
- 30.Huber P, Jochle K, Debuss J. Influence of shock wave pressure amplitude and pulse repetition frequency on the lifespan, size and number of transient cavities in the field of an electromagnetic lithotripter. Phys Med Biol. 1998;43:3113–3128. doi: 10.1088/0031-9155/43/10/029. [DOI] [PubMed] [Google Scholar]
- 31.Sapozhnikov OA, Khokhlova VA, Bailey MR, Williams JC, Jr, McAteer JA, Cleveland RO, Crum LA. Effect of overpressure and pulse repetition frequency on cavitation in shock wave lithotripsy. J Acoust Soc Am. 2002;112:1183–1195. doi: 10.1121/1.1500754. [DOI] [PubMed] [Google Scholar]
- 32.Parsons JE, Cain CA, Fowlkes JB. Cost-effective assembly of a basic fiber-optic hydrophone for measurement of high-amplitude therapeutic ultrasound fields. J Acoust Soc Am. 2006;119:1432–1440. doi: 10.1121/1.2166708. [DOI] [PubMed] [Google Scholar]
- 33.AIUM Acoustic Output Measurement Standard for Diagnostic Ultrasound Equipment, UD2-98 (AIUM/NEMA, 1998).
- 34.Matula TJ, Hilmo PR, Storey BD, Szeri AJ. Radial response of individual bubbles subjected to shock wave lithotripsy pulses in vitro. Phys Fluids. 2002;14:913–921. [Google Scholar]
- 35.Chen JF, Zagzebski JA, Madsen EL. Tests of backscatter coefficient measurement using broadband pulse. IEEE Trans Ultrason Ferroelectr Freq Control. 1993;40:603–607. doi: 10.1109/58.238114. [DOI] [PubMed] [Google Scholar]
- 36.Urayama PK, Zhong W, Beamish JA, Minn FK, Sloboda RD, Dragnev KH, Dmitrovsky E, Mycek MA. A UV-visible-NIR fluorescence lifetime imaging microscope for laser-based biological sensing with picosecond resolution. Appl Phys B: Lasers Opt. 2003;B76:483–496. [Google Scholar]
- 37.Parsons JE, Fowlkes JB, Cain CA. Acoustic backscatter features associated with production of tissue homogenate using pulsed cavitational ultrasound therapy. International Symposium on Therapeutic Ultrasound; Boston, MA. 2005. pp. 323–327. [Google Scholar]
- 38.Miller DL. The effects of ultrasonic activation of gas bodies in Elodea leaves during continuous pulsed irradiation at 1 MHz. Ultrasound Med Biol. 1977;3:221–240. doi: 10.1016/0301-5629(77)90073-4. [DOI] [PubMed] [Google Scholar]
- 39.Carstensen EL, Flynn H. The potential for transient cavitation with microsecond pulses of ultrasound. Ultrasound Med Biol. 1982;8:720–724. doi: 10.1016/0301-5629(82)90134-x. [DOI] [PubMed] [Google Scholar]
- 40.Xu Z, Fowlkes JB, Cain CA. A new strategy to enhance cavitational tissue erosion by using a high intensity initiating sequence. IEEE Trans Ultrason Ferroelectr Freq Control. 2006;53:1412–1424. doi: 10.1109/tuffc.2006.1665098. [DOI] [PMC free article] [PubMed] [Google Scholar]
- 41.Pitts TA, Greenleaf JF, Lu YY, Kinnick RR. Proceedings of IEEE Ultrasonics Symposium. Vol. 3. Cannes; France: 1994. Tomographic Schlieren imaging for measurement of beam pressure and intensity; pp. 1665–1668. [Google Scholar]